

Introduction
China is endowed with abundant hot dry rock (HDR) resources, equivalent to 860×1012 t of standard coal, which accounts for about 1/6 of the global resources, highlighting significant development potential [1]. Within the energy consumption structure, a 1% increase in the utilization of geothermal energy is equivalent to a reduction of 9 400×104 t of carbon dioxide emissions [2]. Consequently, the efficient development of HDR resources is of strategic importance for improving China's energy structure and facilitating the achievement of the "dual carbon" goal [2-3].
HDRs possess low permeability and are characterized by the development of natural fractures. The utilization of hydraulic fracturing to connect these natural fractures and create a high-permeability fracture network with sufficient heat exchange area and efficiency is crucial to the effective exploitation of HDR resources [1,4]. Scholars have conducted extensive numerical simulation studies through the development of HDR injection-production multi-field coupling models [5]. These studies have systematically analyzed the effects of geological conditions (spacing between natural fractures, reservoir heterogeneity, and temperature gradient) and extraction processes (injection temperature, injection rate, distance between injection and production wells) on the heat extraction performance of HDRs [6⇓⇓⇓⇓⇓-12]. In addition, the comprehensive evaluation of the performance was also conducted[13⇓⇓-16]. During the long-term injection and production process in HDR reservoirs, the fracture width changes due to the effects of low-temperature shock and fluid pressure. Consequently, scholars have discussed the influence of thermoelastic and poroelastic effects on the fracture width evolution [17⇓-19]. Numerical simulation method can reflect the complex physical processes and the coupling relationships between different physical processes during the long-term injection and production. However, these models are often based on some assumptions, e.g. fluid flow obeys Darcy's Law, heat exchange between rock and fluid meets local thermal equilibrium, and a simplified representation of fracture morphology and fracture width evolution. Therefore, the results may not accurately reflect the actual heat extraction process of HDRs.
To investigate the fluid flow and heat transfer process within fractures, some researchers have carried out single-fracture experiments by using split small cylindrical rock samples. Some meaningful conclusions were obtained [20⇓⇓-23]. Bai et al. [24] proposed that the heat transfer coefficient showed a positive correlation with the flow velocity, but decreased with the increase of fracture width. Shu et al. [25-26] analyzed the variation laws of fracture permeability and heat extraction performance due to changes in temperature and confining pressure. However, the heat extraction process in HDR fracture systems is extremely complex. During long-term injection and production, the fracture network undergoes dynamic evolution. As dominant flow channels emerge between injection and production wells, a "thermal short-circuit effect" can occur in the fracture network, reducing the effective heat exchange area and significantly reducing heat extraction efficiency. For example, the early thermal breakthrough in the Hijiori project of Japan resulted in the formation of dominant channels, causing the wellbore temperature to drop from 163 °C to below 100 °C [27]. Moreover, the development of natural fractures in the HDR and the loss of heat exchange fluid were significant factors in the low heat extraction efficiency of HDRs [28]. In the later stages of the Rosemanowes project of UK and the Ogachi project of Japan, the loss of heat exchange fluid exceeded 70% [29⇓-31]. Due to the small scale and the simple fracture channel, single fracture fluid flow and heat transfer experiments cannot adequately capture the complex injection and production processes of HDRs. Thus, it is necessary to conduct large-scale physical simulation experiments of injection and production of HDRs. Song et al. [32] used artificial rock samples to evaluate the injection-production performance of multi-branch geothermal wells. They discussed the effects of different parameters on the injection-production capacity of branch wells, and compared the injection-production effects of multi-branch well systems with single-well systems. Hu et al. [33] created artificial fractures in rock samples by fracturing and then conducted experiments with one injection well and multiple production wells. Their research results showed that the effective fracture area, rather than the total fracture area, determined the heat extraction performance of HDRs; additionally, by gradually increasing the injection rate, the excessive fracture propagation and high injection pressure could be avoided. Although these experimental researches reflect the heat extraction process to some extent, the influence of the dominant channels and the fluid leakoff on the injection-production performance has not been discussed. In conclusion, there is a scarcity of the large-scale injection-production physical simulation experimental studies for HDRs, and to date, no reports have been found on injection-production experiments within the natural fracture systems of HDR's.
This paper focused on the HDR in the Gonghe Basin of Qinghai Province as the research object. An independently developed true triaxial multi-physical field large- scale physical simulation experimental system of in-situ injection and production was employed to conduct the long-term injection-production experiments with multiple fractures and wells. By conducting multi-well connectivity experiments, the spatial characteristics of the internal natural fracture system in the rock samples and their connectivity with the wellbores were preliminarily analyzed. Then, the experiments with one injection well and two production wells, one injection well and one production well were performed to study the characteristics of the production temperature, production flow rate, heat recovery rate, and fluid recovery rate over time. The effects of the dominant channels and heat exchange fluid leakoff on the heat extraction performance were focused, thus providing the theoretical basis and reference for the efficient development of HDR.
1. Geologic overview of the Gonghe Basin in Qinghai
The Gonghe Basin and its surrounding deformed zones in Qinghai were formed within the slip subduction zone, which was influenced by the significant left-lateral strike-slip movements along the Kunlun and Haiyuan faults. This area has undergone two major stages of development, the Miocene rotation-dominated Pan-Lake Basin depression and the Pliocene-Quaternary compression-torsion deformation. Continuous left-lateral strike- slip deformation throughout the Pliocene, culminating in lithospheric uplift deformation, acts as the primary driving mechanism for the transfer of deep thermal energy to shallower strata [34].
Temperature measurements on HDR from the exploration well GR1 within the Gonghe Basin indicate that at a depth of 2 500 m, the temperature reaches 150 °C, indicating the start of the HDR section. At the final depth of 3 705 m, the temperature reaches 236 °C. In the interval between 2 800 m and 3 705 m, the temperature gradient exceeds 80°C/km, classifying this region as a medium quality or better HDR strata [35-36].
HDRs in the Gonghe Basin of Qinghai are predominantly dense, with planar porosity ranging from 1% to 3%, with dissolution pores and intercrystalline micropores. Well cores and outcrops reveal the development of the fractures [35], identifying it as a typical fractured heat reservoir. As shown in Fig. 1 , the granite outcrop appears to be highly fragmented, with fractures intersecting each other in both vertical and horizontal directions. The fractures are mainly characterized by high-angle fractures and horizontal fractures, and are filled with mud (partially mixed with quartz), which act as the main channels for heat extraction in HDRs.
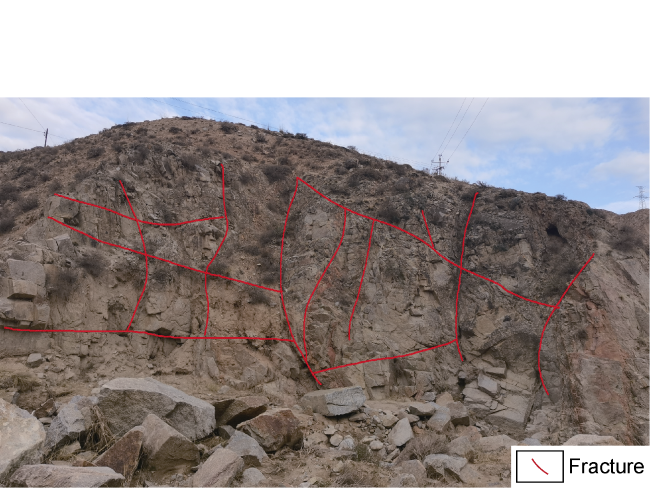
Fig. 1. Granite outcrop in the Gonghe Basin, Qinghai. |
2. Multi-well long-term injection-production experimental system for HDR
The long-term in-situ injection-production physical simulation experiment for HDR utilized the true triaxial multi-physical field large-scale physical simulation experimental system independently developed by the Geology-Engineering Integration and Equipment Team of Chengdu University of Technology. The experimental system consists of an operation control console, a true triaxial experimental apparatus, a triaxial servo-loading system, a high-pressure multi-pore injection system, and a monitoring system of temperature, flow rate and pressure. Fig. 2 illustrates the experimental setup.
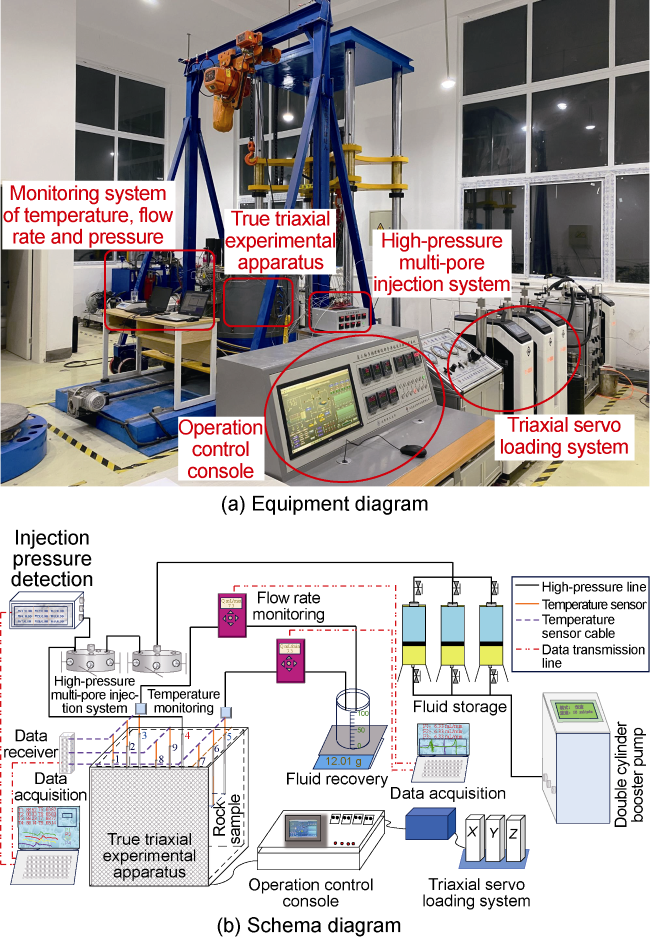
Fig. 2. Multi-well long-term injection-production experimental system for HDR. |
The true triaxial test facility serves as the core area for conducting experiments and is designed for sample placement, true triaxial loading, and simulation of high temperature and high pressure environments. Rock samples up to a maximum size of 400 mm×400 mm×400 mm can be accommodated. Reverse stress is applied to the test apparatus by the vessel body and moving head, while the triaxial loading module employs unidirectional hydraulic cylinder loading with one end fixed, thereby creating a reverse loading structure with a maximum loading stress of 50 MPa. Heating is facilitated by an embedded device, with multiple heaters mounted on the bearing plate to heat the medium to a set temperature, up to a maximum of 200 °C. K-type thermocouples are utilized for temperature measurement. In addition, the external surfaces of the true triaxial chamber cylinder and bearing plate are coated with high-temperature insulating paint, which effectively prevents heat transfer. The high-pressure multi-pore injection system controls the double-acting hydraulic cylinder servo booster at the secondary end via a four-way servo valve with primary boost, which can achieve a maximum pressure of up to 100 MPa.
3. Experimental program for the multi-well long-term injection-production experiment for HDR
3.1. Rock sample preparation
The granite rock samples for the experiment were taken from the Reshuigou area in the Gonghe Basin, Qinghai. The granite in this area is similar in composition and age to the granite sampled in the GR1 exploration well. Measured values include a specific heat capacity of 0.9 kJ/(kg·K) and a thermal conductivity of 1.92 W/(m·K), both within the range of thermal property test results for core samples from well GR1 [35].
The 400 mm cubic sample was obtained from outcrop by cutting and polishing (Fig. 3a , 3b ). Observation of the surface of the rock samples allowed a preliminary identification of the characteristics of the fracture distribution. Drilling into the surface of the rock sample simulated wellbores, with a total of 9 holes. The drilling depth was 300 mm, with a spacing of 140 mm between holes. The casing was made from 316L stainless steel hollow tubes with an outer diameter of 16 mm and an inner diameter of 6 mm. Throughout the cementing process, the pipes were run to a depth of 100 mm, and the annulus between the casing and the wellbore was fixed with high temperature and high pressure resistant epoxy resin. At the bottom of the cementing section, a 200 mm open hole was remained as shown in Fig. 3c .
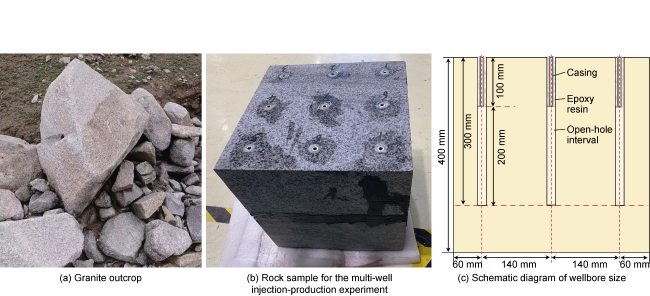
Fig. 3. Rock sample for the multi-well long-term injection-production experiment for HDR. |
3.2. Set temperature for experimental rock samples
Heat extraction from HDRs involves a thermal exchange process between low-temperature fluid and high- temperature rock. When subjected to low temperatures, the mechanical properties of the high-temperature rock may be altered, affecting the heat extraction performance of HDRs. To design the injection temperature in the experiments, cylindrical granite samples from the same batch in the Gonghe Basin, Qinghai, were heated to 250 °C and 400 °C, and then cooled with 25 °C water to perform uniaxial compression and permeability experiments. As shown in the experimental results in Table 1 , the variations in mechanical parameters and permeability of granite at 250 °C due to thermal shock are negligible. However, at 400 °C, granite experienced a reduction in mechanical strength and an increase in permeability due to thermal shock. Thus, for the HDR in the Gonghe Basin, Qinghai, where the temperature reached 236 °C at a depth of 3 705 m, the effect of low-temperature shock on the rock properties was considered minimal. To simplify the experiment, this study adopted 75 °C as the temperature for the rock samples, and concentrated on analyzing the effects of natural fractures and the leakoff on heat extraction performance.
Table 1. Influence of low-temperature shock on mechanical properties of granite from Gonghe Basin, Qinghai |
| Operating conditions | Uniaxial strength/MPa | Elastic modulus/GPa | Poisson's ratio | Permeability/ 10-3 μm2 |
|---|---|---|---|---|
| Rock sample at normal temperature without low-temperature shock | 160 | 38 | 0.18 | 0.002 5 |
| Rock sample at 250 °C subjected to low-temperature shock | 162 | 33 | 0.18 | 0.003 1 |
| Rock sample at 400 °C subjected to low-temperature shock | 135 | 31 | 0.21 | 0.007 2 |
3.3. Experimental program for the multi-well injection-production experiments
The connectivity between wells and internal fractures in the rock samples, together with the connectivity between wells, is the basis for the selection of injection and production wells in the experiments. Consequently, the multi-well connectivity experiments were carried out first in this study. Subsequently, drawing on the outcomes of the multi-well connectivity experiments, suitable wells were chosen as the injection and production wells for the multi-well injection-production experiments.
3.3.1. Multi-well connectivity experiments
Initially, water was injected into each well independently with the other eight wells closed, and the injection pressure for that well was continuously monitored to evaluate its connectivity with the internal fractures of the rock sample. Each well was then sequentially opened, with the remaining seven wells maintained in a closed state, to monitor fluid output and ascertain well-to-well connectivity. Finally, all connected wells were opened simultaneously, and the order and volume of the fluid output was used to make a preliminarily assessment of the relative strength of the flow conductivity through the channels between the wells. From these experimental results, the characteristics of the internal fractures and the spatial relationship between the fracture system and the wellbore were preliminarily identified. Then, the results are used to guide the selection of the suitable injection and production wells for the subsequent injection-production experiments.
3.3.2. Multi-well injection-production experiments
The injection and production wells were selected based on the results of the multi-well connectivity experiments. Initially, the rock sample was heated in an oven at a rate of 5 °C/h to the experimentally set temperature of 75 °C and held at this temperature for approximately 48 h. When a bottom temperature of (70±5) °C was reached at the injection and production wells, the rock sample was removed from the oven and placed in the pre-heated true triaxial chamber (also pre-heated to 75 °C), followed by the connection of piping and data acquisition instrumentation in preparation for the injection-production experiment. The outside of the true tri-axial chamber cylinder and support plate were coated with high-temperature insulation. During the preliminary thermal insulation experiment in the true tri-axial chamber, 8 h of temperature monitoring showed a slow decrease in well bottom temperature in all 9 wells, averaging a cooling rate of 0.2 °C/h. Hence, heat loss due to the natural cooling of the rock sample was disregarded in the injection-production experiment. A low triaxial stress (1 MPa in all directions) was applied to the rock sample, along with a fluid injection temperature of 25 °C. In this study, which focused on the effect of known natural fractures on heat extraction performance, the injection pressure was set at 2-3 MPa to prevent the induction of new fractures by fluid pressure.
The injection-production experiment lasted for 8 h, controlled by flow rate with a constant fluid injection temperature of 25 °C. Under two operating conditions: First, for the initial 3 h, the heat exchange fluid was injected into one well, with two wells designated as the production wells and the rest as monitoring wells, with the injection flow rate set at 10 mL/min. Secondly, for the remaining 5 h, one production well was closed, changing the setup from one injection well with two production wells to one injection well with one production well, and the injection flow rate was reduced to 5 mL/min. In both scenarios, the production temperature (fluid temperature at the wellhead), the monitoring well temperature (bottom well temperature), and the production flow rates were continuously monitored with a 10 s of data collection cycle.
4. Experimental results
4.1. Multi-well connectivity in HDR
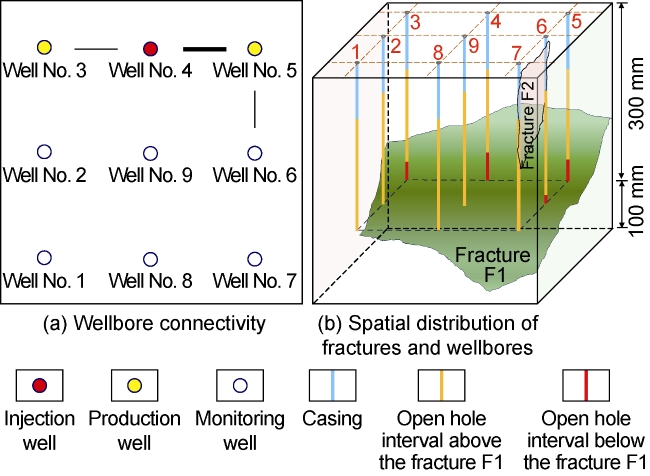
Fig. 4. Schematic diagram of wellbore connectivity and spatial distribution of fractures in rock samples (the thickness of the lines in |
The analysis shows that wells No. 3, No. 4, No. 5, and No. 6 are interconnected, with the flow channel between wells No. 4 and No. 5 being the most conductivity, followed by the channel between wells No. 4 and No. 3, and the channel between wells No. 5 and No. 6 being the least conductive. Furthermore, wells No. 1, No. 2, No. 7, No. 8, and No. 9 are not interconnected (Fig. 4a ). Deducing from the fluid output from wellbores and the rock sample surface, the internal fracture system of the rock sample consists primarily of two fractures: Fracture F1 connects wells No. 3, No. 4, No. 5 and No. 6, and fracture F2 connects well No.6 to the surface of the rock sample (Fig. 4b ). Consequently, for the multi-well long-term injection-production experiment in HDR, well No. 4 is designated as the injection well, with wells No. 3 and No. 5 as the production wells, emulating a mode of one injection well and two production wells mode; later, well No. 5 was shut down to change to a mode of one injection well with one production well mode until the end of the experiment. Table 2 summarizes the conditions of the injection-production experiments.
Table 2. Experimental conditions of the injection-production of HDR |
| Operation conditions | Injection well | Production well | Closed wells | Injection flow rate/(mL·min−1) | Duration/h |
|---|---|---|---|---|---|
| 1 | Well No. 4 | Wells No. 3 and No. 5 | Wells No. 1-2 and wells No. 6-9 | 10 | 3 |
| 2 | Well No. 4 | Well No. 3 | Wells No. 1-2 and wells No. 5-9 | 5 | 5 |
4.2. Heat extraction performance of HDR
Within the HDR injection-production experiment, which includes the one injection well with two production wells and one injection well with one production well, this study evaluates the heat extraction performance at different stages, considering the production flow rate, production temperature, heat recovery rate and fluid recovery rate of the production wells.
4.2.1. Production flow rate and temperature
In the multi-well long-term injection-production experiments for HDR, the changes in production flow rate and temperature of wells No. 3 and No. 5 with the low-temperature fluid injection time, are shown in Fig. 5.
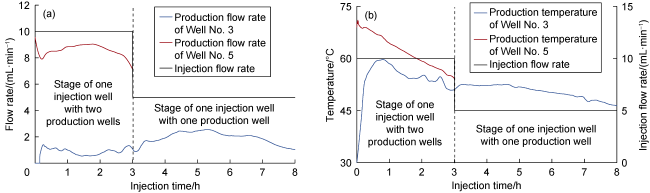
Fig. 5. Production flow rate (a) and temperature (b) over time during injection-production process. |
During the development stage of one injection well and two production wells, analysis revealed that the conductivity of the flow channel between wells No. 4 and No. 5 exceeded that between wells No. 4 and No. 3. In the early stage of the injection-production, fluid rapidly emerged from well No. 5, reaching a flow rate of 9.4 mL/min, which was close to the injection rate of 10 mL/min. After 10 min, fluid began to emerge from well No. 3, with the flow rate gradually reaching 1.4 mL/min, while the flow rate from well No. 5 began to decrease. With continued injection of low-temperature fluid and the flow rate of well No. 5 dropping to 7.8 mL/min, the conductivity between wells No. 4 and No. 5 enhanced, facilitated by the thermal shock and injection pressure, resulting in an increased flow rate from well No. 5. The trend suggested a competitive dynamic between the production flow rates of wells No. 5 and No. 3: as the flow rate of well No. 5 increased, the flow rate of Well No. 3 decreased. Under the external load, the conductivity between wells No. 3 and No. 4 gradually increased, and the flow rate of Well No. 3 exhibited fluctuation in a generally declining trend. As the flow rate from Well No. 5 increased again to 9 mL/min, the fracture width between wells No. 5 and No. 4 changed slightly, while the conductivity between wells No. 4 and No. 3 increased, resulting in an increased flow rate of well No. 3 and a diminished flow rate of well No. 5. The observed increase in temperature from well No. 6 suggested the activation of the previously closed fractures between wells No. 5 and No. 6. There was then more fluid leakoff to well No. 6 and a more rapid decrease in the flow rate of well No. 5, falling to 7.1 mL/min. In terms of the production temperature, the high flow rate of well No. 5 enabled its production temperature to quickly reach a peak of 71 °C. For well No. 3, despite starting with zero flow rate, a temperature could still be measured due to the effective thermal conductivity of the metal tubing. Subsequently, the production temperature of well No. 3 increased as the injection-production process continued, reaching a maximum of 60 °C at the wellhead after 0.8 h. After reaching the peak, the temperature of well No. 5 declined more quickly, but the rate of decrease slowed as new heat exchange areas were created. Overall, the conductivity between wells No. 4 and No. 5 was high, with variations in fracture width during injection too small to affect the downward trend in production temperature. Due to the continuous and sufficient heat exchange between the low-temperature fluid and the fracture surface, the fluctuation in the production temperature curve of well No. 5 can be neglected. The conductivity between wells No. 4 and No. 3 restricted the heat exchange to a more limited area, resulting in a faster initial drop in the production temperature. Following the activation of the previously closed fractures and the development of new heat exchange areas, the production temperature increased, with variable changes in the curve. This suggests that the degree of the fracture closure and the activation process influenced the stability of the production temperature. Then, the rate of the temperature decline between wells No. 5 and No. 3 during the injection-production period was compared. Within the period of 0.8 h to 3.0 h, the production temperature of well No. 5 fell from 66 °C to 54 °C (a reduction of 12 °C), and the production temperature of well No. 3 fell from 60 °C to 51 °C (a reduction of 9 °C). The greater fluid flow and enhanced heat exchange efficiency between wells No. 5 and No. 4 resulted in a more rapid cooling rate for well No. 5. The new heat exchange area between wells No. 3 and No. 4 slowed the temperature decline for well No. 3.
During the stage of one injection well and one production well, well No. 5 was closed. Compared to the previous stage, more fluid flowed towards well No. 3, which increased pressure within the inter-well fractures and enhanced fracture conductivity, gradually increasing the production flow rate. However, the closure of well No.5 allowed some fluid to potentially be diverted into well No.6 via the flow channel between wells No. 5 and No. 6 or to leakoff through nearby fractures. In addition, the injection flow rate decreased from 10 mL/min to 5 mL/min. As a result, the increase in production flow rate from well #3 following the closure of well #5 was modest, with no rapid increase, and slowly decreased as fluid leakage increased. In the early stage of the one injection well and one production well, increases in both production flow rate and temperature at well No. 3 signalled an expansion of the heat exchange area between wells No. 3 and No. 4. Over the next 1.5 h, the production flow rate of well No. 3 increased, but the production temperature remained constant, indicating that the newly formed heat exchange area during this period was comparatively small. As fluid injection continued, the efficiency of the heat exchange within the flow channels decreased, resulting in a downward trend in the production temperature of well No. 3 from 53 °C to 47 °C (a decline of 6 °C). Compared to the stage of one injection well and two production wells, the rate of decline in the production temperature was less pronounced for well No. 3.
4.2.2. Heat recovery rate
In order to analyze the heat extraction performance of the production wells, the heat recovery rate in this study is defines as:
$\eta=\rho c q \Delta T$
In the case of one injection well with two production wells and one injection well with one production well, the heat recovery rates of wells No. 3 and No. 5 over time are shown in Fig. 6. According to Eq. (1), the heat recovery rate was primarily determined by the production flow rate and the temperature difference between injection and production fluids. For well No. 5, an initial rapid decrease in flow rate caused the heat recovery rate to drop from 29.4 J/s to 24.3 J/s. Subsequently, despite a continuous decrease in production temperature, the heat recovery rate increased slightly with increasing flow rate. After reaching 25.4 J/s, the influence of the production temperature became increasingly significant, resulting in a continuous decrease in the heat recovery rate, with changes in the production flow rate affecting the rate of decrease. After 3 h of fluid injection, the heat recovery rate fell to 15.5 J/s. Given the changing trends in the production temperature and flow rate, the initial phase of the heat recovery rate of well No. 5 was governed by the production flow rate, whereas the later phase was predominantly influenced by the production temperature. For well No. 3, the temporal variation of the heat recovery rate was mainly determined by the production flow rate. In the stage of one injection well and two production wells, the heat recovery rate of well No. 3 increased rapidly to 2.8 J/s after fluid emergence. Subsequently, the recovery rate fluctuated with changes in the production flow rate, and stabilized at an average of 2.0 J/s, which was significantly lower than that of well No. 5. During the stage of one injection well and one production well, the heat recovery rate of well No. 3 exhibited no significant increase, displaying a pattern of an initial increase followed by a decrease. The average recovery rate was 3.6 J/s, which was higher than the average of the previous stage. Overall, during the 8 h of fluid injection and production, well No. 3 maintained a low heat recovery rate (only 2.8 J/s on average). As the heat recovery rate of well No. 5 significantly exceeded that of well No. 3, well No. 5 dominated the heat recovery rate throughout the entire stage of one injection well and two production wells.
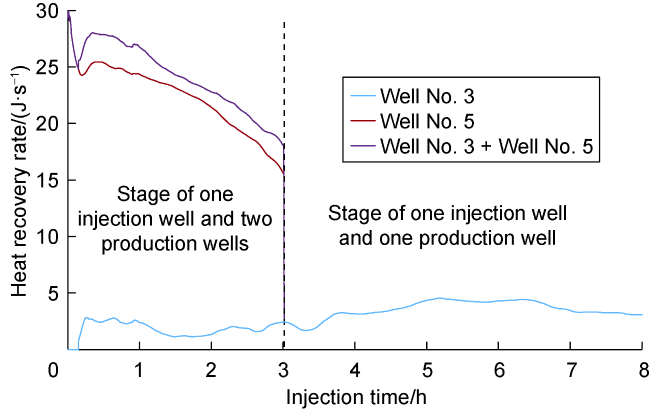
Fig. 6. The curves of the heat recovery rate changes over time during injection-production process. |
4.2.3. Fluid recovery rate
To analyze the effect of the fluid leakoff on the heat extraction performance during the injection-production process, this study defines the fluid recovery rate as:
During the stages of one injection well with two production wells and one injection well with one production well, the fluid recovery rates of wells No. 3 and No. 5 over time are shown in Fig. 7. Derived from the results of the multi-well connectivity analysis, it is evident that the internal fracture system within the rock sample was relatively simple. Given that the production flow rate from well No. 5 exceeded that of well No. 3, the fluid recovery of well No. 5 was significantly higher than that of well No. 3 during the first stage. Initially, the flow channel between wells No. 4 and No. 5 had a higher conductivity than that between wells No. 3 and No. 4. The fluid quickly flowed out of well No. 5 while well No. 3 yielded only a minimal amount. As the injection progressed, the conductivity of the flow channel between wells No. 3 and No. 4 increased, causing the channel and wellbore of well No. 3 to gradual filling with fluid. Subsequently, the fluid produced from well No. 5 was reduced and the recovery dropped from 95% to 79%. Following the commencement of fluid production from well No. 3, the production flow rate within well No. 5 increased, increasing its recovery, while the recovery of well No. 3 decreased. However, the overall recovery showed an upward trend. Subsequently, the overall recovery remained stable at around 95%, which suggested minimal fluid leakoff. With the enhanced conductivity of the flow channel between wells No. 5 and No. 6, there was an increase in fluid leakoff. Although the recovery of well No. 3 increased, the rapid decline in the recovery of well No. 5 resulted in a downward trend in the overall recovery. After 3 h of fluid injection, the overall recovery decreased to 82%, with the recovery of wells No. 3 and No. 5 being 11% and 71%, respectively. It can be seen that during the stage of one injection well and two production wells, the proportion of the recovery of well No. 5 was relatively large and significantly influenced the trend of the total recovery. During the initial stage of one injection well and one production well, both the production flow rate and the recovery of well No. 3 increased. However, as some of the fluid flowed into well No. 6 through the flow channel between wells No. 5 and No. 6, and into adjacent fractures, the overall recovery remained low and peaked at only 51%. In the later stage, as the volume of the fluid leakoff increased, the recovery of well No. 3 showed a downward trend. After 8 h of the fluid injection and production, the recovery dropped to 21%, accompanied by a fluid loss of 79%, which was much higher than that of 18% in the stage of one injection well with two production wells.
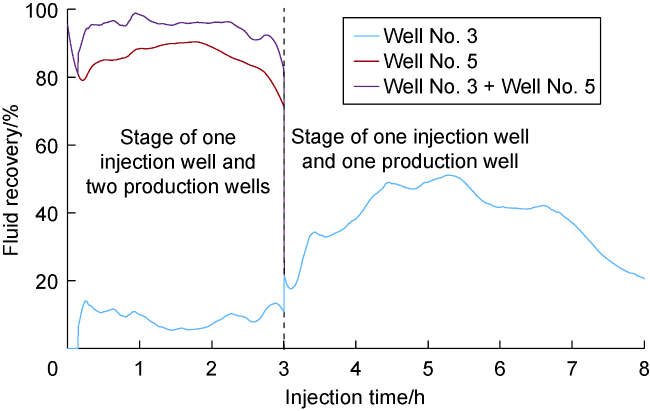
Fig. 7. The curve of fluid recovery over time during the injection-production process. |
4.2.4. Temperatures of monitoring wells
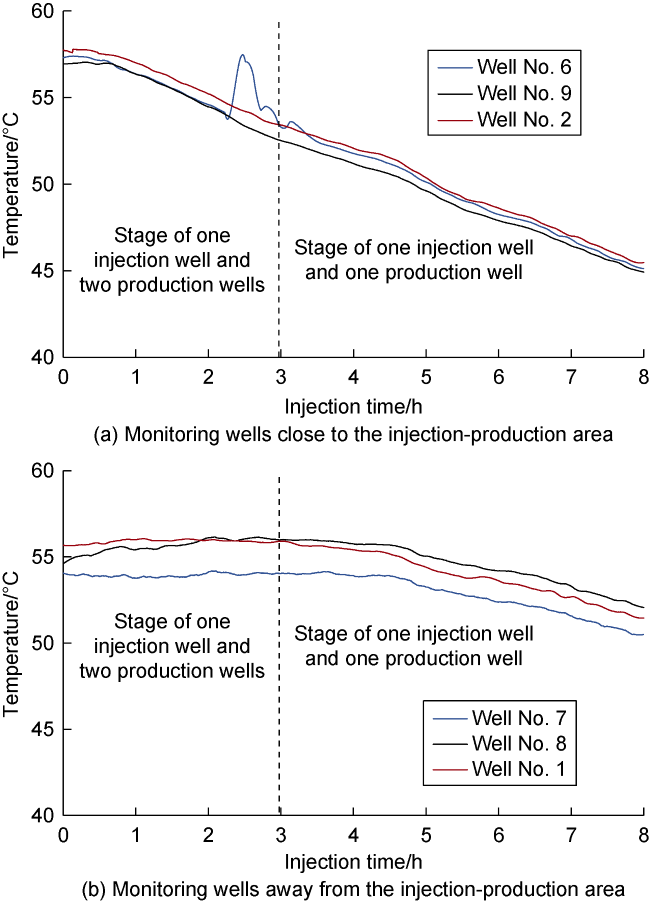
During the injection-production experiment, the other six wells, in addition to the injection and production wells, served as monitoring wells. The temperatures of these wells were recorded to analyze the resulting temperature changes in the rock sample. Based on the relative distance between the monitoring wells and the injection-production area, the six wells were divided into two groups: wells No. 2, No. 6 and No. 9, which were located close to the injection-production area, and wells No. 1, No. 7 and No. 8, which were located further away from the injection-production area. Within each group, the trends in temperature changes were largely uniform (Fig. 8 ). Due to the low permeability of the granite matrix, the effect of thermal convection on temperature changes was considered negligible. Heat conduction through the rock was found to be the main reason for the temperature decrease in the well. With continuous injection of the low-temperature fluid, the heat exchange process gradually reduced the temperature of the rocks surrounding the injection-production area. After 0.6 h of fluid injection, the influence of the injection-production process extended to wells No. 2, No. 6 and No. 9, and the temperature began to decrease with minor fluctuations (except for well No. 6). For well No. 6, when the flow channel between wells No. 5 and No. 6 was activated, the fluid flowed towards well No. 6. As the temperature in well No. 5 was higher, the temperature in well No. 6 increased from 53.7 °C to 57.5 °C. Subsequently, as the temperature in well No. 5 decreased rapidly, the temperature in well No. 6 also quickly decreased. After a series of fluctuations, the temperature curve of well No. 6 closely followed that of wells No. 2 and No. 9 (Fig. 8a ). After 8 h of injection and production, the temperature in the monitoring wells close to the injection-production area showed an average decrease of 12 °C.
Fig. 8. Curves of temperature changes over time within monitoring wells during the injection-production process. |
As wells No. 1, No. 7, and No. 8 were located at a considerable distance from the injection-production area, the influence of the heat exchange process on the temperatures within these wells was negligible in the initial phase. After the injection of 4.5 h, the temperatures within these wells began to gradually decrease, and the decrease rate was uniformly consistent (Fig. 8b ). After 8 h of injection and production, the average temperature decrease in the monitoring wells far from the injection-production area was 3.5 °C.
5. Discussion
5.1. Influence of dynamic change of natural fracture conductivity on production temperature
Natural fractures are the main channels for the heat extraction in HDRs, and the dynamic change in conductivity is essential for the long-term injection-production performance of HDRs. Continuous injection of low-temperature fluid induces thermal shock, which creates tensile stress on the fracture surfaces. Meanwhile, the increase in fluid pressure reduces the normal force acting on the surfaces. This study identified two primary mechanisms for the increase in conductivity of natural fractures through the analysis of the curves of the production flow rate and temperature: (1) local closed fractures were activated and new heat exchange areas were created; and (2) the original natural fractures widened and no new heat exchange areas were created. For the natural fractures between wells No. 4 and No. 5, the production temperature of well No. 5 maintained a downward trend despite the increasing production rate. This suggests that almost no new heat exchange areas were formed on the fracture surface and that the increase in fracture width was the main reason for the enhanced conductivity. The improved heat exchange efficiency within the flow channels between wells No. 4 and No. 5 resulted in a continuous decrease in the production temperature. For the natural fractures between wells No. 3 and No. 4, there was a fluctuation in the production temperature curves as the production flow rate of well No. 3 gradually increased. The results indicate that the partially closed natural fracture area was activated, resulting in new heat exchange areas that caused an increase or a slow decrease in the production temperature. In the previous numerical study of the heat extraction from HDRs, it was generally assumed that heat exchange occurred
over the entire surface of the existing fractures, focusing only on changes in fracture width and overlooking the activation of partial fracture surfaces. The production temperature curve obtained under this condition showed a smooth downward trend. The thermal breakthrough time was then defined as the time from operation until the production temperature dropped to a certain value [36]. However, the results of this experimental study show that there is a closed area existing in the local natural fractures. During the injection-production process, the closed area was gradually activated, resulting in a fluctuating change in the production temperature, which makes it difficult to directly define the thermal breakthrough time using traditional methods. Therefore, under the influence of thermal shock and fluid pressure, the change mechanism of natural fracture conductivity will affect the variation law of the production temperature.
5.2. Influence of dominant channel and fluid leakoff on heat extraction performance
The rock sample for this experiment consists three flow channels (wells No. 5-No. 4, wells No. 3-No. 4, and wells No. 5-No. 6), with different conductivities. Based on the production flow rate curves during the stage of one injection well with two production wells (Fig. 5a ), the production flow rate of well No. 3 was minimal, averaging 0.9 mL/min, which was only 1/9 of the average rate of well No. 5. The low flow rate resulted in a lower heat recovery rate and fluid recovery for well No. 3. Thus, during the injection-production experiment, there was a dominant channel within the rock sample, the flow channel between wells No. 4 and No. 5, with a large flow rate and high heat exchange efficiency. The production temperature of well No. 5 decreased rapidly (Fig. 5b ), resulting in a rapid decline in the overall heat recovery rate throughout the injection-production process. Therefore, a significant difference in the fracture conductivity can create the dominant channel. Then, the heat exchange area is limited and high-temperature fluid cannot be obtained for a long time.
Following the closure of well No. 5, the mode was changed from one injection well with two production wells to one injection well with one production well. The heat extraction performance of well No. 3, including production temperature, flow rate and heat recovery rate, was improved. However, due to the combined effects of thermal shock and fluid pressure, the conductivity of the flow channel between wells No. 5 and No. 6 increased, causing more fluid to flow into well No. 6 and the adjacent fractures. With the increase of the fluid leakoff, there was a gradual decline in the heat extraction performance of well No. 3, particularly for the production flow rate. Consequently, the leakoff of the heat exchange fluid emerged as a critical factor influencing the long-term efficient development of HDRs.
6. Conclusions
The results of the large-scale injection-production physical simulation experiments on HDR showed that during the stage of one injection well and two production wells, the combined effects of thermal shock and injection pressure enhanced the fracture conductivity. Then, the production temperature showed a downward trend, and the greater production flow rate resulted in a more rapid decrease. As the partially closed fracture was gradually activated, resulting in new heat exchange area, the rate of either the production temperature curve rising or falling became slower. During the stage of one injection well and one production well, the production flow rate increased, a larger fracture closure area was activated, and the production temperature increased again, and then remained stable. Due to the increase in the fluid leakoff, the production flow rate gradually decreased, and the production temperature showed a slow decreasing trend.
The heat recovery rate is strongly influenced by both the production flow rate and the temperature difference between the injection and production fluids. For well No. 5 with high conductivity, the heat recovery rate was controlled by the production flow rate in the early stage, and was mainly affected by the production temperature in the later stage. For well No. 3 with low conductivity, the heat recovery rate was primarily controlled by the production flow rate. As the fluid recovery of well No. 5 was significantly higher than that of well No. 3, the former determined the characteristics of the overall recovery curve. As the conductivity of the leakoff channel increased, the fluid recovery quickly decreased. In addition, the closer to the injection-production area, the greater the effect on the temperature inside the monitoring wells. When the flow channel between the monitoring well and the production well was activated, a small amount of high-temperature fluid flowed into the monitoring well, causing a temperature fluctuation.
During the long-term injection-production process in HDRs, the production temperature variation law was affected by the change in the natural fracture conductivity. The influence mechanisms of the dominant channel and the fluid leakoff on the thermal recovery performance are different. The dominant channel limits the heat exchange area, while the fluid leakoff affects the production flow rate. Both are important factors affecting the long-term and efficient development of HDRs.
Nomenclature
c—fluid specific heat capacity, J/(kg•K);
C—fluid recovery, %;
q—production flow rate, m3/s;
Q—injection flow rate, m3/s;
ΔT—temperature difference between injection and production fluids, K;
η—heat recovery rate, J/s;
ρ—fluid density, kg/m3.