

Introduction
Traditional super oil and gas basins lay an energy foundation for the survival and development of human society; however, the excessive emissions of greenhouse gases dominated by CO2 leads to global warming and causes a series of climate events [1⇓⇓⇓-5], posing a threat to the survival and development of mankind. In recent years, the global average temperature has been significantly higher than the pre-industrial period [6], and the annual average surface temperature rise of China is significantly higher than the global level [7⇓-9]. With the goal of the “Global Initiative to Limit Global Temperature Rise to 1.5 °C by the End of the Century” [10], energy production in the super basins has to develop towards low and zero carbonization, and towards the integrated development of oil, gas and new energy [11-12]. It is the transitional direction of super oil and gas basins to build a “super energy system” that balances energy production and carbon neutrality [13].
The world is currently in an overlapping period of four transitions: the transition from the 5th to the 6th scientific and technological revolution, the transition from the 3rd to the 4th industrial revolution, the transition from the fossil energy to new energy, and the transition from the large country to the large and strong country. The overlapping ushers in the critical period of transformation. The energy structure of China is in an era of “three periods” overlapping, i.e., the “hanging-out” of the “past” coal age (coal consumption still accounting for 56% in 2022 [11]), the “being present” of the “present” fossil energy age (fossil energy consumption accounting for 83% in 2022 [11]), and the “having-been” of the “future” new energy age (new energy consumption accounting for 17% in 2022 [11]). The “three periods” overlapping brings about the co-existence of opportunities and challenges. In the past, whoever controlled oil and gas resources would lock the “lifeblood” of energy security; in the future, whoever controls new energy technology would control the “lifeblood” of energy security.
The development environment of global energy has undergone profound changes manifesting mainly on the “overlapping of four periods”, namely the turbulent change period of international configuration, the frequent occurrence period of extreme climate disasters, the low-carbon transition period of the energy industry and the outbreak of a new round of scientific and technological revolution. Energy transition is equally important as energy security, with the former being long-term, tortuous and arduous, while the latter being scientific, flexible and reserve-oriented. Based on the fossil energy “'impossible triangle” contradiction among energy security, frugality and cleanliness, the article proposes the “four-wheel drive” of energy transformation revolution: the front-wheel traction by technological innovation and dual carbon goals, and the back-wheel drive by energy economy and energy security. Energy transformation accelerates the “four modernizations” named respectively by the “cleaning” of fossil energy, the “scaling” of new energy, and “collaboration” of centralizing and decentralizing, and “intellectualization” of the multi-energy management. Energy security highlights energy innovation focusing on the “Four Major Science and Technology Innovation Projects”, namely “coal cleaning project, oil stabilizing and gas increasing project, new energy accelerating project, green and smart project”, and energy revolution adhering to the “Six Properties Principles”, namely the “independence” of energy production, the “greenness” of energy supply, the “security” of energy reserves, the “efficiency” of energy consumption, the “intellectuality” of energy management, and the “frugality” of energy costs. It is the central task to accelerate the planning and construction of a new energy system featured by “green + intelligent energy system”, achieve a conversion from high-carbon-based energy to low-carbon-based energy and zero-carbon-based energy, and build a new energy system based on the “four news”—new energy, new electricity, new energy storage, and new intelligence providing green energy for the green life of human being and building a green earth.
China proposed the “carbon peaking and carbon neutrality” goals in 2020, asking for accelerating the ecological civilization, safeguarding energy security and efficiency, promoting economic transformation and upgrading, and playing leading role in responding to climate change. At present, the energy consumption in China has generally entered a stage of growing at medium to low speed [11], the average annual growth rate dropping from 12.2% during 2000-2005 to 2.8% during 2015-2020, and entering the peak plateau expectedly around 2035 with approximately 43.3×10⁸ t of standard oil (61.8×10⁸ t of standard coal). Later it will be generally stable, the consumption structure shifting from “the uni-dominance of coal” to “diversified coexistence and multiple energy complementation”, and the proportion of renewable energy growing steadily.
Facing the dual pressures of supply guarantee and low-carbon transformation, the oil and gas enterprises in China should adhere to the energy transformation policy abstracted by “building first and then destroying”. For a long time preceding “carbon neutrality”, the energy transformation of China has to adhere to the principle of “integrated development among oil, gas and new energy” [14-15]. Traditional oil and gas basins are being upgraded to new carbon neutrality “super energy basin” to simultaneously meet the requirements of large-scale energy supply and low-carbon emissions reduction. It will have strong demonstration effects on the implementation of “integrated development among oil, gas and new energy” to select traditional oil and gas basins in China that is equipped with the quality of building world-class energy production and carbon neutrality demonstration bases, and take the lead in building new carbon neutrality “super energy basin”, and will be of great strategic significance to national and local energy transformation and the transformation and development of related energy enterprises.
From the perspective of scientific integration of energy production system and carbon neutrality system, the article proposes the concept of “super energy system” and carbon neutrality “super energy system”, analyzes the characteristics of traditional super oil and gas basins and new super energy basins, and reveals the direction and trend of green collaborative development of super energy basins in future. Through analyzing the resources advantages of coal, oil, natural gas, wind energy, solar energy, geothermal energy, and associated resources in the Ordos Basin, the article makes the research concerning the current status and potentiality of CO2 capture, utilization and storage (CCUS) and CO2 capture and storage (CCS) in the Basin, and explores the construction path and development model of the carbon neutrality “super energy system” in order to provide scientific guidance and technical support for the realization of energy production in oil and gas basins and carbon neutrality.
1. Connotation of carbon neutrality “super energy system”
Energy is featured by three properties, i.e., the limitedness and high-carbon of coal resources, the shortage and scarcity of oil and gas resources, and the unlimitedness and greenness of new energy. Covering primary energy, secondary energy and tertiary energy (Fig. 1 ), “super energy system” is a system composed of multiple energy including underground energy and above-ground energy in primary energy, process energy and energy-containing energy in secondary energy, and digital world energy and ultimate energy in tertiary energy. And it also covers many energy industries which have been formed and will be formed in the process of human progress and energy development such as the coal industry, petroleum industry, natural gas industry, and geothermal industry for underground energy in primary energy, the new energy industry for above-ground energy in primary energy, the coal power industry, green power industry, and green hydrogen industry for secondary energy, as well as the digital world industry and the artificial solar energy industry for tertiary energy. Carbon neutrality system refers to treat the CO2 emissions of an organization, group or individual over a period of time through forest carbon sinks, artificial conversion, geological storage and other technologies to realize “net zero emissions” of greenhouse gases dominated by CO2 and CH4 [6,16].
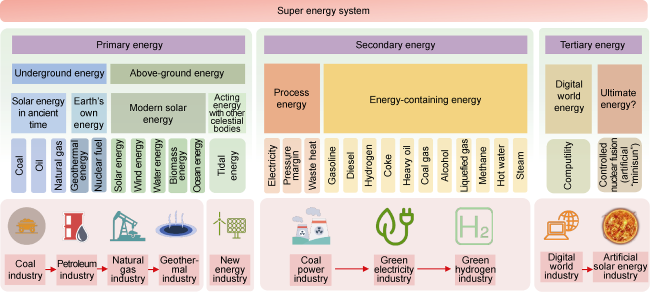
Fig. 1. Frame diagram of the super energy system and energy industry transformation. |
The formation and evolution of energy are inseparable from the innovation activities of human being. Since the formation of the earth, energy utilization has gone through solar energy and thermal energy in the primitive age, thermal energy and mechanical energy in the industrial revolution age, microwave energy and electrical energy in the scientific revolution age, and the controlled nuclear fusion (artificial “mini-sun”) in the future ultimate energy age, realizing that energy comes from the sun and goes back to the “sun” [15] (Fig. 2 ). The “super energy system” in which energy production and utilization develop from carbon-based primary energy to clean zero-carbon tertiary energy has been different in approach but equally satisfactory in result with “carbon neutrality” development in terms of “energy return” form.
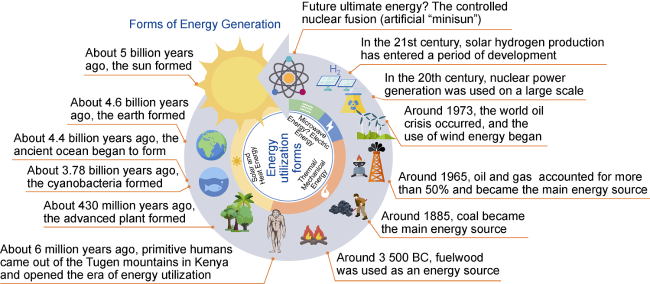
Fig. 2. Evolution of energy generation forms and energy utilization forms [15]. |
Based on the understanding of “super energy system” and carbon neutrality system, a regional intelligent energy system integrating and coordinating the development and utilization of underground coal, oil, natural gas, geotherm and various associated energy, and above-ground wind energy, solar energy, water energy, electricity, hydrogen and other energy sources was analyzed with a certain super basin as a unit, and carbon neutrality “super energy system” was proposed by taking the carbon cycle as the main line and the green, collaborative and sustainable development between the utilization of fossil energy and new energy and CCUS/CCS as the goal.
Carbon neutrality “super energy system” refers to a regional intelligent energy system featured by the high-degree coupling of underground coal, oil, natural gas, geotherm and associated minerals with above- ground wind energy and solar energy which reach a defined resources scale, as well as the integrated and collaborative development and utilization of fossil energy and new energy. In a regional system, the “net zero emission” of energy production and utilization and CO2 utilization and storage is reached with the carbon cycle as the main line, and a dynamic balance among energy supply security, carbon emissions and carbon absorption is realized.
2. Connotation of carbon neutrality “super energy basin”
2.1. Traditional super oil and gas basins
Traditional super oil and gas basin is generally defined to be a basin with multiple sets of overlapping oil and gas layers as well as relatively complete infrastructure, whose original recoverable oil and gas reserves exceeds 13.6×10⁸ t (100×108 bbl) oil equivalent, and remaining recoverable reserves exceeds 6.8×10⁸ t (50×108 bbl) oil equivalent. Currently, there are 44 super oil and gas basins in the world, whose oil and natural gas production accounts for more than 90% of total production of the world. Among them, there are 10 super oil and gas basins [17-18] with the scale of oil and gas reserves amounting to over 136×108 t (1 000×108 bbl) of oil equivalent, accounting for approximately 3/4 of the world’s total oil and gas reserves.
The reserves and production of oil and gas of China mainly come from large basins located in Songliao, Sichuan, and Ordos. Among them, the three basins in Songliao, Bohai Bay and Ordos account for 77% of the national proved oil reserves and 70% of the crude oil production; the four basins in Ordos, Sichuan, Tarim and Songliao for 93% of the national proved natural gas reserves, and the three basins in Ordos, Tarim and Sichuan for 81% of the national total natural gas production.
2.2. New carbon neutrality “super energy basin”
The future super energy basin will have abundant oil and gas resources, access to low-cost new energy, and is capable of large-scale carbon capture and storage (CCS) [19-20]. Based on availability and CCS potentiality of the clean energy, Wood Mackenzie Consulting Co. [18] divides super basin into top super basin with strong renewables and CCS potentiality, possible super basin with good renewables or CCS potentiality, and disadvantaged super basin lacking strong renewables and CCS potentiality. The Ordos Basin in China is one of the top super energy basins.
The new carbon neutrality “super energy basin” should be equipped with the following characteristics: large reserves and strong production capacity of fossil energy, low cost of large-scale production and utilization of new energy, reservoirs of gas storage and energy storage with large scale and amount, strong capacity for large-scale carbon capture and underground storage, and relatively complete infrastructure and pipeline network system. Based on the above, the carbon neutrality “super energy basin” is defined as the basin with multiple sets of vertically overlapped oil and gas reservoirs and saline layers with the scale of OOIP exceeding 100×108 t, the remaining geological reserves exceeding 50×108 t, the scale of OGIP exceeding 10×1012 m3, the remaining geological reserves exceeding 5×10¹² m3, the annual oil equivalent exceeding 5 000×104 t, the amount of original coal resources exceeding 1×10¹² t, the annual coal production capacity exceeding 10×108 t, the total annual solar irradiance exceeding 4 000 MJ/m2, the annual effective utilization time exceeding 1 200 h, the wind power density exceeding 150 W/m2, the annual effective utilization time exceeding 2 000 h, good match of CCUS/CCS sources and sinks, the CO2 storage potentiality exceeding 100×108 t, the amount of geothermal resources equivalent to standard coal exceeding 100×108 t, well-developed pipeline network system, the daily gas supply exceeding 1×10⁸ m3, taking-shape reserve system and the effective storage capacity exceeding 100×108 m3.
3. Favorable conditions for building a carbon neutrality “super energy system” in the Ordos Basin
Possessing abundant fossil energy and new energy resources, obvious location advantages and significant advantages in matching CO2 sources and sinks, the Ordos Basin currently has been equipped with basic conditions to build a world-class multiple energy production and carbon neutrality demonstration base.
3.1. Obvious location advantages
Spanning five provinces of Shaanxi, Gansu, Ningxia, Inner Mongolia, and Shanxi and covering an area of 37×104 km2 [21], the Ordos Basin, bounded by the Qinling Mountains, Lüliang Mountains, and Yinshan Mountains, is located in the inland hinterland and the main road of Overland Silk Road Economic Belt in China, lying in the “Ji” Bay of the Yellow River [22] with geological shape like Chinese character “Ji”, and thus is the main position for implementing the national comprehensive plan of the Yellow River Basin. “The 14th Five-Year Plan” clearly focuses on the development of nine clean energy bases and four offshore wind power bases, including clean energy base at the “Ji” Bay of the Yellow River [23]. There are dense energy channels in the basin where 15 main energy lines such as the West-East gas pipeline and the Shaanxi-Beijing pipeline intersect, so the Ordos Basin is well qualified to build the onshore natural gas pipeline network center and the energy cooperation hub of the “Belt and Road” in China. With the support of various advantages in terms of resources, location and policy, the Ordos Basin is expected to be the first to build the carbon neutrality “super energy system” demonstration basin in China.
3.2. Strong resources basis
The Ordos Basin ranks forefront in fossil resources and has good new energy resources, which is the largest energy production base in China. Large energy production enterprises gather and are all engaged in energy production in the Basin including China National Petroleum Corporation (CNPC), Sinopec Group (SINOPEC), China National Offshore Oil Corporation (CNOOC) and Shaanxi Yanchang Petroleum (Group) Corp. Ltd., which are commonly known as “Three and A Half Barrels of Petroleum”, China Energy Investment Corporation Ltd. (CHN ENERGY), China National Coal Group Corporation (CHINA COAL), Jinneng Holding Group Co. Ltd. (Jinneng Holding Group), Shaanxi Coal and Chemical Industry Group Co., Ltd. and Shanxi Coking Coal Energy Group Co., Ltd., which are commonly known as “Five Big Coals” with annual production of over 1×10⁸ t.
The basin has been rich in mineral resources such as coal, oil and natural gas. The amount of coal resources shallower than 2 000 m is about 2×10¹² t, accounting for 35.5% of the national total reserves. The cumulative proved geological reserves of oil and natural gas in the Ordos Basin by the end of 2022 are 81.6×10⁸ t and 6.86×10¹² m3 [21], accounting for 19% and 32% of national total reserves, respectively.
CCUS/CCS sources and sinks in the basin are well matched, and it is highly consistent between the high-concentration carbon sources and the utilization of geological sequestration carbon sinks. The coal chemical industry in the basin is concentrated, and the high-concentration carbon sources are large and of high quality. The current capture capacity is about 1×10⁸ t/a, possessing the potentiality to build a large-scale CCUS/CCS industry [24]. The effective CO2 storage potentiality of low-permeability and tight oil layers, deep unminable coal beds, deep saline layers, and depleted oil and gas reservoirs in the Basin reach more than 150×108 t [6].
Defined as a medium-low temperature basin, geothermal resources are relatively abundant in the Basin. The terrestrial heat flow value is generally 56-70 mW/m2, and the geothermal gradient in most areas is 2.5-3.0 °C/100 m [25⇓⇓-28]. Some scholars represented by Liu [25] believe that the stratified hydrothermal geothermal resources in the Basin are equivalent to 249.4×10⁸ t of standard coal. Some scholars represented by Wang [26] believe that the number of geothermal resources in the basin is equivalent to 503.0×10⁸ t of standard coal. Some scholars represented by Lin [27] believe that the geothermal energy stored in some layers of the basin is equivalent to 870.8×10⁸ t of standard coal.
Uranium ore, helium and other associated resources are also relatively abundant in the basin, which provide the natural resources conditions for implementing multi-energy collaborative development. The sandstone-type uranium reservoirs are located mainly in the Jurassic Zhiluo Formation and the Cretaceous Huanhe Formation, having favorable conditions such as small burial depth, interbedded sandstone and mudstone, and active groundwater. The total amount of uranium resources is predicted to reach more than 50×104 t [29] with good exploration prospects. The content of helium discovered in Qingyang, Sulige, Yichuan, Zizhou-Mizhi, Yulin and other gas fields [30], ranges from 0.03% to 0.14%. High helium content areas are mainly distributed along the western and the southern margins of the Basin [31].
3.3. National encouraging the integrated development of exploration and development of petroleum and new energy
The National Energy Administration requires strengthening the integrated development of exploration and development of petroleum and new energy, vigorously promoting the development of new energy and low- and negative-carbon industries, integrating the upstream oil and gas fields with new energy and new industries, creating a new development pattern of multi-energy complementation, and continuing to promote the transformation and upgrade of energy production and supply structure, and thoroughly implementing decisions and arrangements concerning “intensifying the exploration and development of oil and gas resources and increasing reserves and production” and “promoting clean, low-carbon and efficient utilization of energy”. The National Development and Reform Commission and the National Energy Administration advocate actively oil and gas enterprises in exploring and promoting the construction of integrated wind, solar, gas and hydrogen storage demonstration projects, and encourage them to give full play to the advantages of rich energy resources and good developing and utilizing conditions in oil and gas fields to develop nearby and consume locally new energy.
3.4. “Four advantages” of CNPC in developing new energy
Having mineral right area of nearly 100×104 km2, CNPC is well qualified to possess four major advantages to develop new energy: highly overlapping of rich wind, solar and geothermal resources with oil and gas areas, natural gas resources supporting peak-shaving gas and electricity, the upstream and downstream industrial chain business having a huge market consuming clean energy, and the oil and gas fields converting into “electric field + geothermal field + hydrogen field + carbon field + energy storage field”.
The oil and gas fields of CNPC mostly possess rich wind, solar and geothermal resources with the effective utilization time of photovoltaic of more than 1 400 h, the maximum wind power density of more than 300 W/m2 [11], the amount of hydrothermal geothermal resources equivalent to 1.1×10¹² t standard coal, and minable standard coal annually amounting to 16×108 t [32]. Natural gas resources can support a certain scale of peak-shaving gas and electricity evidenced by the fact that the natural gas production of CNPC reached 1 455×108 m3 in 2022, and peak-shaving gas and electricity can support 1×10⁸ kW large-scale wind power and photovoltaic bases. CNPC’s energy consumption is large, and the market consumption of upstream and downstream industrial chain business is huge. In 2022, terminal energy consumption was dominated by electricity and heat, and the electrification rate of the upstream and downstream industrial chain business was increased. It is expected that the electricity consumption will reach about 1 000×108 kW·h by 2025. The great number of oil and gas fields of CNPC can be converted into “power fields, geothermal fields, hydrogen fields, carbon fields, and energy storage fields”, laying a crucial guaranteeing foundation for green and low-carbon transformation and development.
3.5. CNPC qualified with foundation and demands to lead the construction of carbon neutrality “super energy basin”
A sum of 165 mineral rights have been registered in the Ordos Basin, covering an area of 22.1×10⁴ km2. Among them, CNPC has 100 registered mineral rights, covering an area of 17.0×10⁴ km2, and owns more than 3/4 of the mineral rights in the Basin. CNPC, which is vigorously promoting the coordinated development of petroleum and new energy, has underground exploration and development data and technological advantages laying the foundation to develop a leading enterprise in the CCUS/CCS industry.
CNPC has the need to lead the construction of carbon neutrality “super energy basin”. With the improvement of exploration level and increasing inferiority of the quality of oil and gas resources [21,33], the geological objects have turned to tight, deep and the peripheral areas of the basin with complex reservoir-forming conditions. The oil and gas reservoirs are characterized more by “low, deep, difficult, small, and scattered”, meanwhile the layers are moving downward, the grade lower, and the risk greater [33], resulting in more difficulty in efficient exploration and benefit development, and less prominent target of large-scale increasing reserve. The development of new energy faces challenges including difficulties in obtaining indicators, lack of cheap CCUS/CCS carbon sources, and poor cross-provincial deployment of carbon sources. Based on policy support and supporting technology, CNPC can promote high-quality business development through constructing large bases.
4. Strategic conception of building carbon neutrality “super energy basin” in the Ordos Basin
Traditional oil and gas basins are the main body of global oil and gas supply. Under the general trend of carbon neutrality and green development, traditional oil and gas basins are also the main battlefield for energy transformation and development. Therefore, they have to be upgraded and transformed into new carbon neutrality “super energy basins” with rich oil and gas resources, low-cost new energy sources, and large- scale carbon capture and storage capabilities. The construction of carbon neutrality regions is being implemented or planned in some areas or by some organizations such as the US Gulf of Mexico and the North Sea Oil Field in Europe. Walking along the road of energy carbon neutrality well and taking the lead in building the Ordos Basin into a carbon neutrality “super energy basin” is of great strategic significance and strong demonstration effect for the nation, local governments and related energy enterprises.
4.1. Demonstration significance of carbon neutrality “super energy basin”
4.1.1. Further enhancing the capacity of fossil energy production to ensure supply
In the Ordos Basin, a national coal chemical industry demonstration project has been built up, which is indispensable in coal production to ensure national energy security. In 2022, the total output of raw coal in the Ordos Basin was 15.6×10⁸ t, about 34.2% of the national total, of which the output of the National Energy Group from the Ordos Basin exceeded 3×10⁸ t (total output 6×10⁸ t [34]), and the output of the Shaanxi Coal and Chemical Industry Group Co., Ltd. exceeded 1.57×10⁸ t [35]. In the coal chemical industry, the National Energy Group has 33 coal chemical projects and 4 national demonstration projects, with production capacity ranking the first in the world. China Coal has built the coal chemical projects like 60×104 t/a coal to olefin in Yulin, and annual output of 100×104 t synthetic ammonia and 175×104 t urea in Tuke. By the end of 2023, the total production capacity is more than 1 000×104 t [36].
In the domestic traditional energy basins, China’s oil and gas production mainly rely on Ordos, Songliao, Sichuan and other large basins. In 2022, the Ordos Basin produced 3 763×104 t of crude oil, and 694×108 m3 of natural gas, i.e., 9 290×104 t of oil equivalent (Fig. 3 ), accounting for 18% and 32% of China’s crude oil production (2.05×10⁸ t) and natural gas production (2 178×108 m3) in 2022 respectively. According to the proved technically recoverable oil and gas reserves in the major basins in the past 40 years and the resources potentiality analysis of the major basins, it is preliminarily predicted that the annual proved technically recoverable oil and gas reserves of the Ordos Basin will account for 27%-39% and 22%-42% that of the major oil and gas producing basins before 2050 with the average of about 31% and 26% respectively (Fig. 4 ), which is in an important position in the domestic oil and gas supply. It is conducive to improve the net contribution rate of oil and gas and the comprehensive energy supply capacity and ensure the national energy security by further enhancing the oil and gas production capacity of the Ordos Basin.
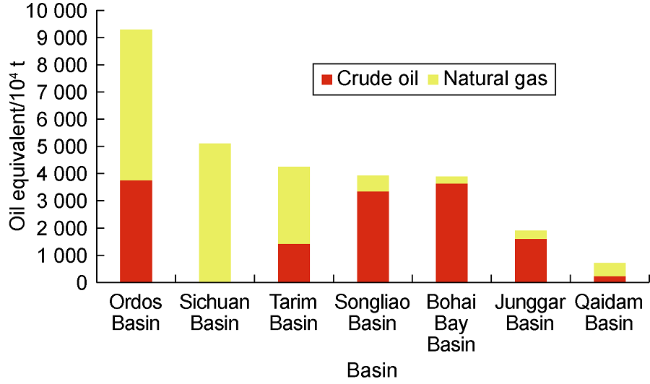
Fig. 3. Histogram of oil and gas production in major onshore basins in China, 2022. |
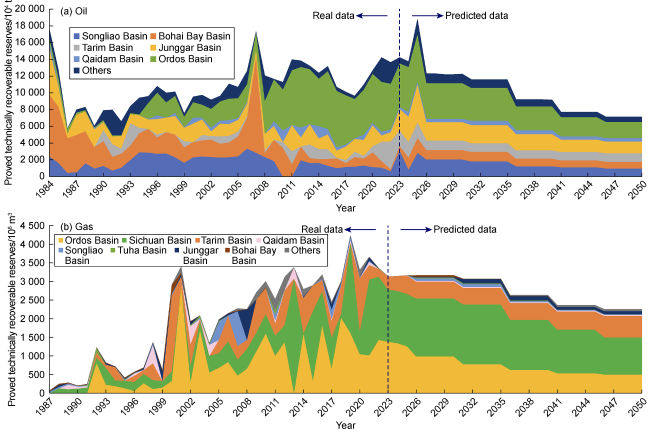
Fig. 4. Potential forecast of proved technically recoverable reserves. |
4.1.2. Boosting the achievement of the “dual carbon” goal by CCUS/CCS
In the sector carbon emissions of China, energy activities, industrial processes, and agriculture and other sectors account for 85.5%, 15.4% and -0.9% respectively. Among the energy activities from fossil energy combustion, the carbon emissions of power generation, steel, building materials, transportation and other industries account for 44%, 19%, 14%, 14% and 9%, respectively; in the industrial processes with carbon emission from CaCO3 decomposition, the carbon emissions of cement and lime, steel and chemical industry and other industries account for 53%, 31% and 16%, respectively [37]. In the carbon emissions structure of the primary energy production process in China, CO2 emissions from fossil energy account for 83.6% of the total emissions (Table 1 ) [37]. Low and zero carbon energy is an important link to achieve the goal of “dual carbon”.
Table 1. Carbon emissions structure of primary energy production in China [37] |
| Energy type | Percentage of total carbon emissions/% | Structure of carbon emissions | |
|---|---|---|---|
| Energy | Percentage/% | ||
| Fossil energy | 83.6 | Coal | 56.7 |
| oil | 18.9 | ||
| Natural gas | 8.0 | ||
| Non- fossil energy | 16.4 | Water power | 9.1 |
| Wind power | 3.1 | ||
| Nuclear power | 2.4 | ||
| Photovoltaic | 1.8 | ||
In a CCUS project, an additional 1 t of crude oil can be produced by injecting 2-3 t CO2 [6], which can realize the double benefits of carbon sequestration and enhanced oil recovery. By the end of 2022, China’s cumulative CO2 injection exceeded 760×104 t with a sequestration rate of 50%-80%. CNPC has injected 563×104 t of CO2 in total accounting for 74% of the national sum; Sinopec has injected 182×104 t of CO2.
If no carbon reduction measures are taken, the annual total carbon emissions in the Ordos Basin are predicted to be 10 069.47×10⁴ t according to the statistics and calculation by the method of greenhouse gas emissions [38] (Table 2 ). It is preliminarily estimated that the CO2 storage potentiality of low-permeability and tight oil layers, deep unworkable coal beds, deep saline layers, and depleted oil and gas reservoirs in the Ordos Basin exceeds 150×108 t. The high-concentration carbon sources are of large quantity and good quality, and the captured amount is about 1×10⁸ t/a at the present stage, which has the potential to build a large- scale CCUS/CCS industry, and is an important way to reduce carbon emissions from fossil energy production in the Basin. External agencies predict that by 2060, about 20×108 t of necessary CO2 emissions in China will need to be eliminated through forestry carbon sinks and underground sequestration, and CCUS/CCS will become the “backstop” technology to achieve carbon neutrality [39]. The development practice of CCUS/CCS industry in the Ordos Basin will help realize the “dual carbon” goal [24,40].
Table 2. Calculation of carbon emissions related to main energy production in the Ordos Basin |
| Item | Yield/104 t | Emission factor | Carbon emissions/104 t |
|---|---|---|---|
| Oil | 3 763 | 0.172 800 | 650.25 |
| Natural gas | 694 | 1.144 300 | 794.14 |
| Coal | 155 900 | 0.007 794 | 1 215.08 |
| Coal chemical | 6 917.00 | ||
| Petrochemical | 493.00 | ||
| Total | 10 069.47 |
Note: The emissions factor of coal only considers the CO2 emissions in the process of energy exploitation; coal chemical projects mainly include Ningdong, Yuheng and Yushen Industrial parks with data from the CCUS oilfield planning materials of Changqing Oilfield [38]; CNPC Petrochemical Company at Changqing, Qingyang and Ningxia emit a total of 493×104 t. |
4.1.3. Promoting the construction of the system of modern energy industry
It has been well designed to gradually build a clean and efficient energy supply system by promoting self-reliance in energy science and technology, breaking through technologies for clean energy development and utilization, enhancing the green development of fossil energy industry with new energy and carbon negative “self-use”, promoting the transformation and development of petroleum and coal production into comprehensive energy development and utilization and new material manufacturing bases with new energy and carbon negative “other use” and deep processing of fossil energy, forming a new development pattern featured by the integration and multi-energy complementation among traditional fossil energy, new energy and new industry, and continuing to optimize the energy supply structure.
The practice of multi-energy collaborative production and emissions reduction in the Ordos Basin can be taken as a demonstration providing reference for the transformation and upgrade of other traditional oil and gas basins.
4.1.4. Promoting regional green and sustainable development
The Ordos Basin is an energy enrichment area of the Yellow River Basin known as an “energy basin” of China, and its ecological environment is extremely fragile [41-42]. Due to the irrational exploitation and utilization of water and soil resources, the ecological environment tends to deteriorate, and it is one of the most serious areas of soil erosion and desertification in China.
Exploring the channel to establish a modern energy industry system will take energy development as a link to realize the joint construction of energy projects between enterprises and local governments and the sharing of development fruits, putting the coordinated development among provinces and regions as well as urban and rural areas in motion. The way of developing the energy industry in clustering way, vigorously developing green, low- and negative-carbon industry, and strengthening the concept of “protection in development” and “development in protection” is the key to realize the same frequency of ecological environmental protection and energy industry development, and to generate strong positive externalities, and achieve greater benefits of green economy through energy export, boosting the green and sustainable development of this region and other regions.
It is preliminarily predicted that by 2050, the annual output value of energy-related industries such as coal, petroleum, new energy and negative carbon in the Ordos Basin will reach trillions of yuan, driving investment and social employment and better serving the local economic development and the improvement of the livelihood of people.
4.2. Strategic construction idea and goal of the conception
In the Ordos Basin, focus on the core areas of clean coal development, efficient oil and gas development, effective development of associated resources, the construction of integrated large base of wind, solar, gas, heat and hydrogen storage, utilization of intelligent micro-grid and virtual power plant, intelligent energy regulation, and CCUS/CCS has contributed to multi- energy complementation and green development, promoting the comprehensive utilization of sources grid load storage, and continuously optimizing the energy production structure, and improving the capacity of supplying clean energy and providing comprehensive energy services to ensure national energy security. Based on the advantages of energy resources, location and policies, it will be inevitable to coordinate the overall planning of all provinces, regions and enterprises to promote step by step energy development, strengthen the coordination between energy development and social development, and do a good job in clean energy development, while it is reasonable to deploy innovation chain around the industrial chain and rely on innovation chain to improve the value chain in order to stimulate local economic development, and benefit the local people more.
It is the final goal to build the Ordos Basin into the largest energy supply base of China, the largest onshore oil and gas production base, the largest onshore CO2 sequestration base, a major clean power production base and other strategic highlands in about 10 years, and to build a pioneering demonstration zone for the development and utilization of clean and low-carbon energy resources in China, a national energy security zone, a new highland of the strategy for large-scale development of western China and a carbon neutrality demonstration zone to provide a strong guarantee for the energy transformation and development of China [43] by giving play to the advantages of regional location and energy resources, taking the construction of the carbon neutrality “super energy basin” as a guide, taking the “Five Major Projects”—10×108 t level project of clean coal production and utilization, 1×10⁸ t level project of green petroleum production, 1×10⁸ kW level project of wind power and photovoltaic development and utilization, 1×10⁸ t level project of CCUS/CCS industrialization demonstration, the construction project of strategic energy reserve and regulation hub—as a starting point, strengthening top- level design, scientific and technological support and policy support, making overall planning and accelerating progress.
According to the conception, when the Ordos carbon neutrality “super energy basin” is completed in 2050, the total energy supply will continue to be more than 10×108 t of standard coal per year (Table 3 ), accounting for 1/5 of the total energy consumption of the country achieving sustainable development of the Basin and ensuring national energy security. The total amount of CO2 sequestration will reach more than 1×10⁸ t (Table 3 ), accounting for nearly 1/5 of the total amount of CO2 sequestration in the country helping the realization of the dual-carbon goal.
Table 3. Preliminary prediction of construction target of carbon neutrality demonstration zone in the Ordos Super Basin |
| Years | Sum of energy production | CCUS/CCS | Storage and transportation system | |||||||
|---|---|---|---|---|---|---|---|---|---|---|
| Coal production/108 t | Oil production/ 104 t | Natural gas production/108 m3 | Installed capacity of new energy/104 kW | Power generation capacity of new energy/ (108 kW·h) | Total standard coal/ 108 t | CCUS injection/ 104 t | CCS injection/ 104 t | Sum/ 104 t | Effective working gas volume of gas storage/108 m3 | |
| 2021 | 14 | 3 709 | 633 | 11.7 | 320 | 320 | 30 | |||
| 2025 | 13 | 3 981 | 682 | 3 000 | 540 | 11.3 | 320 | 320 | 30 | |
| 2030 | 11 | 4 000 | 800 | 10 000 | 1 800 | 10.4 | 1 000 | 100 | 1 100 | 50 |
| 2035 | 9 | 3 500 | 1 000 | 30 000 | 5 400 | 10.2 | 3 000 | 2 000 | 5 000 | 80 |
| 2050 | 7 | 3 000 | 1 000 | 60 000 | 10 800 | 10.1 | 5 000 | 5 000 | 10 000 | 200 |
4.3. Strategic layout of the “Five Major Projects”
Focusing the key fields such as energy supply, CO2 utilization and sequestration, storage and transportation, and peak shaving, the “Five Major Projects” deployed at two levels in the near and long term will implement into specific and key projects to form a cluster effect in line with the positioning and planning of the energy industry of the local government in the region.
4.3.1. 10×108 t level project of clean coal production and utilization
The six coal areas in the north and west of the Basin, the north of Shaanxi, Huanglong, eastern margin and Weibei cover an area of 14.7×10⁴ km2 with coal resources shallower than 2 000 m accounting for 1/3 of the national total reserves, which makes it the largest coal production base in China. The coal output in 2022 is 15.59×10⁸ t accounting for 34.2% of the national total output (Fig. 5 ).
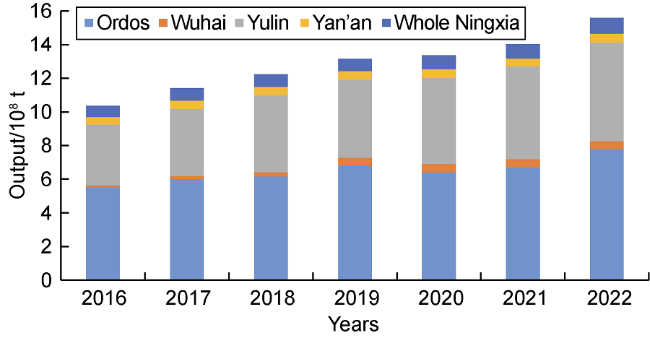
Fig. 5. Coal production of major cities in the Ordos Basin (according to the statistics bureau of each city). |
In the future construction, clean and efficient development will be highlighted and deployed in two stages. Before 2035, it will plan to step up the construction of green and intelligent mines, optimize and improve the quality of the construction of clean and efficient coal production bases above 10×108 t. At the same time, it also will plan to create a modern coal chemical industry demonstration zone by focusing on the development of large-scale advanced coal clean petroleum/special petroleum, coal differentiated high-end polyolefin, low-rank coal separation utilization and other projects. After 2035, in accordance with the principle of “reducing output without reducing capacity”, it will plan to maintain 10×108 t level coal production capacity, control and reduce actual production scale in an orderly manner by keeping the same pace with the national energy transformation development, and meantime to focus on building characteristic coal chemical industry.
4.3.2. 1×10⁸ t level project of green petroleum production
The amount of oil geological resources in the Ordos Basin is 201×108 t, accounting for 16.2% of the national total reserves. There are many types of natural gas and multiple gas layers, and the total geological resources are 33.6×10¹² m3 accounting for 15% of the national total reserves. The total technically recoverable oil and natural gas resources are about 32×108 t and 12.9×10¹² m3 respectively, accounting for 13.4% and 17.7% [11] of the total resources in China. Having produced over 3 500×104 t of crude oil (Fig. 6 ) and over 300×108 m3 of natural gas (Fig. 7 ) for 11 consecutive years since 2012, the Ordos Basin is the largest onshore oil and gas production base in China. The future construction highlights stabilizing oil and increasing gas and is deployed in two fields—traditional and new oil and gas.
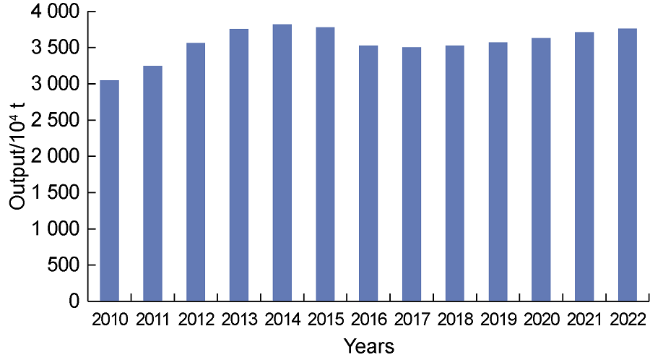
Fig. 6. Annual oil production in the Ordos Basin. |
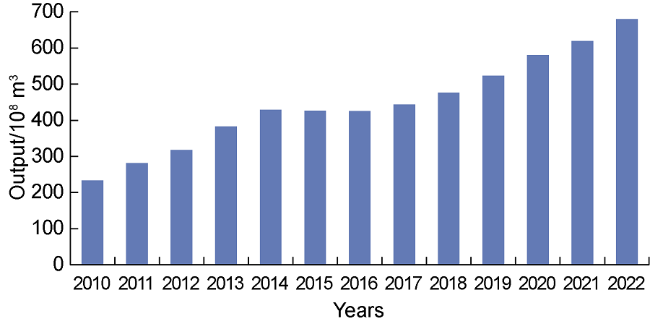
Fig. 7. Annual natural gas production in the Ordos Basin. |
In the traditional oil and gas field, focus should be put on both conventional and unconventional oil and gas, deepening the fine exploration of key layers, strengthening the risk exploration of new areas and new areas to strive to obtain large-scale and high- quality reserves. Efforts should be made to control the production decline and tap the potentiality of old oil and gas fields through fine description, fine injection and production and stimulation, and improve the recovery rate of low-permeability and tight oil and gas and shale oil and gas, so as to strive to build a 1×10⁸ t level oil and gas production base by 2030. During the period of “The 14th Five-Year Plan”, key projects such as Qingcheng 500×104 t shale oil productivity construction project, Sulige 300×108 m3 stable tight gas production project, and 25×108 m3 deep coal rock gas productivity construction project along the eastern margin of Hubei province will be implemented.
In the field of new oil and gas, the focus will be put on the technological breakthrough for the development and utilization of three kinds of strategic replacement resources including in-situ heating and transformation development of medium and low maturity shale oil, the development and utilization of oil-rich coal, and in-situ heating and underground gasification of medium and deep coal, and accelerating the construction of pilot test and demonstration zone, so as to strive to achieve the breakthrough in technology, production, environmental protection and efficiency in about 10 years, realize effective replacement of the output in traditional oil and gas fields, and further consolidate and upgrade the 1×10⁸ t level oil and gas production base. The focus also will be put on accelerating the promotion of in-situ heating of underground shale + coal seam, curing and converting into oil + gas to achieve the “two revolutions” of oil and gas. The continental shale oil revolution of China is a process of underground in-situ heating shale to transform organic matter, light heavy oil, and generate oil and gas. Based on the simulation experiment results of this technology, the global shale oil resources are estimated to be 1.4×10¹² t, and the technically recoverable resources of China are (700-900)×108 t, among which the technically recoverable resources of shale oil in the Ordos Basin by in-situ conversion technology are about (400-450)×108 t, and the technically recoverable resources of natural gas are about (30-35)×1012 m3 [44]. China’s coal seam revolution is to produce methane, hydrogen and other resources by in-situ combustion of coal in strata. The global coal gasification geological resources are (5-6)×1016 m3, while China’s are (272-332)×1012 m3 [45]. The technology is of strong integration, which can be used as the hub of the industrial chain of “oil, gas, heat, electricity and hydrogen”. What’s more, CNPC has been well-qualified with exploration, development, engineering, ground support and other technical advantages.
4.3.3. 1×10⁸ kW level project of wind power and photovoltaic development and utilization
At present, power enterprises are actively deploying new energy business in the Ordos Basin. According to incomplete statistics, the installed capacity of new energy projects under construction by China Huaneng Group Co., Ltd., China Three Gorges Group Corporation, National Energy Group and other enterprises is 3 700×104 kW.
Future construction adheres to the twining of centralized and distributed deployment. Combined with the planning and layout of the National Development and Reform Commission and the National Energy Administration, it will plan to accelerate the construction of 1 000×104 kW level large-scale wind power and photovoltaic base by making use of rich wind and solar resources in the Ordos Basin, and strive to add more than 1×10⁸ kW into wind power and photovoltaic installed capacity before 2030. And it also will plan to give full play to the advantages of the wide distribution of production facilities of oil and gas enterprises, and actively promote the construction of distributed wind power and photovoltaic bases according to local conditions, and the construction of the integration project of “wind, solar, gas and hydrogen storage with gas and hydrogen as the link, and meantime strengthen the construction of power infrastructure, increase the capacity of renewable energy consumption, and expand the scale of power transmission.
4.3.4. 1×10⁸ t level project of CCUS/CCS industrialization demonstration
At present, the annual high-concentration CO2 emissions of the constructed carbon sources and the ones under construction in the Ordos Basin exceed 1×10⁸ t, in which the internal carbon sources of Changqing Oilfield are 72.7×10⁴ t, the carbon sources of CNPC’s Oil Refinery are 493×104 t, and the external carbon sources are 9 457×104 t, and they are captured at the rate of 85×104 t/a The provincial CO2 emission rate of the constructed carbon sources and the ones under construction is 3 797×104 t/a in Shaanxi, 4 337× 104 t/a in Ningxia, 1 840×104 t/a in Gansu and 48.7×10⁴ t/a in Inner Mongolia, respectively.
The amount of CO2 that can be buried in the Ordos Basin exceeds 150×108 t. CCUS can be developed in 194 oil fields in Longdong area and Jiyuan area of Changqing Oilfield, covering 19.6×10⁸ t of oil geological reserves and 900×104 t of production. According to the calculation of enhanced oil recovery by 20%, the recoverable reserves can be increased by 3.92×10⁸ t, and the CO2 sequestration can reach 12.5×10⁸ t, which has great potentiality. The theoretical sequestration and effective sequestration of saline layers in 78 intervals of 28 oil fields in the Ordos Basin are 659.58×10⁸ t and 13.92×10⁸ t respectively.
Future construction adheres to the twining of utilization and storage in accordance with the “three-step” deployment. During the 14th Five-Year Plan period, a number of projects of CCUS industrial application demonstration at 100×104 t level will be built in Shaanxi, Gansu and Ningxia provinces with an annual CO2 injection capacity of more than 500×104 t by highlighting the demonstration effects at 100×104 t level, so as to drive the development of the CCUS industry in the Basin and the implementation of CCS breakthrough experiments. From 2026 to 2035, the large- scale application of CCUS/CCS will be accelerated with the annual CO2 injection capacity of CCUS exceeding 3 000×104 t and the annual CO2 injection capacity of CCS reaching about 2 000×104 t by highlighting the demonstration effects at 1 000×104 t level. From 2036 to 2050, a CCUS industrial application base with an annual CO2 injection capacity of about 5 000×104 t will be built and a CCS industrial application base of about 5 000×104 t will be built based on abandoned oil reservoirs by highlighting the demonstration effects at 1×10⁸ t level.
4.3.5. Construction project of strategic energy reserve and regulation hub
The Ordos Basin has a well-developed pipeline network system and has built the onshore natural gas pipeline network center of China and the energy cooperation hub of the “Belt and Road” where 15 main energy lines such as the West-East gas pipeline and the Shaanxi-Beijing pipeline intersect, and 44 scattered natural gas and LNG (liquefied natural gas) supply pipelines lie around. And the gas transmitting rate of the gas field’s external pipelines in summer and winter reaches 1×10⁸ m3/d.
The reserve system has begun to take shape exemplified by the establishment of 4 gas storage reservoirs in Changqing Oilfield including 2 in service, 1 formal storage under construction and 1 experimental storage under construction with an effective storage capacity of 175.3×10⁸ m3. In the future, the focus will be put on strengthening the capacity of strategic reserves, response to emergency and balance deployment.
The focus will be put on coordinating strategic reserves and emergency support, and building strategic reserves of coal and oil resources, constructing “10×108 t” level reserve of coal production capacity, optimizing the layout of coal storage base, intensifying the construction of reserve facilities and enhancing the coal reserve capacity of emergency dispatch by combining national strategic reserve and commercial reserve. It is suggested that some resources should be “explored but not mined, built but not produced” and reserved as strategic reserves for emergency considering the shallow oil reservoirs, the short drilling cycle, the high initial production of horizontal wells, and the quick formation of high productivity in a short period of time in the Ordos Basin in the process of building a strategic reserve of “10×108 t” level oil resources.
The focus will also be put on coordinating peak- valley reduction and emergency peak, and improving gas storage reservoirs, main oil and gas pipeline network, and UHV external transmission grids. Guided by the above goal, it will plan to construct “100×108 t” level gas storage cluster based on current 4 gas storage reservoirs in the Basin (including 2 under construction), strengthen the site selection and construction of new reservoirs in the eastern area of Sulige, Yulin and other places, and strive to exceed 100×108 m3 of working gas volume as soon as possible; to improve the backbone pipeline network for oil and gas transmission and distribution, improve the layout of oil and gas transmission and distribution on the basis of Shaanxi-Beijing and West-East gas pipelines, and improve channels of UHV external transmission grids from the base in desert, gobi and wildness to Beijing- Tianjin-Hebei, central and southern China; construct an energy deployment system, open up the physical isolation within the “electricity-hydrogen-gas” network and rebuild the balance deployment and emergency supply capacity across energy varieties based on producing hydrogen by electrolytic water and generating electricity by hydrogen-doped combustion engine.
4.4. Exploration and development concept and model of carbon neutrality “super energy basin”
Taking into account both energy production and carbon neutrality, carbon neutrality “super energy basin” has well-qualified with rich oil and gas resources, obtaining low-cost new energy, large-scale CO2 storage capacity, providing coal, oil, natural gas and other fossil energy as well as wind power, photovoltaic power, geotherm and other clean energy, and making full use of underground space to carry out CO2 utilization and storage.
“Super energy basin” has been equipped with a relatively complete oil and gas infrastructure, covering a variety of energy resources such as oil and gas, wind, solar and geothermal resources. Under suitable natural conditions, it is the effective solution for the de-carbonization of traditional super basins to produce clean and renewable energy nearby to supply energy for the production of oil and gas fields, increase clean energy supply, and achieve the green collaborative transformation and development.
The future development of the energy system can be summarized as “Two News and Three Actions”. The “two news” refer to the new energy system and the new oil and gas resources, with the former emphasizing “clean coal, stable oil, increasing gas, highlighting creation” and accelerating the “integrated development of fossil energy and new energy” and “transformation development of green low-carbon”; and the latter focusing on the artificial oil and gas reservoirs of medium and low maturity shale oil, oil-rich coal and coal gasification. The “three actions” refer to the action to stabilize oil and increase gas towards 2035, the action of oil and gas revolution of shale and coal seam and the action of natural gas to support new energy.
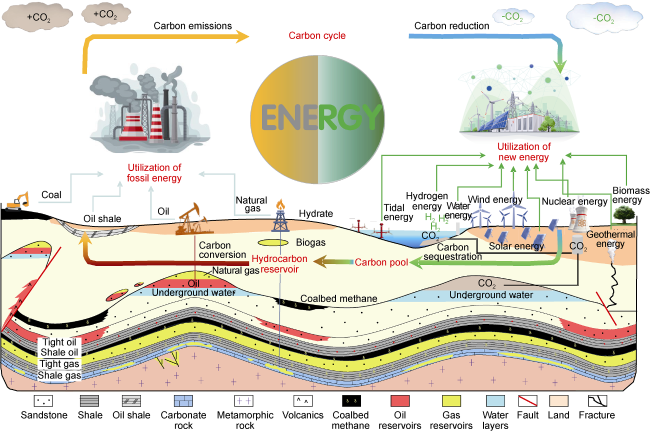
Based on this, the concept of carbon neutrality “super energy basin” is formed, which is a Chinese-style integrated development model of “coal + oil + gas + new energy +CCUS/CCS” with global significance. In the future blueprint, creating a world-class carbon neutrality “super energy basin” is a direction and model with representative implication, and it is emphasized that the new energy system is a green intelligent energy system dominated by the “Four News” technologies including “new energy, new power, new energy storage, and new intelligence”. And the concept and model of carbon neutrality “super energy basin” represented by the Ordos Basin (Fig. 8 ) will take the lead in building a world-class demonstration basin of carbon neutrality “super energy system”, and will reshape the future development concept and model of “super energy system” and carbon neutrality “super energy system”, which is of great significance to the global energy revolution within the trend of “carbon neutrality” by using the integrated development and utilization of underground coal, oil, natural gas, geothermal and various associated energy and above- ground wind energy and solar energy, reaching the “net zero emissions” of energy production and utilization, CO2 utilization and storage and achieving carbon neutrality generally in the Basin.
Fig. 8. Energy utilization in a carbon neutrality “super energy basin” [11]. |
The implementation of the five strategic projects is expected to assist energy-related businesses in the Ordos Basin in generally achieving carbon neutrality around 2050. In 2050, energy-related carbon emissions in the basin are estimated to reach (9 500-12 800)×104 t mainly from chemical industry, coal production, oil production and natural gas production accounting for about 44%, 32%, 13% and 6% respectively. Among them, the carbon emissions of energy production process are listed as follows: carbon emission in the production process is (3 000-3 800)×104 t [46] when coal output is 7×10⁸ t; carbon emission is (1 000-1 200)×104 t [47-48] when crude oil output is 3 000×104 t and natural gas output 1 000×108 m3; carbon emission is (400-600)×104 t when the main energy consumption of gas storage and CCUS/CCS injection is compressor power consumption; carbon emission is (100-200)×104 t in the process of new energy production. The carbon emissions of energy utilization process are listed as follows: the carbon emissions of coal power/coal chemical/petrochemical industry are expected to be (5 000-7 000)×104 t. It is expected that CCUS and CCS by 2050 will be implemented at amount of 5 000×104 t each, and the sum of carbon sequestration will be 10 000×104 t achieving carbon neutrality generally.
4.5. Problems and countermeasures
There are many problems in the preparation of the five major projects to build carbon neutrality “super energy basin” in the Ordos Basin including the uncertainties in the future development space and goals of tradition fossil energy; technical difficulties in multi-energy collaborative development; great difficulties of efficiency construction although needing to increase investment and less optimistic in the efficiency of new energy development; national policy gaps in the development of underground gasification of deep coal and the cross-provincial transportation and utilization of CO2; great difficulties of organizing and coordinating between provinces, industries and enterprises caused by the building of demonstration zone spanning Shaanxi, Gansu, Ningxia, Inner Mongolia and Shanxi provinces and involving coal, chemical, oil and gas and pipeline network, power, grid and other energy-related industries and many upstream and downstream enterprises.
At the government level, it is proposed to push forward to the national strategy to make the country shoulder the obligation of formulating and promoting the “overall planning and implementing scheme for the construction of carbon neutrality super energy basin in Ordos”; to encourage national ministries and commissions to take the lead in organizing and constructing institutes to jointly research and formulate construction plans; to strengthen the regional coordination among the five provinces and set up provincial and industry group leaders, and establish the coordination mechanism featured by “horizontal to the edge and vertical to the end”.
At the level of industry organizations, it is proposed to establish a “Golden Triangle Alliance of Energy” by selecting a leading institute with sufficient strength, and docking the development planning and industrial policies of local governments and parks; to set up the “Ordos Energy and Carbon Trading Center” to improve efficiency of energy production and carbon emissions reduction by relying on market-oriented means; to establish the Energy Golden Triangle Forum to strengthen the tracking and dynamic analysis of engineering progress; to institute the open “Ordos Technology Innovation Center of Carbon Neutrality Super Energy Basin” to provide technical support for the clean development of energy in the Basin, the large-scale development of new energy and the development of negative-carbon industry, and accelerate the major field tests and promotion and application of new technologies.
5. Conclusions
The “super energy system” refers to a regional intelligent energy system featured by the high-degree coupling of underground coal, oil, natural gas, geotherm, associated minerals with above-ground wind energy and solar energy which reach a defined resources scale, as well as the integrated and collaborative development and utilization of fossil energy and new energy. Carbon neutrality “super energy system” refers to the regional system with carbon cycle as the main line, featured by reaching “net zero emissions” of energy production and utilization, and CO2 utilization and storage, and achieving a dynamic balance between safe energy supply, carbon emissions and carbon absorption. Carbon neutrality “super energy system” can be applied to the study of dynamic system equilibrium in specific regions such as super oil and gas basins.
Spanning five provinces of Shaanxi, Gansu, Ningxia, Inner Mongolia and Shanxi, the Ordos Basin is located in the “Ji” Bay of the Yellow River, possessing obvious location advantages and abundant fossil energy like coal, oil, natural gas and various associated resources and new energy like wind energy, solar energy, and geothermal energy, high correspondence between the high-concentration carbon sources and the utilization of geological sequestration carbon sinks and significant advantages in matching CO2 sources and sinks. The Basin currently has been equipped with basic and favorable conditions to build a world-class demonstration base of energy production and carbon neutrality.
In view of the Ordos Basin possessing the advantages of rich oil and gas resources, low-cost new energy, and large-scale carbon capture and storage capabilities, the strategic conception of constructing the Ordos new carbon neutrality “super energy basin” is proposed to complete the Ordos carbon neutrality “super energy basin” and build a pioneering demonstration zone for the development and utilization of clean and low- carbon energy resources in China by taking the “Five Major Projects”—10×108 t level project of clean coal production and utilization, 1×10⁸ t level project of green petroleum production, 1×10⁸ kW level project of wind power and photovoltaic development and utilization, 1×10⁸ t level project of CCUS/CCS industrialization demonstration, and construction project of strategic energy reserve and regulation hub—as a starting point.
The new energy system, new oil and gas resources and the future new energy system named by three actions towards 2035 have been constructed. The new energy system emphasizes “clean coal, stable oil, increasing gas, highlighting new energy” and accelerates the “integrated development of fossil energy and new energy” and “transformation development of green low-carbon”; the new oil and gas resources focus on the artificial oil and gas reservoirs of medium and low maturity shale oil, oil-rich coal and coal gasification; the “three actions” refer to the action to stabilize oil and increase gas, the action of oil and gas revolution of shale and coal seam and the action of natural gas to support new energy.
Carbon neutrality “super energy system” that combines energy production with carbon neutrality comprehensively is the representative development direction in the future. And under the integrated development concept and model of “coal + oil + gas + new energy +CCUS/CCS” represented by the Ordos Basin, it will take the lead in building a world-class demonstration basin of carbon neutrality “super energy system” in China, and will reshape the future development concept and model of “super energy system” and carbon neutrality “super energy system”, which is of great significance to the global energy revolution within the trend of “carbon neutrality” by using the integrated development and utilization of underground coal, oil, natural gas, geotherm and various associated energy and above-ground wind energy and solar energy, reaching the “net zero emissions” of energy production and utilization, and CO2 utilization and storage and achieving carbon neutrality generally in the Basin.