

Introduction
It is widely acknowledged that conventional acoustic logging typically has a detection depth of 1 m to 2 m, which is insufficient for effectively evaluating hidden reservoirs beyond the well. The pursuit of technology with a greater detection range and higher imaging precision has been an unremitting quest in the field of well logging [1⇓⇓⇓⇓⇓-7]. Acoustic logging tools generate high-frequency acoustic signals (1 kHz to 20 kHz) within the well. The acoustic energy primarily propagates along the borehole wall, generating refracted P- and S-waves, as well as various types of guided waves (Stoneley waves, pseudo-Rayleigh waves, and flexural waves, etc.). However, by increasing the acoustic source radiation power, more energy can penetrate the borehole wall and enter the formation. When it encounters geological structures such as fractures, vugs, or reservoir boundaries that have different acoustic impedances from the surrounding formation, it will return to the well as reflected waves and be recorded by the receiving transducers. Using digital signal processing methods, these reflected waves are extracted from the records and imaged through migration to describe the position, orientation, and shape of the reflected bodies. This is the fundamental principle of acoustic reflection imaging logging (ARIL). Field measurements have demonstrated that the radial detection of ARIL can cover 3 m to 50 m with a resolution of about 1 m, which significantly expands the detection capability of well logging.
This article reviews the development history of ARIL technology, introduces ARIL data processing and interpretation methods, software, and field applications, and analyzes the challenges and future development of ARIL technology.
1. Development history and methodology
1.1. Development history
At the end of the 20th century, Chinese scholars began researching remote detection acoustic logging methods and instruments. In 2005, under the guidance of Professor CHU Zehan, the CHAI Xiyuan's team of PetroChina Dagang Oilfield Logging Company successfully developed the first downhole tool specifically designed for detecting reflectors outside the well [1⇓-3]. For the first time, clear reflected wave signals were obtained underground by increasing the source distance, increasing the transmission power, and array reception, which is an important milestone in the development of acoustic logging in China. In 2006, a team led by Li Ning in the PetroChina Research Institute of Petroleum Exploration and Development tackled the problem and first proposed the downhole reflection wave pre-stack reverse time migration imaging method [4]. In June 2009, Xiao Chengwen's team from the Well Logging Center of the Research Institute of Petroleum Exploration and Development, Tarim Oilfield, successfully discovered fracture-vug complex at a depth of 6 720 m, with a distance of 8-22 m from the wellbore of Well Lundong 2 using this method. The results were confirmed by the diversion curve after acid fracturing, and the well achieved high-yield industrial oil and gas flow during oil testing. Further large-scale applications have been carried out in more than 30 key wells such as Hade 24 and Xinken 6, which have basically solved the problem of detecting fractures, faults, and dissolution pores within a range of 30 m outside the wellbore [5⇓-7]. So after 2009, with the further promotion of the PetroChina logging research project, the application research of using remote detection acoustic identification to discover hidden reservoirs outside the well was quickly carried out both domestically and internationally.
1.2. Methodology
An ARIL tool is primarily composed of an acoustic emission system, an acoustic isolation system, an acoustic reception system, and an electronic system. The technology that utilizes monopole sources and monopole receivers is termed monopole reflected P-wave imaging logging technology, and represents the genesis of acoustic reflection imaging logging technology. However, the monopole source's radiating field is axially symmetric, resulting in the initial logging tool being incapable of discerning the orientation of fractures outside the well. To overcome this issue, two technical approaches have been proposed by scholars globally. Firstly, Pistre et al. and Qiao suggested replacing the monopole receiver with multiple circumferentially distributed cylindrical or plate-like receivers along the tool, designed to capture reflected P-waves from different azimuths outside the well [8-9]. Secondly, Tang et al. and Wei developed the dipole reflected S-wave imaging logging method based on the polarization characteristics of the dipole source, building upon the developed orthogonal dipole array acoustic logging tools [10-11]. Currently, monopole reflected P-wave imaging and dipole reflected S-wave imaging methods are recognized as two principal avenues of development, as elaborated below.
1.2.1. Monopole reflected P-wave imaging logging
A monopole source commonly utilizes a cylindrical piezoelectric transducer as illustrated in Fig. 1a . It maintains a constant symmetrical cylindrical shape during radial expansion and contraction vibration, with its horizontal radiation directivity forming a circular surface, as shown in Fig. 1b . The monopole source predominantly emits P-wave energy uniformly into formations. After encountering interfaces with discontinuous acoustic impedance, such as fractures, these waves are reflected as P-waves and return to the well. The monopole receivers capture all the reflected signals from different azimuths. Unfortunately, the monopole reflected P-wave logging technology and equipment designed on this principle lack the ability to discern the orientation of reflectors outside the well.
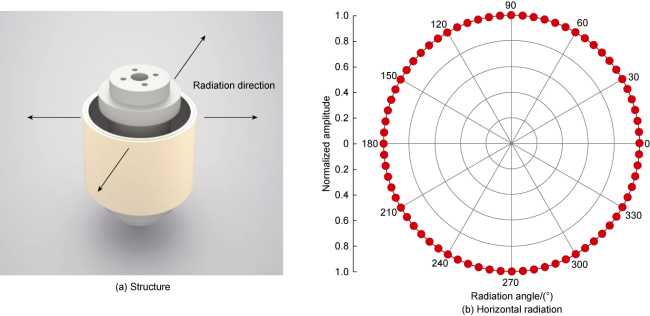
Fig. 1. Structure and radiation pattern of a monopole source. |
1.2.2. Dipole reflected S-wave imaging logging
A dipole source commonly utilizes a piezoelectric transducer with a planar structure as depicted in Fig. 2a . The transducer in X+ and X− directions consistently maintains the same orientation throughout the vibration process, leading to a horizontal radiation pattern that resembles the "number 8" rotated by 90° (Fig. 2b ). The combined vibration of the transducer in Y+ and Y− directions results in a similar "8" radiation pattern. Therefore, the waveform emitted by the X-component of the dipole source and captured by the X-component of the dipole receiver is conventionally denoted as a XX waveform. By the same token, waveforms XY, YY, and YX can be derived, and these four sets of waveforms are collectively known as dipole four-component waveforms. As the dipole source does not uniformly radiate acoustic energy into formations, the dipole reflected S-wave logging technology and equipment has a certain level of azimuthal resolution for reflectors outside the well.
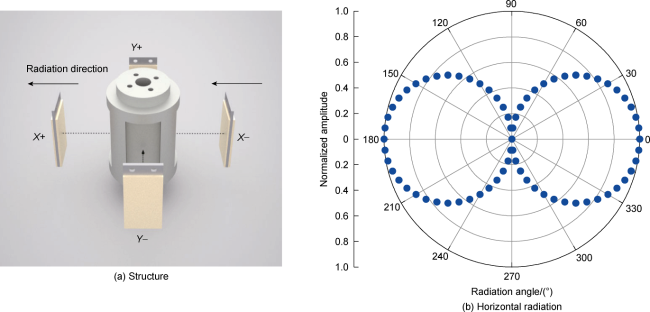
Fig. 2. Structure and radiation pattern of a dipole source. |
Tang et al. conducted systematic investigation into the characteristics of the acoustic field radiated by the dipole source, and pointed out that horizontally polarized S- wave (SH) exhibits a broader radiation area and enhanced reflection sensitivity, making it suitable for determining the orientation of reflectors outside the well [12⇓-14]. As shown in Fig. 3 , when there is a reflector outside the well, the acoustic energy excited by the X or Y component of the dipole source may be decomposed into vertically polarized S-waves (SV waves) and SH waves on the radiation plane. The SV waves exhibit both reflection and transmission at the location of the reflector, and the reflected waves includes both SV-SV waves and mode-converted waves from SV to P-waves (SV-P waves). The SH waves do not undergo mode conversion, so the reflected waves consist only of SH-SH waves. Particularly when the reflector is a fluid-filled fracture, the SH reflection coefficient, according to the Zoeppritz equations, reaches the maximum value of 1, indicating a total reflection phenomenon. These reflected waves can be synthesized into dipole four-component waveforms on the radiation plane and then propagate back to the well, finally received by the dipole receivers. This is the theoretical basis for determining the orientation of reflectors outside the well based on the four-component dipole reflected S-waves.
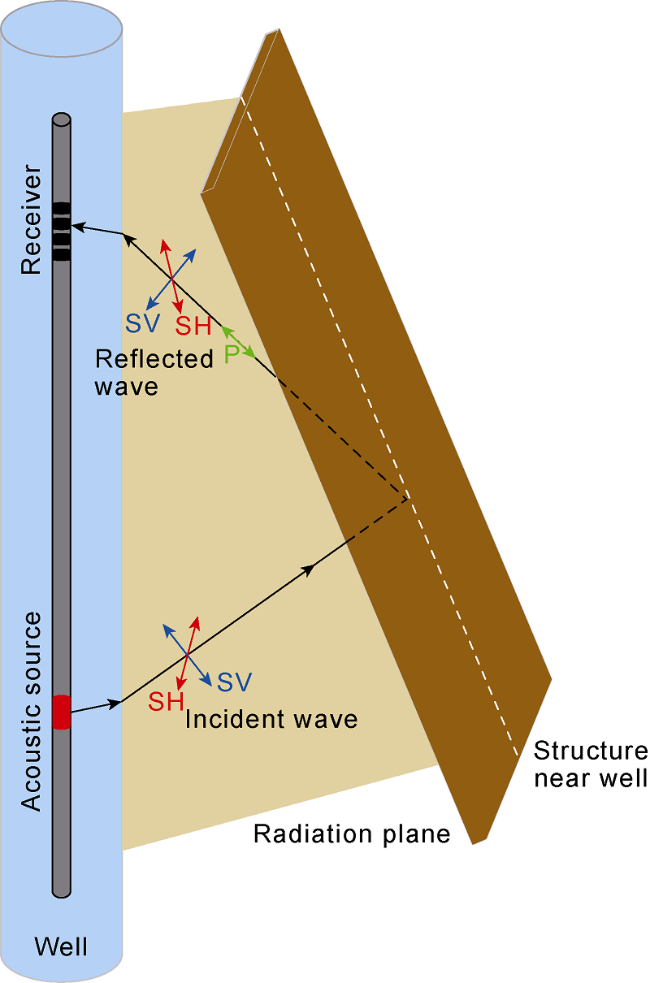
Fig. 3. Schematic of the ARIL principle. |
2. Significant processing and interpretation methods and software of ARIL
2.1. Extraction of fracture reflected waves
After understanding the principle of the ARIL method, it is necessary to utilize digital signal processing techniques to extract reflected waves from well logging data that represent fractures and vugs outside the well, and to perform migration imaging on them. The extraction of reflected waves is the foundation of data processing and interpretation because the accuracy of the data directly affects the subsequent imaging quality of reflectors. Considering a big acoustic impedance difference between the drilling fluid in the well and the surrounding formations outside the well, most acoustic energy will be confined within the well, and become guided waves such as Stoneley waves that propagate along the well wall. Only a small portion of the energy can be reflected back after entering the formation. Researchers focused on how to suppress the mode waves near the well, and proposed a series of signal processing methods such as Radon transform and multi- scale correlation to filter out the mode waves [15⇓⇓⇓⇓⇓-21]. By studying the consistency of transducers, Cai et al. developed a reflected wave extraction method based on parameter estimation, and made some achievements [22]. However, they overlooked the impact of various noises generated under complex well environments and geological conditions on the reflected waves, such as energy attenuation and multiples. Wu and Liu, by analyzing the characteristics of ARIL data, systematically sorted out the coherent and incoherent noises affecting the accuracy of reflected waves. Coherent noises include lithologic interface waves and multiples, while incoherent noises include low-frequency and high-frequency noises and bad traces. By deeply discussing the mechanisms, response characteristics, and suppressing methods of these four types of noises, such as the inclined median filtering method for lithologic interface waves and the matched tracking ray beam synthesis method for bad traces, a step-by-step extraction method for reflected waves of fractures and vugs outside the well was proposed, and the effectiveness of the method was verified by field examples [23-24]. As shown in Fig. 4 , the geological data from the study area indicate that a fracture-vug system was developed around Well Y1 under the jointing influence of faults and karst, but gas measurement found no oil or gas display in the well, and the interpretation of conventional well logging data provided a dry layer. All these findings may prove that the well did not encounter the fracture-vug system. In order to further verify the development of the fracture-vug system around Well Y1, we processed the ARIL data using the reflected waves step-by-step extraction method, and finally extracted the reflected S-waves representing the fracture-vug system after successively suppressing noises such as low- and high-frequency noise, formation interface waves, and multiples (Fig. 4 ).
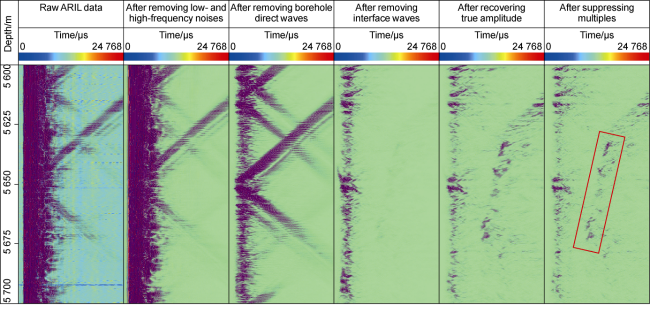
Fig. 4. Step-by-step extraction results of reflection waves from fractures and vugs outside the vertical well Y1. |
2.2. Migration under well logging observation systems
After extracting effective reflected waves, it's necessary to select an appropriate migration algorithm for accurately imaging the geological structures around the well. To accurately obtain the spatial position of reflectors, the imaging algorithm on one hand needs to have high imaging accuracy, and on the other hand, it needs to have high computational efficiency for production requirements. Considering that ARIL uses high-frequency elastic waves to detect fractures, the imaging methods can refer to seismic imaging methods, but they should have their own particularities. For example, seismic observation systems record seismic data with long offsets and multiple coverages, while well logging observation systems only record data by using a few receivers in a short aperture. In addition, the interval velocity changes rapidly in a vertical well, which contradicts the horizontal layered velocity model preset by seismic migration algorithms. Well logging observation systems also have the advantages of a short shot interval (7 shots in 1 m) and high source frequency. Therefore, taking into account the strengths and weaknesses of such well observation recording systems, two migration algorithms were proposed: ray-based migration and wave-based migration [25-26].
Kirchhoff migration is a widely applied ray-based migration method whose physical foundation is rooted in the high-frequency approximation asymptotic theory of wave propagation. The traveltime field is particularly crucial for the spatial positioning of reflectors around the well, which is typically obtained from factorized eikonal equations and kinematic ray tracing equations. Considering the traveltime field usually has a large curvature near the source, it is also necessary to factorize the traveltime field, thereby developing traveltime calculation methods based on factorized eikonal equations. Under the seismic observation system, Kirchhoff pre-stack depth imaging only needs to consider the traveltime relationship, and in the imaging process, the use of data from a long observation aperture and dense spaced receivers allows for the elimination of imaging noises through multiple stacking. However, the well logging observation system does not have this condition. Therefore, under the premise of considering the traveltime relationship, Kirchhoff migration under the well logging observation system also needs to use the ray parameters at the receivers as imaging conditions, thereby reducing the impact of noises on imaging.
Reverse time migration (RTM) is a widely used wave- equation-based migration method for seismic exploration. It employs finite-difference solutions to calculate the forward and backward acoustic wavefields, and then performs cross-correlation imaging based on the wavefields at the same time. Li, Zhang and Li introduced the method to process ARIL data [27⇓⇓⇓-31]. They developed the RTM theory to address technical challenges such as large data volume, severe numerical dispersion and unclear imaging of deep reflectors under well logging observation systems, and proposed least squares differential coefficient optimization and normalized cross-correlation imaging conditions to improve imaging efficiency and quality, and verified the effectiveness of their algorithms through multiple well logging examples. As shown in Fig. 5 , according to the four-component reflected S-wave extraction result from Well Y1 (Fig. 4 ), the RTM imaging found a large reflector at 60°NE, 5 640 to 5 682 m deep, and 12 m to 28 m from the well. Based on the processing and interpretation results of the ARIL data, micro-side drilling operation was carried out in the well, and drilling fluid of 2.7 cubic meters was lost at slant depth of 5 690 m, indicating the fracture-vug system was encountered. 150 m3/d of oil and 90 000 m3/d of gas were obtained during well test. The high-yield industrial oil and gas flows verified the success of ARIL imaging accuracy.
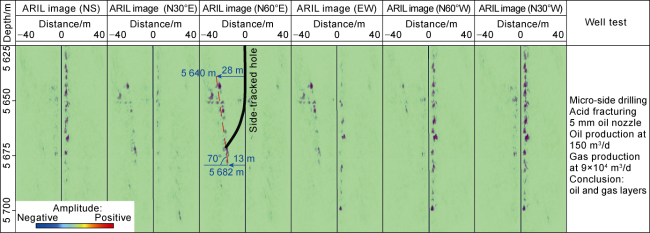
Fig. 5. Pre-stack depth migration imaging under well logging observation system in vertical well Y1. |
2.3. 3D ARIL imaging in horizontal wells
Horizontal wells play a significant role in increasing reservoir drill-in rate and producing area, and thus contributing to recovery and output by a substantial increase. Drilling horizontal wells has been widely conducted in oil fields worldwide, especially in the development of deep, ultra-deep and shale reservoirs. Although the original intention of developing ARIL technology is to evaluate large-scale fractures in reservoirs around vertical open holes, with wide application of horizontal wells, how to continuously track the reservoir boundaries that are nearly parallel to the well trajectory while identifying fractures within the reservoirs has become an urgent scientific and application issue. Solving it is of great significance for geosteering horizontal wells and setting up fracturing and development plans [32⇓⇓⇓⇓⇓-38]. As early as the 1990s, Schlumberger experts discovered reflected information from the reservoir boundary nearly parallel to the horizontal well, which proved that ARIL can identify the reservoir boundaries outside horizontal wells [39⇓-41]. Liu et al. and Wu developed a dipole reflected S-wave logging method for horizontal wells, and pointed out that the reflected energy from reservoir boundaries is mainly SH waves whose polarization direction is parallel to the strike of the reservoirs. They have preliminarily achieved the characterization of reservoir fractures and the tracking of reservoir boundaries outside horizontal wells [42-43].
The 3D imaging technology uses ARIL data to separate, extract, and interpret various types of reflectors such as fractures and reservoir boundaries outside horizontal wells. The well logging observation system (Fig. 6 ) consists of two parts: vertical and horizontal slices. In the case of high-angle fractures crossing the horizontal slice, imaging the fractures relies on reflected SV waves; for fractures within the vertical slice, imaging them relies on reflected or scattered SH waves. A reservoir is generally different from adjacent layers in terms of lithology and physical properties, resulting in significant acoustic impedance differences at their boundaries. Therefore, it's theoretically feasible using ARIL data to identify the reflected waves from reservoir boundaries and track and image them [44]. Fig. 7 shows the 3D image of the reflectors after processing ARIL data recorded in Well X1. Fractures can be observed in the horizontal slice. And in the vertical slice, not only can small and high-angle fractures be observed, but also larger and continuous reservoir boundaries are identifiable.
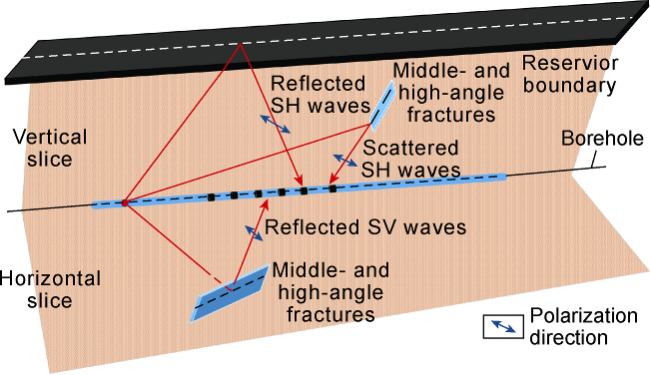
Fig. 6. Schematic diagram of ARIL in a horizontal well. |
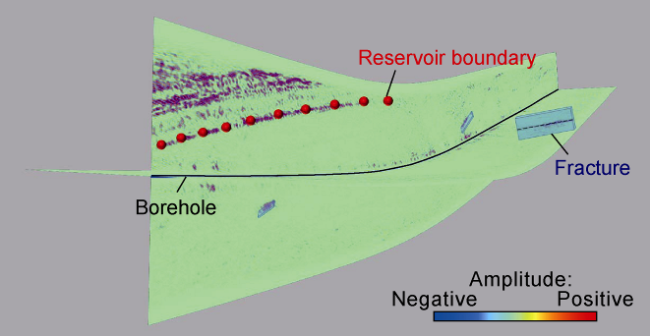
Fig. 7. 3D ARIL image in horizontal well X1. |
2.4. ARIL processing and interpretation system
Based on the aforementioned key technologies, an ARIL processing and interpretation system was developed on the CIFLog platform. The system consists of two subsystems for vertical and horizontal wells (Fig. 8 ). The vertical well ARIL subsystem includes five modules: waveform preprocessing and quality control, step-by-step extraction of fracture reflected waves, azimuth correction of reflected waves, near-well velocity modeling, and migration imaging under the well logging observation system. The module for step-by-step extraction of fracture reflected waves takes into account the impact of complex well environment and geological conditions, and suppresses various types of noises. The migration imaging module includes two algorithms: Kirchhoff migration which enables rapid migration imaging of fractured- vuggy bodies in the entire well section and at all directions; and reverse time migration which allows for fine migration imaging of key stratigraphic sections. The horizontal well ARIL subsystem is more complex, and comprises three parts: near-well fracture imaging and quantitative characterization, far-well fracture imaging, and continuous tracking of reservoir boundaries, and each of them includes multiple software modules. In summary, the ARIL processing and interpretation system developed based on the CIFLog software covers the entire process of ARIL processing and interpretation, providing effective technical means for the identification, evaluation, and 3D imaging of various types of reflectors such as fractures and reservoir boundaries outside vertical and horizontal wells.
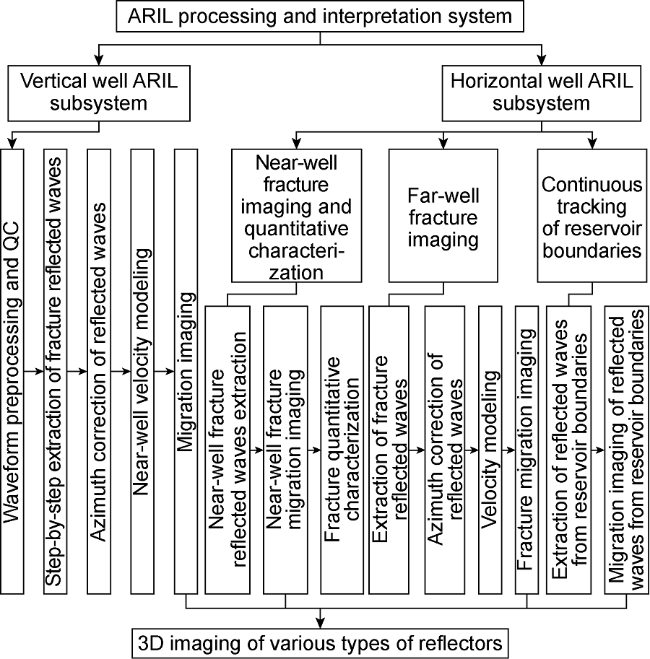
Fig. 8. CIFLog ARIL processing and interpretation system. |
3. Field applications
The significant role of ARIL technology is increasingly demonstrated in various oil and gas exploration and development, such as the identification of fractured-vuggy bodies, prediction of casing deformation in horizontal wells, evaluation of hydraulic fracturing effects, and lateral tracking of favorable reservoirs. The following section presents four case studies on typical reservoirs, such as the ultra-deep carbonate reservoirs in the Tarim Basin and the deep shale gas reservoirs in the Sichuan Basin, to demonstrate the application effectiveness.
3.1. Identification of fractured-vuggy bodies
In the Tarim Basin as a major battlefield for ultra-deep oil and gas exploration and development in China, fractured-vuggy carbonate reservoirs in platform-basin areas and fractured clastic reservoirs in foreland areas are two ultra-deep exploration targets [45-46]. Geological and seismic data from Well Y2 drilled in a platform-basin area (Fig. 9a ) indicate that the reservoir zone is mainly distributed 120 m below the top of the Ordovician Yijianfang Formation, and exhibits layered distribution laterally. On the 3D pre-stack depth migration section across Well Y2 (Fig. 9a ), "bead-like" seismic reflection is clear at the designed target point at the top of the Yijianfang Formation, shown by a "two-peaks and one-trough" pattern with strong energy, indicating a large fracture-cavity system. An adjacent Well Y2-1, also targeted at "bead-like" reflection from the Yijianfang Formation obtained industrial oil and gas flow. The production test results show that fractured-vuggy reservoirs are well developed and have a good oil production capacity [24].
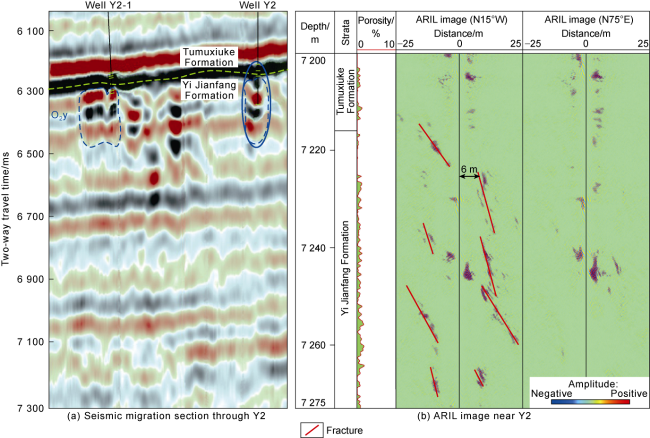
Fig. 9. An example of Ordovician ultra-deep fractured-vuggy carbonate reservoir in vertical well Y2 in the Tarim Basin. |
The processing and interpretation of conventional logging data recorded in Well Y2 found that the target formation has relatively pure lithology, but poor physical properties--the porosity is less than 2% (Fig. 9b ). The target reservoir was finally interpreted to be a dry layer. No oil or gas flowed out even without any nozzle. To further verify the development of fractures and vugs adjacent to Well Y2, ARIL data was logged. After reflected wave extraction and migration imaging (Fig. 9b ), multiple fractured-vuggy reflectors in the Ordovician Yijianfang Formation were found in the 15°NW image (the 4th lane). However, the number of reflectors is significantly less in the 75°NE image (the 5th lane). The findings prove the existence of fractured-vuggy bodies outside Well Y2, and their strike is mainly 15°NW. Further detailed observation of the fractured-vuggy reflectors marked by the red solid line in the 15°NW migration image found that they did not penetrate the well, and the minimum distance between them is more than 6 m. This also explains why the conventional logging data (with a maximum detection distance of 3 m) provided poor physical properties and no oil or gas indication in well test. Based on the ARIL data, acid fracturing stimulation was carried out on the target formation in Well Y2. Post-fracturing production test obtained equivalent oil production at 32.88 m3/d. This indicates that fractures and vugs have been connected after acid fracturing stimulation.
3.2. Prediction of casing deformation in horizontal wells
The deep shale gas reservoir in the Sichuan Basin represents a significant domain for the exploration and development of shale gas in China, and plays a crucial role in pioneering new frontiers in the field. The practical experience of exploration and development in in the Sichuan Basin has demonstrated that fractures and faults around horizontal wells have a dual impact. On one hand, they positively enhance the permeability of the reservoir, thereby increasing oil and gas production. On the other hand, they induce negative risks such as casing deformation and inter-well pressure interference [36-37]. At present, primary data collected in horizontal wells are array acoustic logging measurements. The effective utilization of these data to identify fractures and faults has become a key research endeavor.
Li, Liu and Fan have developed a multi-scale fracture evaluation method based on acoustic logging data. This method includes the application of reflected Stoneley wave extraction and imaging techniques for quantitative characterization of fractures 0 to 3 m away from wellbore, and the use of ARIL technology to identify fractures 3 m to 25 m away from wellbore [47]. Fig. 10 illustrates the evaluation of fractures and faults around X2 in the Sichuan Basin. From top to bottom, there are far-well fracture imaging, near-well reflected amplitude, near-well fracture imaging, and depth. The near-well imaging indicates several through-well fractures at 5 500-5 600 m. The red vertical lines on the reflected amplitude lane denote the quantity of through-well fractures, while the amplitude values reflect the development of fractures near well, such as fracture opening and extension. The ARIL imaging results also demonstrate how fractures developed in this interval, and some extend to the detected boundary at 25 m from the well. Further analysis of the geological model based on seismic ant colony and LWD data found a through-well fault at 5 530 m. This suggests that ARIL technology can not only identify through-well faults but also the associated secondary fractures, which enables the precise prediction of casing deformation locations in horizontal wells.
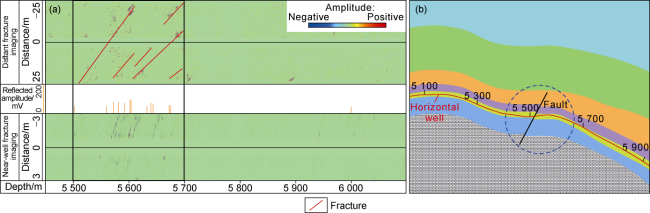
Fig. 10. Geological model (a) and fracture and fault image (b) of deep shale gas reservoirs in horizontal well X2 in the Sichuan Basin. |
3.3. Hydraulic fracturing evaluation
As hydraulic fracturing operations become increasingly prevalent for deep, ultra-deep and unconventional oil and gas reservoirs, their impact has drawn considerable interest. On the one hand, hydraulic fracturing stimulation significantly contributes to oil and gas production by increasing the number of fractures and their interconnectivity. On the other hand, the associated micro-seismic events and environmental concerns cannot be ignored. Effective evaluation of hydraulic fracturing effects is thus particularly crucial. Li et al. introduced a time-lapse ARIL method which involves acquiring logging data before fracturing to image natural fractures, and then logs again after fracturing to capture the comprehensive image of natural and artificial fractures [48]. By comparing the two images, the development of fractures several tens of meters around the well is clear. The method has been proved effective for deep carbonate reservoirs in the Tarim Basin and shale oil reservoirs in the Junggar Basin [49].
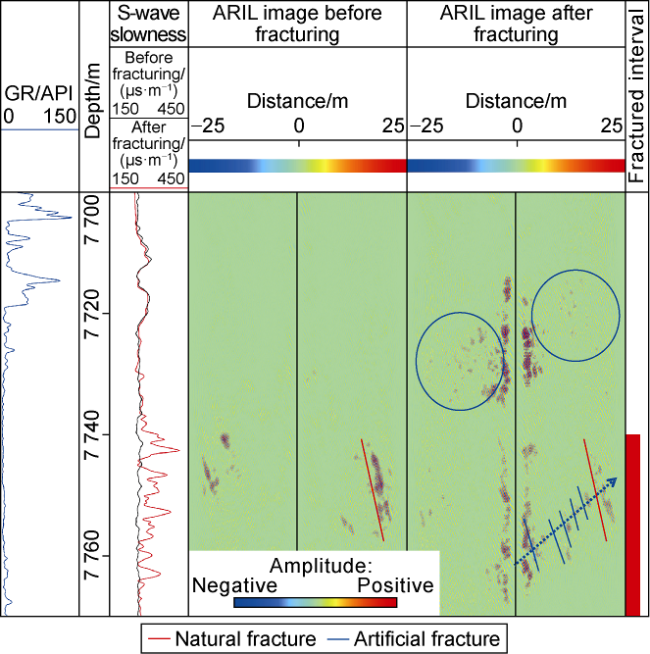
Fig. 11. ARIL images before and after hydraulic fracturing stimulation in vertical well Y3. |
3.4. Lateral tracking of favorable reservoirs
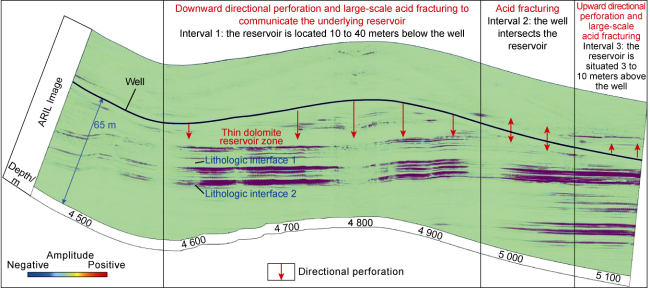
The Upper Permian Maokou Formation in the Sichuan Basin, known for diverse reservoir types and extensive distribution, has been an important target for Southwest Oil and Gas Field since the 20th century. The beach dolomite, as one of the primary reservoir types within the Maokou Formation, is characterized by developed dissolution fractures and vugs, thin-layered reservoirs and uneven dolomitization which present big challenges to the identification of thin dolomite reservoirs through seismic exploration. Well X3 targeted the Maokou Formation is a horizontal well designed to penetrate the thin dolomite reservoir zone by nearly a kilometer (Fig. 12 ). Conventional logging data were recorded after drilling operation, and processed and interpreted. It's found that the well drilled in the dolomite reservoir only at measured depth from 4 950 m to 5 030 m, and considerable deviation happened between the actual well trajectory and the designed. Conventional logging data is ineffective for ascertaining the relative position relationship between the dolomite reservoir and the horizontal well.
Fig. 12. The ARIL image of a thin dolomite reservoir zone in horizontal well X3 in the Sichuan Basin. |
However, the ARIL data provided the image of the thin dolomite reservoir and two underlying lithological interfaces vertically nearly 100 m and horizontally nearly 1 000 m around well X3 (Fig. 12 ), and clarified the positional relationship between the thin dolomite reservoir and the horizontal well. In interval 1, the reservoir is located 10 m to 40 m below the well; in interval 2, the well intersects the reservoir; and in interval 3, the reservoir is 3 m to 10 m above the well. Based on the ARIL interpretation, the following well test plan was recommended: in interval 1, downward directional perforation and large-scale acid fracturing to communicate the underlying reservoir; in interval 2, direct acid fracturing; and in interval 3, upward directional perforation and large-scale acid fracturing. The well test plan was accepted and performed. A high-yield industrial gas flow at 166.66×10⁴ m3/d was obtained, proving the effective ARIL technology for laterally tracking favorable reservoirs.
4. Prospects for the future
The ARIL technology is able to effectively identify diverse reflectors around wellbore by largely expanding the detection scope. It broadens the application of well logging technology from supporting oil and gas exploration to supporting oil and gas development, and from evaluating conventional reservoirs to evaluating unconventional reservoirs. Moreover, it helps interdisciplinary research such as logging-seismic, logging-drilling, and logging-development. To meet the requirements of oilfield production and technology development, ARIL data processing and interpretation will shift to the following fields.
4.1. Well-seismic tie imaging and reservoir inversion
The Strata software, pioneered by Hampson-Russell, quickly gained popularity and application in domestic oil fields following its installation and demonstration at PetroChina Research Institute of Petroleum Exploration & Development in 1991. Its rapid adoption is attributed to the innovative core methodology of seismic inversion constrained by well logging data. By acquiring P-wave slowness and density logs in a vertical well, the method calculates the reflection coefficients of the formations and subsequently generates high-resolution seismic profiles adjacent to the well through convolution with seismic wavelets. This approach, for the first time, scientifically integrated logging data with seismic data, making significant contribution to the development and breakthrough in geophysical reservoir inversion [50].
The rapid development of ARIL technology offered a new insight for well-seismic tie imaging. This technology's capability to directly capture reflection signals outside the well provides a direct method for integrating downhole logging signals with ground seismic reflections. This capability is crucial for the development of innovative algorithms that perform joint inversion of well-seismic data. The major technical challenges faced by well- seismic imaging and reservoir inversion include difficulties in depth matching between ARIL data and seismic data, significant differences in frequency bands, and inconsistencies in scales. Preliminary progress has been made in consistently imaging reservoir boundaries using ARIL data and post-stack seismic data.
4.2. Imaging fractures in shale reservoirs
Shale reservoirs are an important target for oil and gas exploration and development in China, both currently and in the future. Compared with carbonate and tight sandstone reservoirs, shale exhibits relatively "softer" physical properties. Take the Gulong shale oil in Daqing oilfield as an example. The P-wave and S-wave velocities of the Cretaceous Qingshankou Formation are generally 2 900 m/s and 1 600 m/s, respectively, which are 53% and 52% lower than those of carbonate reservoirs [51]. Whether using monopole or dipole logging tools, more energy is absorbed by formation and converted into heat when acoustic waves propagate through shale reservoirs. This makes the applicable ARIL technology unable to "reach far" or "image fractures clearly". To overcome the typical technical inapplicability, on the one hand, future development should focus on developing powerful acoustic source probes that can work in high-temperature, high- pressure and narrow wellbore to compensate for the severe attenuation of acoustic energy. On the other hand, it is necessary to accurately calculate the P-wave and S-wave quality factors for shale reservoirs at logging frequency, and develop processing methods for recovering the true amplitude of reflected waves.
Shale reservoirs are strongly anisotropic. For instance, the velocity difference between SH and SV shear waves of the deep shale gas reservoirs in the Sichuan Basin is as high as 15%. Present ARIL methods developed for isotropic media are no longer applicable because of ineffective denoising and focus in fracture imaging. How to detect small-scale fractures in strongly anisotropic reservoirs by ARIL technology is still unclear, and the methods for accurately imaging fractures and reservoir boundaries are unavailable. Future efforts should concentrate on the two challenges.
4.3. Multi-scale hydraulic fracturing evaluation
Present ARIL technology is affected by borehole mode waves with strong amplitude, which makes it difficult to effectively detect hydraulic fractures 3 m from the well. Stoneley waves are sensitive to fractures filled with fracturing fluid. When they propagate along the wellbore, they produce distinct reflection signals at fracture locations. An imaging and quantitative evaluation method for near-well fractures based on Stoneley waves may effectively compensate for the blind spots in fracture detection by ARIL. On the other hand, the detection range of micro-seismic monitoring technology is not constrained by the well and can typically indicate fracturing events several hundred meters away from the well. However, the micro-seismic technology is greatly influenced by factors such as the layout of surface geophones and velocity model, leading to lower accuracy in fracture identification. Multi-scale fracture evaluation will be the main direction for evaluating fracturing effects. It will integrate Stoneley waves, ARIL and micro-seismic monitoring to study the three-dimensional imaging of artificial fractures from near-well to far-well and from a small scale to a large scale.
4.4. Geosteering LWD
Geosteering LWD is an interdisciplinary technology that involves geology, drilling and well logging. It can real-time acquire and process geophysical information around the drill bit using a geosteering LWD tool to ensure the well contacts reservoirs at the best position [52⇓-54]. GR and resistivity LWD methods and tools have been ready, and can real-time provide petrophysical parameters near the drill bit, but their detection is limited (less than 1 m) and they send out signals only after the drill bit goes out of the reservoir, so that it is hard to predict the reservoir boundary in advance [55]. Deep electromagnetic LWD can measure the formation resistivity tens of meters around the drill bit. It significantly expands the detection scope and ensures that the drill bit is always in the reservoirs [56]. However, the application of this technology is subject to certain formation conditions and effective only when there is a significant resistivity contrast between reservoir and surrounding formation.
The geosteering LWD technology that combines ARIL will be an important direction in future well logging development, and it will be very useful for detecting deep and ultra-deep reservoirs and shales with significant acoustic impedance contrasts. Two key challenges should be solved. First, develop an ARIL tool that can effectively suppress the noise from the drill collar to improve the quality of recorded waveforms. This can be addressed through innovative methods such as cutting a groove on the drill pipe, as suggested by Su, Tang, and Hei [57]. Second, to develop a real-time processing algorithm and software module that ensures the imaging result of the reservoirs surrounding the drill bit is promptly fed back to the surface.
4.5. Innovation of ARIL tools
Reviewing the evolution of well logging technology, advancements in both software and hardware exhibit a spiraling upward trajectory. At present, the ARIL technology encounters a bottleneck in signal processing and software development. It is challenging to "see further" (radial detection less than hundred meters) and "see clearer" (180° ambiguity in the orientation of reflectors), which should be solved by making innovation on ARIL tools.
The development of ARIL instruments is moving forward along two key trajectories. The first involves improving the instrument structure to increase the detection scope, such as powerful acoustic transducers that can work in high-temperature, high-pressure and narrow wellbore. The second is to update logging principles to get precise reflector orientation. For example, efforts can be made on the dual-dipole staggered transmission and eccentric acoustic logging methods proposed by Chao et al. and Xu et al. [58-59] to break through limitations and achieve more accurate subsurface images.
5. Conclusions
This paper reviews the development history of ARIL technology, key processing and interpretation methods, software systems, and the effectiveness of field applications, and points out the future development directions. In terms of key processing and interpretation methods, the paper focuses on the extraction of fracture reflected waves, logging observation system, 3D migration imaging, and ARIL processing and interpretation system based on the CIFLog logging platform. In terms of field applications, ARIL technology has played an important role in oil and gas exploration and development, including the identification of fractured-vuggy bodies, prediction of casing deformation in horizontal wells, evaluation of hydraulic fracturing effects, and horizontal tracking of favorable reservoirs. Looking forward, the development of ARIL technology will focus on several directions: well- seismic tie imaging and reservoir inversion, fracture imaging of shale reservoirs, multi-scale hydraulic fracturing evaluation, geosteering LWD, and innovation of well logging instruments. In summary, as a cutting-edge geophysical technology, the ARIL technology has broader application in oil and gas exploration and development. With continuous advancement and innovation, it is expected to make more breakthroughs and contributions to the development of the oil and gas industry.