

Introduction
China has a great potential of continental shale oil, with the medium-to-high mature shale oil resources of 283×108 t according to the national resource evaluation in the period of the 13th Five-Year Plan of China [1]. After years of exploration, three national shale oil development demonstration zones were established in Jimusaer in Xinjiang Oilfield, Gulong in Daqing Oilfield, and Jiyang in Shengli Oilfield [2]. The shale oil production exceeded 340×104 t in 2022, and it is estimated to reach 1 300×104 t by 2030 [3]. Shale oil will behave as a powerful support for China to maintain an oil production at 2×10⁸ t for a long term. Continental shale oil reservoirs in China have typical characteristics of complex lithology, low pressure coefficient, high oil viscosity, poor fracture development, strong heterogeneity, and large bidirectional stress difference. These characteristics lead to difficult reservoir stimulation and rapid decline of formation energy. How to replenish the formation energy is crucial for achieving high recovery efficiency of shale oil [4⇓-6].
CO2 has positive effects on recovering shale oil, including dissolution, diffusion, viscosity reduction, energy replenishment, and miscibility. The CO2 pre-pad fracturing and energy replenishment technique is applied in the early stage to effectively increase the reservoir elastic energy, expand the fracture propagation range, and improve the flow ability of crude oil, thereby enhancing the development efficiency of shale oil [7-8]. During development of shale oil, CO2 can be injected to replenish formation energy, realize miscibility, reduce viscosity, and achieve imbibition for further enhancing the shale oil recovery. Therefore, CO2 injection is considered as the most promising enhanced oil recovery (EOR) method for shale oil reservoirs [9-10].
In terms of experimental research, scholars focused on the feasibility of CO2 injection into shale oil reservoirs, such as CO2 huff-n-puff for EOR, exploitation from various pores, and optimization of injection parameters [11⇓⇓⇓⇓-16]. However, the exploitation patterns, influencing factors, and mechanisms of CO2 injection have been rarely studied. Further efforts are required to clarify whether the mechanism of CO2 injection into oil shale is different from low-permeability or tight cores.
In terms of CO2 pre-pad fracturing in shale oil reservoirs, it is found that CO2 pre-pad fracturing technology is highly capable of microfracture transformation and energy replenishment, and can reduce the crude oil viscosity, which is conducive to further improving well productivity and recoverable reserves, as compared with the volumetric fracturing technology using water-based fracturing fluid [17⇓⇓⇓-21]. For example, at a test well J100043 in the Jimusaer shale oil block Xinjiang Oilfield, CO2 pre-pad fracturing was implemented to increase the recoverable reserves by 0.9×10⁴ t [2]. On a platform of Changqing Oilfield, CO2 fracturing was conducted in Class II shale oil reservoirs, contributing an initial daily oil production of 20.6 t, indicative of remarkable results [2]. Well JYY-1HF, the first horizontal shale oil well in the Songliao Basin, was successfully fractured with 21 stages in the 1 431 m section by using supercritical CO2 composite volume fracturing technology, achieving a high-yield industrial shale oil flow of 16.4 m3/d [18]. Clearly, the CO2 pre-pad fracturing technology is becoming mature and has shown remarkable results in field applications. Nonetheless, the volume of CO2 pre-pad determines the extents of energy replenishment and sweep, and its quantitative optimization needs to be further studied.
In terms of CO2 injection practices, the field test of CO2 huff-n-puff has made a breakthrough in single well. At a typical well group targeting the second member of Kongdian Formation (Kong 2 Member for short) shale oil reservoirs in the Guandong block, Dagang Oilfield, CO2 huff-n-puff was implemented to replenish formation energy. In the pilot test, the strategy of “huff-n-puff in the central wells, and simultaneous soaking and flow production in side wells” was adopted. In the process, 276 t CO2 was injected, and the daily oil production of the well group was 10.8 t before huff-n-puff and reached 23.6 t initially after huff-n-puff, corresponding to an effective period of 459 d and a phased oil increment of 1 962.5 t [2]. Well SD1 in the Qintong sag, Subei Basin, was provided with field test of 10 000-t-level CO2 huff-n-puff. The daily oil production was 8.85 t in the early stage, and peaked up to 31.2 t in the plateau period. The cumulative oil increment was 2 519.36 t after 100 d of test production with blowout prevention, and the oil increment was predicted to be 7 800 t in a single cycle, demonstrating a good performance of CO2 huff-n-puff [22]. The technology of CO2 huff-n-puff is proved feasible in shale oil reservoirs, and further efforts will be devoted to clarifying the main factors controlling its development performance and optimizing the parameters of development scheme.
To solve the problems in efficient development of shale oil by CO2 injection, using nuclear magnetic resonance (NMR) and related technologies, experiments of CO2 injection for extraction and simulations of CO2 pre-pad fracturing and huff-n-puff for energy replenishment were conducted. The research achievements were applied in fields for CO2 pre-pad fracturing and huff-n-huff. The resulting theoretical insights and field application performance provide a support for the effective development of continental shale oil in China.
1. CO2 huff-n-puff experiments with shale oil cores
The typical laminated shale oil cores from the Jiyang Depression were investigated by using T2 and T1-T2 (T1 is longitudinal relaxation time, T2 is transverse relaxation time) online NMR techniques to understand the characteristics and influencing factors of shale oil production during CO2 injection.
1.1. Experimental design
1.1.1. Materials
The experimental fluid includes n-dodecane (99.5%) and pure CO2 gas (99.99%). The drilling core is fresh oil shale sample, without oil washing, and it shows NMR signal responses of organic matter, hydrocarbon and water in tests.
1.1.2. Equipment
NMR experiment is conducted using the porous media flow tester (Fig. 1 ), with the magnetic field intensity of 0.25 T, the dominant frequency of 9.86 MHz, and the echo spacing of 0.16 ms. The CO2 extraction device is designed and manufactured independently, with a temperature resistance up to 150 °C and a pressure resistance up to 30 MPa.
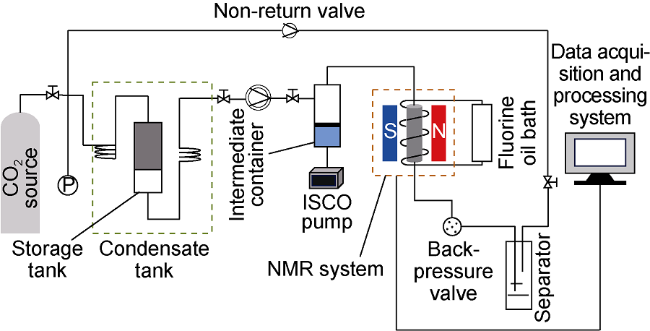
Fig. 1. Experimental unit for shale oil extraction by CO2 injection. |
1.1.3. Procedures
(1) Measure the T2 spectrum curve and 2D T1-T2 spectrum of the core (under restored formation conditions) after vacuumed and saturated with n-dodecane.
(2) Put the core into the NMR CO2 extraction device; rapidly inject CO2 until the pressure rises to 15 MPa (higher than the minimum miscibility pressure of 12.5 MPa), and complete the extraction within the designed time (Table 1 ); measure the T2 spectrum curve and 2D T1-T2 spectrum when the state becomes stable.
Table 1. Basic physical property parameters of cores and experimental schemes |
| Scheme | Length/ cm | Diameter/ cm | Porosity/ % | Permeability/ 10−3 μm2 | Extraction time/h |
|---|---|---|---|---|---|
| 1 | 2.559 | 2.495 | 5.51 | 0.074 | 15 |
| 2 | 2.557 | 2.493 | 5.18 | 0.306 | 25 |
| 3 | 2.550 | 2.498 | 4.58 | 2.189 (fractures) | 25 |
(3) Reduce the internal pressure of the core to 8 MPa by adjusting the back-pressure valve after extraction, and measure the T2 spectrum curve and 2D T1-T2 spectrum after the state becomes stable. Complete one cycle of huff-n-puff.
(4) Repeat steps (2) and (3) for three times to complete three more cycles of huff-n-puff.
(5) Replace the core and repeat steps (1) to (4) until all tests are completed.
1.2. Macroscopic characteristics of the oil production by CO2 huff-n-puff
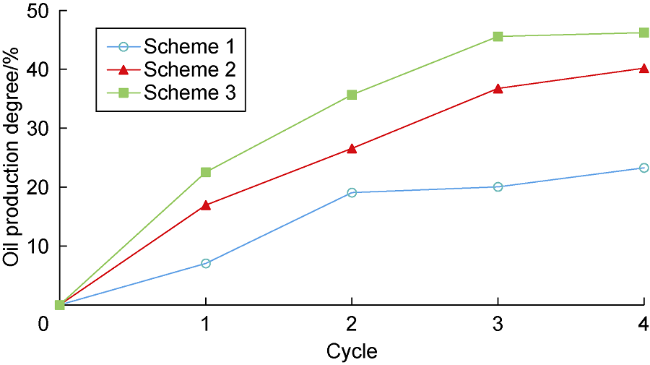
Fig. 2. Comparison of oil production degree by CO2 injection in different huff-n-puff cycles. |
Referring to the classification of pores by the International Union of Pure and Applied Chemistry (IUPAC) and combining with the characteristics of the pore structure of oil shale in the Jiyang Depression, pores are divided into micropores (<2 nm), mesopores (2-50 nm), macropores (50-1 000 nm), and bedding fractures (˃1 000 nm). Micropores and mesopores belong to nano-scale pores, while macropores and bedding fractures belong to micro-scale pores. Table 2 compares the production degree of crude oil in pores with different sizes after the same huff-n-puff cycle under different schemes. Pores in shales from the Jiyang Depression are mainly mesopores and macropores [23]. Data in the table 2 reveal that increasing the time of contact between CO2 and crude oil can significantly improve the production degree of macropores. The presence of fractures connects some mesopores and macropores, greatly increasing the production degree of crude oil in these pores. As shown in Fig. 2 , the oil production degree in Scheme 1 and Scheme 2 still increases apparently after the fourth cycle. It can be inferred that the active period of CO2 injection for improving shale oil recovery is long, which is related to the micro- and nano-scale effect, kerogen, adsorbed oil and other characteristics.
Table 2. Comparison of oil production degree of different pores by CO2 huff-n-puff |
| Pore type | Production degree after the fourth cycle/% | ||
|---|---|---|---|
| Micropore | 11.67 | 28.15 | 25.38 |
| Mesopore | 28.54 | 35.17 | 71.17 |
| Macropore | 48.32 | 79.78 | 84.77 |
| Bedding fracture | 75.43 | 91.90 | 93.90 |
| Total porosity | 23.27 | 40.19 | 46.22 |
1.3. Microscopic characteristics of oil production by CO2 huff-n-puff
The NMR T1-T2 spectrum can reflect the information such as the properties and mobility of fluid components. It is generally believed that a larger value of T1/T2 represents a heavier component of the corresponding hydrocarbon, and thus a worse mobility. The response regions of bound water and organic matter/heavy hydrocarbons on two-dimensional (2D) NMR spectra can be defined by low-temperature drying and high-temperature distillation of fresh oil shale core samples, and then the response regions of light hydrocarbons/mobile oil can be defined by oil-saturated core experiments. Fig. 3 shows the response regions of hydrocarbon and water signals in typical laminated shale cores in the Jiyang Depression, where region ① represents the signals of oil with heavy components in the cores, such as organic matter or heavy hydrocarbons, region ② represents the signals of clay bound water, and region ③ represents the signals of light hydrocarbons or mobile oil in the cores.
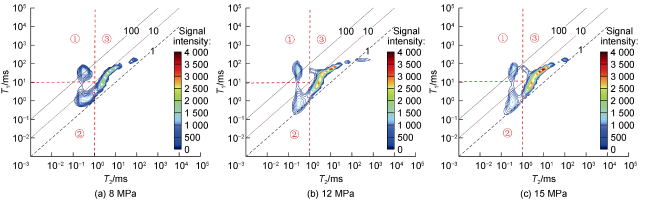
Fig. 3. T1-T2 NMR spectra under different pressures during CO2 injection in Scheme 3. |
Cores in Scheme 3 were analyzed for microscopic production characteristics of crude oil. The core saturated with oil was put into a holder, CO2 was injected, and the pressurized was increased step by step to 8, 12 and 15 MPa, when T1-T2 2D NMR test was carried out separately. Fig. 3 shows 2D NMR spectra under different pressures. By comparing the differences in spectra, the variations of different types of fluids in the core can be determined. It can be observed from the changes in region ① that when the CO2 pressure increases from 8 MPa to 15 MPa, the signal range and strength of fluid in region ① decrease gradually, indicating that the signals in this region gradually weaken, and the signals as a whole tend to move to the lower right, which suggests that the components in this region are changing. It is also observed that the color for 1<T1/T2<10 in region ③ gradually deepens, indicating that the fluid signals in this region are getting stronger, and the signal response begins to appear in the interval of 10<T1/T2<100. This shows that in the process of "huff", CO2 contacts with heavy hydrocarbon components through diffusion, and gradually reduces heavy hydrocarbon components and increases light hydrocarbon components through mass transfer, with intermediate components occurred, which increases the total amount of mobile oil in the core to a certain extent. In the process of "puff", with the release of CO2 pressure, this part of crude oil can be carried to nearby larger pores or bedding fractures, thereby improving the effect of CO2 huff-n-puff. However, due to the scale effect, the diffusion and mass transfer of CO2 in oil shale are slower than that in tight sandstone. Therefore, when designing the CO2 injection scheme or implementing the on-site soaking, a proper extension of the soaking time is conducive to improving the shale oil development effect of CO2 injection.
2. Influences of CO2 pre-pad on mechanical properties of shale
Compared with water-based fracturing fluid, CO2 pre-pad has unique advantages in fracturing treatment. CO2 pre-pad can interact with reservoir rock to change its mechanical properties, which will allow the formation of complex fracture network for expanding the stimulated reservoir volume (SRV) [24⇓-26]. In order to clarify the mechanism that CO2 pre-pad influences the oil shale SRV, the experiment of CO2 pre-pad injection in laminated core was designed to analyze the changes of rock mechanical properties.
2.1. Experimental design
2.1.1. Materials
Three types of fracturing fluids are used, including supercritical CO2, liquid CO2 and slickwater. Two shale cores from outcrops are immersed in each fracturing fluid for experiment.
2.1.2. Equipment
The rock-fracturing fluid immersion test system is employed for immersion test. The system is mainly composed of two parts: the high-pressure reactor, and the strain collector and acoustic emission test system. The high-pressure reactor is used to make interactions between the rock and fracturing fluid under a temperature of 45 °C and a pressure of 10 MPa. The strain collector is used to collect the deformation of rock when interacting with fracturing fluid, and the acoustic emission test system is used to monitor the energy released by the interactions between rock and fracturing fluid.
2.1.3. Procedures
(1) Put the core into the high-pressure reactor with the confining pressure of 50 MPa and the temperature of 45 °C, and measure the initial rock mechanical parameters of the core with the strain collector and the acoustic emission testing system.
(2) Inject the test fluid at the injection pressure of 10 MPa.
(3) Use the strain collector and the acoustic emission testing system to measure the mechanical parameters of the core after it contacts with the injected fluid at 24, 48, 72, 96 and 120 h of immersion respectively.
2.2. Influences of different fluids on mechanical properties of shale
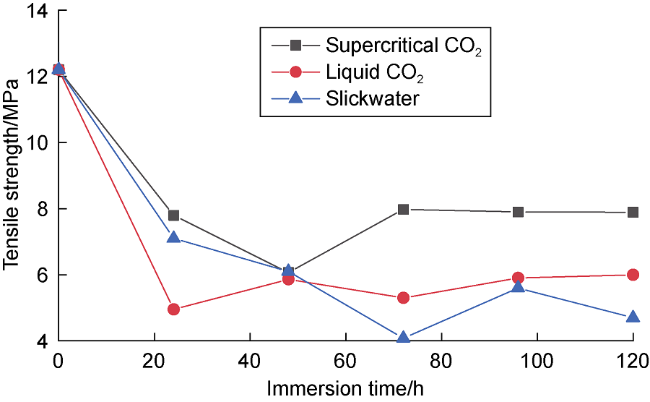
Fig. 4. Influences of CO2 and slickwater on tensile strength of shale. |
By comparing the elastic modulus, Poisson's ratio, and uniaxial compressive strength of shale cores (Fig. 5 ), it can be seen that, at 120 h, the elastic modulus, Poisson's ratio, and peak strength of cores are similar for supercritical CO2 and liquid CO2, and the elastic modulus and peak strength of cores are significantly lower for slickwater than supercritical CO2, while the Poisson's ratio is larger than that for supercritical CO2. This indicates that the slickwater fracturing fluid can better significantly reduce the shale strength than CO2 pre-pad. Injecting CO2 pre-pad can effectively maintain shale brittleness and facilitate the formation of complex fracture network.
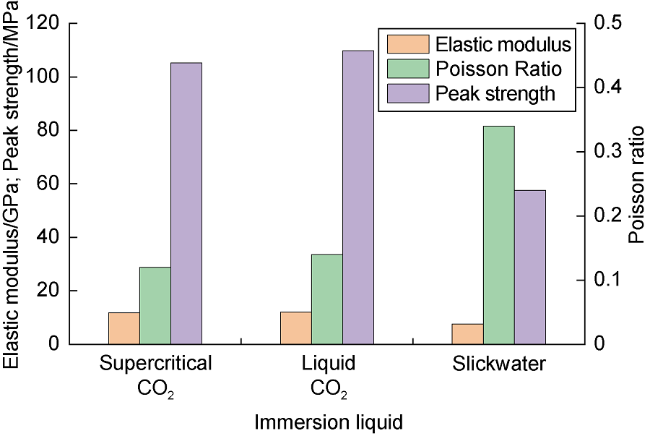
Fig. 5. Influences of CO2 and slickwater on mechanical properties of shale. |
3. CO2 pre-pad fracturing simulation and field test
CO2 pre-pad fracturing simulation was conducted. Then, CO2 pre-pad fracturing simulation and field test were performed for single well and well group by using oil shale samples from the Jiyang Depression, with remarkable results obtained.
3.1. CO2 pre-pad fracturing simulation
A three-dimensional (3D) fracture propagation model of shale was established using the ABAQUS finite element analysis software. The model is a cylinder with a diameter of 100 m and a height of 200 m. The model contains two parallel bedding planes, which are 30 m apart and located in the middle of the model (Fig. 6 ). The fracturing fluid injection point is located at the model center, and a constant-rate injection method is adopted. Meanwhile, cohesive elements with zero thickness are embedded inside the model to simulate the initiation of hydraulic fractures and bedding planes. The initial fluid saturation and porosity of the model are 100% and 20%, respectively. Considering the condition of hydrostatic excess pressure, a normal stress of 5 MPa is applied to the model surface. Pore fluid pressure at the upper, lower, or surrounding boundaries is set to 0. All external surfaces of the model are constrained by normal displacement, and rigid body displacement is not allowed on the bottom surface of the model. A displacement constraint of zero in the Z direction is applied on the bottom surface. Moreover, in order to eliminate deformation on the upper surface, Kinematic rigid displacement constraint is applied to all nodes on the upper surface. The critical damage displacement of the Cohesive element is set to 0.001 m. The basic input parameters of the model are shown in Table 3 .
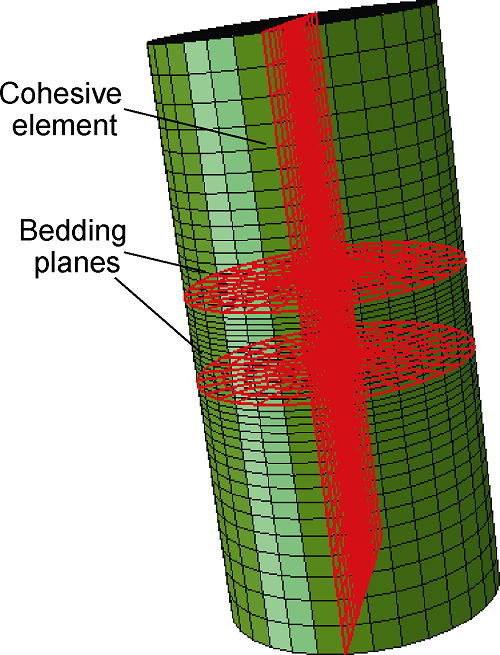
Fig. 6. 3D fracture propagation model of shale. |
Table 3. Basic input parameters of the model |
| Parameter | Value | Parameter | Value |
|---|---|---|---|
| Elastic modulus | 20 GPa | Filtration coefficient | 1.0×10⁻¹³ m2•s/kg |
| Poisson's ratio | 0.25 | Tensile strength of matrix | 2 MPa |
| Permeability coefficient | 1.0×10⁻⁷ m/s | Tensile strength of joint | 1 MPa |
The CO2 pre-pad generally remains in a supercritical state after entering into the formation, so the effects of supercritical CO2 and slickwater on fracture initiation and propagation were simulated and compared. As shown in Fig. 7 , the breakdown pressure of supercritical CO2 is significantly lower than that of slickwater. The maximum injection pressure of supercritical CO2 is 4.78 MPa, 36% lower than the breakdown pressure of slickwater which is 7.48 MPa. Low breakdown pressure helps to improve the complexity of fractures. The fracture width of supercritical CO2 fracturing is significantly smaller than that of slickwater fracturing. The maximum fracture width of supercritical CO2 fracturing is 7.2 mm, 58% smaller than that of slickwater fracturing which is 17.2 mm. The time for fracture to reach the boundary in the case of supercritical CO2 fracturing is significantly shorter than that of slickwater fracturing. After reaching the boundary, the growth of the fracture volume slows down greatly. The induced fracture during supercritical CO2 fracturing needs only 11.4 s to reach the model boundary, while the induced fracture during slickwater fracturing takes 25 s. The fracture in the supercritical CO2 fracturing is narrower than that in the slickwater fracturing, but it propagates faster. Additionally, the supercritical CO2 has strong diffusibility and zero interfacial tension, allowing it to easily filter along the bedding plane, which may induce shear failure of the bedding plane and thus increase the complexity of fractures. Overall, supercritical CO2 is more helpful to improve the fracture complexity than slickwater, but at the same time, it can reduce the fracture conductivity and fracture length. Such adverse impacts can be overcome by subsequent injection of slickwater.
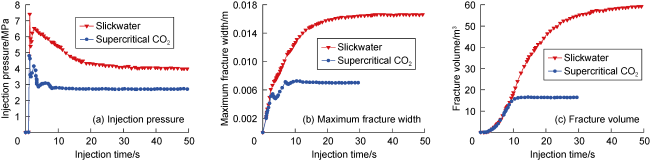
Fig. 7. Simulation results of fracture parameters in supercritical CO2 and slickwater fracturing. |
In order to simulate the influences of natural fractures on supercritical CO2, a 2D finite element model of fracture propagation in shale with supercritical CO2 fracturing was established using the ABAQUS software. A natural fracture auto-generation program was developed using Python language to randomly generate a primitive natural fracture system with a length of 2-10 m and a direction of 45° north by east. A pore pressure cohesive element with zero thickness was embedded inside the element to simulate the propagation path of induced fractures. In order to distinguish the difference in tensile strength between the matrix and the natural fractures, the cohesive element tensile strength of the matrix is set to be higher than that of natural fractures. Fig. 8 shows that supercritical CO2 fracturing induces fractures which cannot expand further along the original direction when encountering natural fractures, but may divert to other directions, further increasing the complexity. Fig. 9 reveals that the induced fractures propagate in a clear step-like pattern in reservoirs with natural fractures. This is mainly due to the extremely low viscosity of supercritical CO2, which makes it easier to open natural fractures. However, a certain pressure is required inside the fractures to overcome the tensile strength of the rock matrix for further propagation. Therefore, a high treatment rate should be chosen to improve fracturing efficiency when using supercritical CO2 as fracturing fluid.
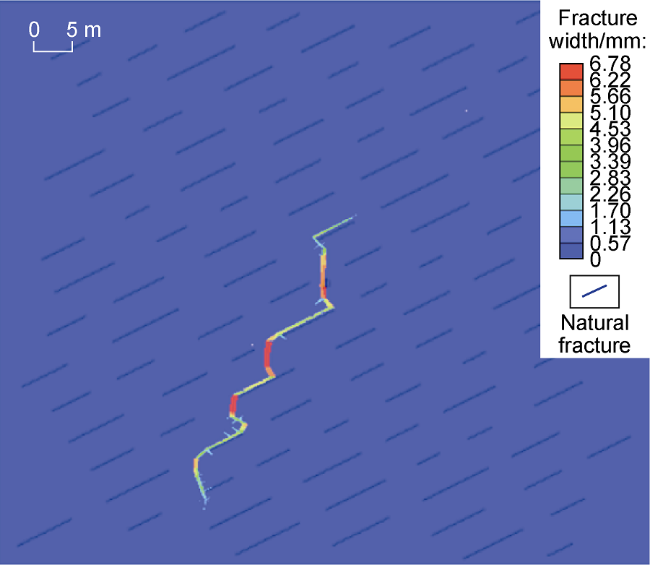
Fig. 8. Fracture geometry of reservoir with natural fractures after supercritical CO2 fracturing. |
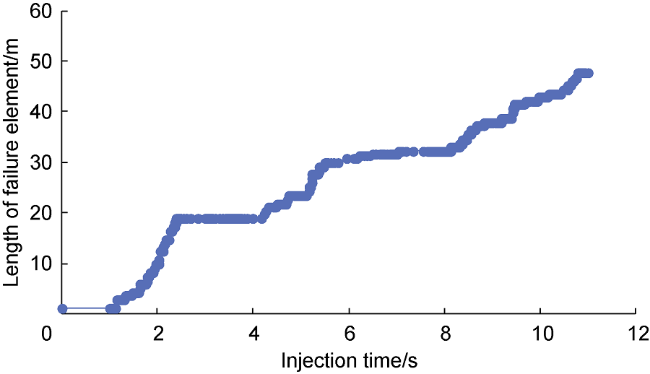
Fig. 9. Variation of length of failure element with time. |
3.2. Simulation of CO2 pre-pad injection for energy replenishment
CO2 pre-pad fracturing can efficiently replenish the reservoir energy, and also reduce the viscosity of crude oil and even produce a miscible effect, which helps to further improve the post-fracturing productivity and recovery of shale oil wells, especially in blocks with low formation pressure coefficients. CO2 pre-pad fracturing provides a new approach and guidance for achieving economic recovery in shale oil reservoirs with normal pressure coefficients. In practices, the volume of CO2 pre-pad determines the degree of energy replenishment and the sweep range, and its quantitative optimization is the focus of engineering design. Fracturing and reservoir simulation research was conducted using conceptual models, and an optimization method based on reservoir numerical simulation was established. Fracman and CMG simulation software were employed to achieve quantitative optimization of CO2 pre-pad volume.
The Meyer software was used to establish a reservoir fracturing conceptual model based on a geological model of laminated shale in the target block. The model has a grid size of 305×263×115 and a total grid volume of 2.039×10¹⁰ m3. The elastic modulus of the target reservoir is set to be 26.19-40.28 GPa, and the Poisson's ratio is 0.235-0.279, with an average of 0.257. The stress of the target reservoir is ranked in a descending order as vertical stress, maximum horizontal principal stress, and minimum horizontal principal stress. The maximum horizontal principal stress is 67.41-69.8 MPa, the minimum horizontal principal stress is 57.93-58.94 MPa, the stress gradient is 2.08-2.11 MPa/100 m, and the horizontal stress difference is 8.91-9.64 MPa. The rock exhibits the characteristics of moderate elastic modulus, high Poisson's ratio, and low mechanical brittleness index. A pumping procedure of high-viscosity liquid pre-pad, rapid pumping rate increase, and gel injection was adopted to simulate the effective extension pattern of fractures in the length direction through multiple rock types, so that the combination of fracturing treatment parameters is optimized. With a comprehensive consideration to the cost of fracturing treatment, a horizontal wellbore length is set to 2 000 m, and the number of fracturing clusters is optimized to around 200. The half-length of the fracture is 180-220 m, the fracture height is 20-30 m, the conductivity is 5 μm2·cm, the single- cluster fracturing fluid volume is 300-400 m3, and the proppant volume is 25-35 m3.
A corresponding reservoir numerical model was established based on the conceptual geological model. For the target reservoir, the pressure coefficient is 1.05-1.35, the effective porosity is 3.2%-6.9%, the gas logging permeability is (17.9-81.7)×10−9 μm2, the oil saturation is 48.4%-52.8%, the crude oil density is 0.860-0.864 g/cm3, and the crude oil viscosity is 18.2-32.6 mPa·s. The hydraulic fractures in horizontal wellbore are roughly coupled to the corresponding data field of the geological model through commercial software to achieve the characterization of the fracture system in the reservoir model, based on the optimized parameters such as fracture length, height, width, and conductivity. During fracturing operation, the pumping rates and injection volumes of CO2 pre-pad and water-based fracturing fluid are simulated according to the method of the injection well. Based on the above model, the changes of energy replenishment range and pressure coefficient are investigated under the single-stage CO2 pre-pad volumes of 25, 50, 75, 100, 150, 300, 450 and 600 t, respectively.
The change of energy replenishment range at different CO2 pre-pad volumes can be calculated by counting the number of grids with pressure changes greater than or equal to 1 MPa. At the same time, the average pressure coefficient after energy replenishment can be calculated by the average pressure change amplitudes in grids with energy replenishment. Analyzed from the calculation results (Fig. 10 ), the range of energy replenishment and the average pressure coefficient after energy replenishment both show an increase trend as the CO2 pre-pad volume increases. When the single-stage CO2 pre-pad volume exceeds 100 t, the growth of the pressure coefficient tends to slow down, and the increase of the energy replenishment range tends to slow down, but at a rate smaller than the pressure coefficient. Accordingly, when the CO2 pre-pad volume is lower than a certain amount, the increases in energy replenishment range and pressure coefficient are the dominant factors for efficiency enhancement; when the CO2 pre-pad volume is higher than a certain amount, the influence of pressure coefficient increase gradually decreases, and the dominant factor gradually becomes the increase in energy replenishment range. As indicated by the energy replenishment range curve, the turning point of the single-stage CO2 pre-pad volume is 100-150 t. When the CO2 pre-pad volume exceeds the turning point, the energy replenishment effect gradually increases, but at a declined rate. Whether to further increase the CO2 pre-pad volume needs to be determined through economic analysis.
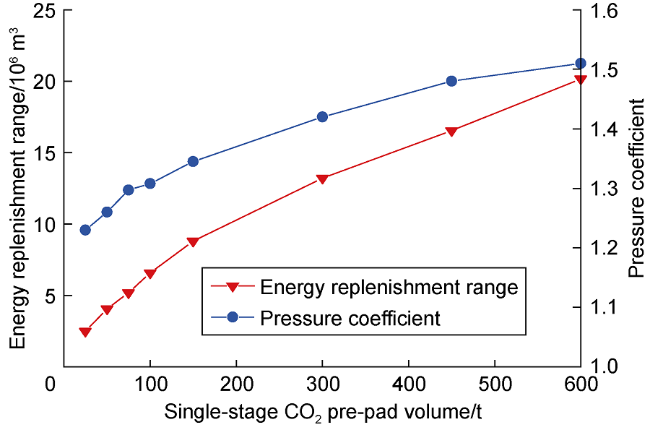
Fig. 10. Simulation of energy replenishment range and pressure coefficient changes with CO2 pre-pad volume. |
3.3. Effects of CO2 pre-pad volume on production
Through reservoir numerical simulation, the 10-year cumulative oil production of single well was predicted at different single-stage CO2 pre-pad volume (Fig. 11 ). When the single-stage CO2 pre-pad volume is less than 100 t, the 10-year cumulative oil production fluctuates slightly, and basically remains at about 3.75×10⁴ m3. It is considered that, during the post-fracturing production, with the pressure decreasing, a part of the injected CO2 is released from the crude oil, and an oil-gas-water three-phase flow zone is formed, which reduces the effective permeability of the oil phase and increases the flow resistance of the oil phase. When the CO2 volume is small, the energy replenishing effect and flow resistance are basically balanced, and the production enhancing effect is not obvious. When the single-stage CO2 pre-pad volume is greater than 100 t, the energy replenishing effect overrides the oil flow resistance in the three-phase flow zone, and the 10-year cumulative oil production increases gradually with the increase of CO2 pre-pad volume. If the potential risks such as asphaltene precipitation during CO2 injection are not considered [27], there is no obvious inflection point in the rising trend of 10-year cumulative oil production when the single-stage CO2 pre-pad volume exceeds 100 t. On the other hand, through the comparative analysis of the impact of CO2 pre-pad volume on daily oil production, it is found that the CO2 pre-pad volume mainly affects the early daily oil production, and the impact of CO2 pre-pad volume is basically ignored after more than one year of production. The optimized single-stage CO2 pre-pad volume should exceed 100 t, and the economic evaluation should be performed depending on the local CO2 price.
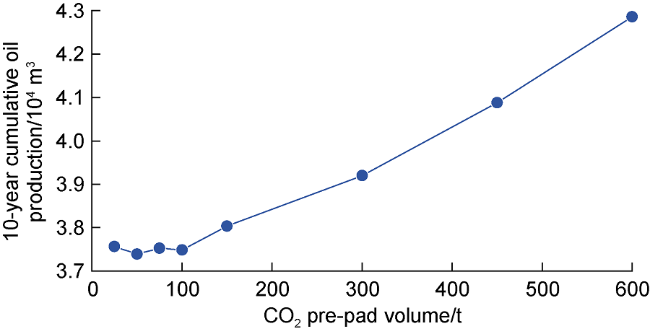
Fig. 11. Relationship between CO2 pre-pad volume and 10-year cumulative oil production. |
3.4. Field tests of CO2 pre-pad fracturing
CO2 pre-pad fracturing has been implemented in both shale gas wells and well groups in the Jiyang Depression, with ideal stimulation results obtained.
Well F159 is the first test well for CO2 pre-pad fracturing in the Jiyang Depression. Its single-stage CO2 pre-pad volume was 150 t. The well was put into production with small nozzle after backflow at 160 d of operation. When the cumulative oil production was 350 t, the tubing pressure remained at 6.7 MPa. When the cumulative oil production reached 2 000 t, the daily production rate kept stable at around 12 t, and the tubing pressure remained above 3 MPa, demonstrating a strong stable production capacity. The adjacent well F159-1 had the same operating horizon and pressure coefficient as Well F159, but it was not treated with the CO2 pre-pad fracturing technology. For well F159-1, when the cumulative oil production exceeded 350 t, the wellhead pressure was insufficient for oil flowing; thus, mechanical pumping was adopted. When the cumulative oil production reached 1 400 t, the well was shut down due to insufficient formation energy. It can be seen that the CO2 pre-pad fracturing is well performed in stimulation.
After the successful implementation of CO2 pre-pad fracturing in single wells, the technology was tested in a well group FYP1 in the Boxing subsag of the Dongying Sag in the Jiyang Depression. The shales in FYP1 are buried at 3 130-3 650 m, with a maturity of 0.74%-0.83%. The main lithofacies is organic-rich laminated argilla-ceous limy shale, and the carbonate content reaches 70%. Early tests revealed the challenges in, for instance, proppant injection and fracture height extension during fracturing in limy shale due to presence of beddings, varying physical properties in horizontal sections, and other factors. Therefore, the concept of CO2 pre-pad fracturing was fully incorporated into the fracturing design for FYP1. Eight horizontal wells in FYP1 were all treated by multi-stage subdivided volumetric fracturing. The CO2 pre-pad volume was 100-300 t per stage, 2 500-7 000 t per well, and 4.1×10⁴ t in the well group. Other wells fractured early in this area were not treated using CO2 pre-pad, and demonstrated the fracture pressure of 81-90 MPa and the average stimulated reservoir volume (SRV) of 39.0×10⁴ m3 per stage. In contrast, FYP1 employing CO2 pre-pad fracturing exhibited the fracture pressure of 74-77 MPa and the average SRV of 41.2×10⁴ m3 per stage, which are 7-13 MPa lower and 2.2×10⁴ m3 higher than those of early wells. After coming into production, FYP1 achieved a peak daily oil production of single well up to 171 t. By February 2024, its cumulative oil production reached 13.7×10⁴ t.
From 2020 to 2023, 57 horizontal shale oil wells in the Jiyang Depression were treated with CO2 pre-pad fracturing, with 32.5×10⁴ t CO2 injected totally. Particularly, 21 wells achieved a peak daily oil production of over 100 t, and 19 wells witnessed the cumulative oil production surpassing 5×10⁴ t. It is proved that the CO2 pre-pad fracturing technology allows for effective stimulation of shale oil reservoirs in the Jiyang Depression, which are characterized by deep burial, high formation pressure, high lime content, high fracture pressure, and difficulty in vertical fracture propagation. In detail, CO2 functions for lime dissolution to expand the pore space, modification to increase fractures, dissolution to reduce the viscosity, swelling to replenish energy, and diffusion to displace oil, which will effectively reduce the fracture pressure, increase the SRV and enhance the fracture connectivity, ultimately improving crude oil fluidity and formation energy.
4. CO2 huff-n-puff for energy replenishment simulation and field test
For the development of shale oil in the Jiyang Depression, the simulation and field test of CO2 huff-n-puff for energy replenishment in single well were carried out to optimize the key technical parameters of CO2 injection for enhancing shale oil recovery.
4.1. Numerical simulation of CO2 huff-n-puff for energy replenishment
The component model was used to describe the fluid phase behaviors, and the embedded discrete fracture model was constructed to characterize the fracture network created by multi-stage fracturing. The numerical simulation model is 1 700 m×370 m×43 m in size, with 170×37×1 grids. The model contains 30 equally-spaced induced fractures (Fig. 12 ), as well as microfractures randomly generated. The shale oil reservoir has the matrix porosity of 5%, the induced fracture half-length of 150 m, the induced fracture permeability of 10 μm2, and the microfracture permeability of 500×10−3 μm2. It was assumed that CO2 huff-n-puff is initiated at the 8th year of elastic development, with a huff-n-puff cycle of 1 year, an injection time of 60 d, an injection rate of 200 t/d, and a soaking time of 30 d.
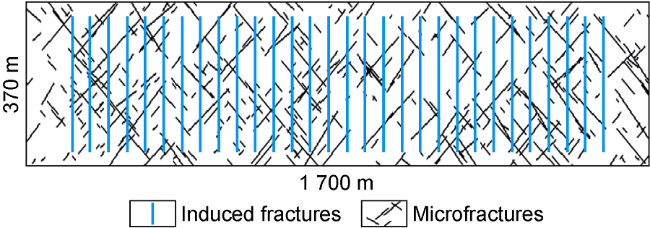
Fig. 12. Numerical simulation model for multi-stage fracturing of shale oil reservoir. |
Based on the model above, and given the formation pressure of 45 MPa and C11+ content of 25% in shale oil, three models were designed with different matrix permeability (0.001×10⁻³, 0.005×10⁻³ and 0.02×10⁻³ μm2) to simulate the development effects of elastic development and CO2 huff-n-puff. Fig. 13 compares the pressure field distribution under the two development modes. It can be seen that the reservoir pressure after CO2 huff-n-puff is significantly higher than that after elastic development, indicating a remarkable effect of CO2 injection for replenishing the formation energy. Such effect is varying at different matrix permeabilities of shale reservoirs. The lower the matrix permeability, the higher the reservoir pressure and the more the remaining oil at the later stage of development. As to EOR effect, the recovery is increased by 1.05, 1.42, and 1.55 percentage points, respectively, for the models in a descending order of matrix permeability. This suggests that the lower the matrix permeability, the greater the improvement in recovery.
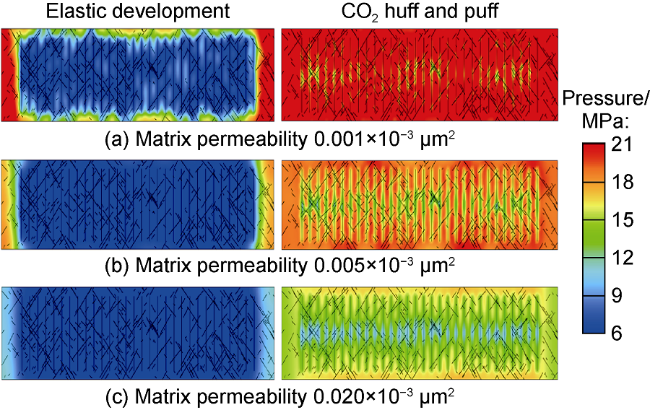
Fig. 13. Pressure distribution of shale oil reservoirs with different matrix permeabilities. |
Based on a model with a matrix permeability of 0.02×10⁻³ μm2 and a C11+ content of 25%, the formation pressure was set at 30, 35, 40, and 45 MPa respectively to simulate the ultimate recovery under the modes of elastic development and CO2 huff-n-puff. As shown in Fig. 14 , for shale oil reservoir with low pressure, the production degree is low under the elastic development mode, and the increase in recovery is greater under the CO2 huff-n-puff mode. Essentially, the higher formation pressure corresponds to larger elastically recoverable reserves, leading to a greater degree of production in the elastic development stage and leaving less recoverable reserves. Therefore, the extent of improvement in recovery in the CO2 huff-n-puff stage is limited.
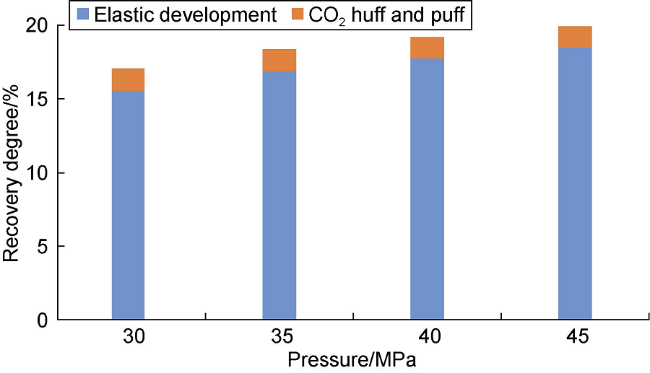
Fig. 14. Impact of formation pressure on recovery of shale oil by CO2 huff-n-puff. |
Based on a model with a matrix permeability of 0.02× 10⁻³ μm2 and a formation pressure of 45 MPa, the C11+ content was set at 25%, 30%, and 35%, respectively, to simulate the ultimate recovery under the modes of elastic development and CO2 huff-n-puff. As shown in Fig. 15 , crude oil with a higher C11+ content exhibits a lower recovery and larger remaining recoverable reserves under the mode of elastic development, due to relatively high viscosity and high resistance to oil-phase flow. After CO2 huff-n-puff is implemented, the mobile crude oil reserves are significantly increased through viscosity reduction, volume expansion, extraction, and miscibility, ultimately resulting in a substantial increase in the recovery.
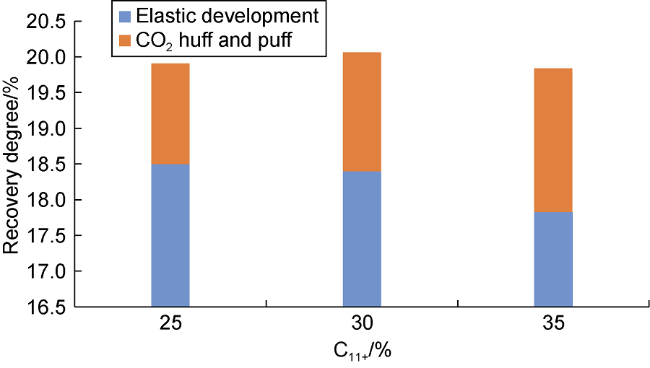
Fig. 15. CO2 huff-n-puff effects in shale oil reservoirs with different crude oil compositions. |
4.2. Field test of CO2 huff-n-puff in single well
Since 2019, field test of CO2 huff-n-puff has been con-ducted in four slant wells in two types of shale oil reservoirs in Shengli Oilfield, China: the depression-stable shale oil reservoirs in the Niuzhuang Depression, and the complex fault-block shale oil reservoirs in the Boxing Depression.
Well GX26 was the first for CO2 huff-n-puff test in the Niuzhuang Depression. The well encountered the 3th zone in the pure upper submember to the pure lower submember of the fourth member of Shahejie Formation of Paleogene (Es4cs-3-Es4cx). Shales in this interval are 51 m thick, with a mid-depth of 3 380 m, and the maturity of 0.64%. During the two-stage fracturing, 320 t CO2 and 2 382.7 m3 fracturing fluid were injected in the entire wellbore, and 65.4 m3 proppant was injected. During the flowing stage, the peak daily fluid production was 46 m3, the peak daily oil production was 27.5 t, and the peak water cut was 40.2%. After the cumulative fluid production reached 1 784 m3, oil production was implemented by pumping instead of flowing. Production continued with low fluid rate and low water cut for a long time, corresponding to an average daily fluid production of 3.3 m3, an average daily oil production of 2.3 t, and an average water cut of 30%. When the huff-and-puff test was conducted, the cumulative fluid production already reached 5 954 m3. Assuming that the formation pressure was restored to the post-fracturing level (pressure coefficient 2.0), the CO2 injection was designed with a huff-n-puff volume of 2 700 t and a rate of 100 t/d. After CO2 injection, 50 m3 water was injected to prevent CO2 spillover. After the operation, the actual CO2 injection time and volume were 26 d and 2 724 t, respectively. Upon the injection, the formation pressure coefficient increased from 1.4 to 2.1, effectively replenishing the formation energy. After the well was put into production, the initial wellhead tubing pressure was 34 MPa. After stable flowing, the CO2 huff-and-puff effectively facilitated the enhanced oil recovery and the water cut reduction, with the daily fluid production increased to over 6 t, and the water cut dropped to 2% and remained stable. During the plateau period, the daily oil increment reached 6 t. Moreover, ground sampling showed significant changes in fluid properties. The crude oil density decreased from 0.893 1 g/cm3 to 0.840 2 g/cm3, and the viscosity of the crude oil at 50 °C decreased from 28.7 mPa·s to 7.37 mPa·s. After the injection of CO2, the crude oil fluidity improved significantly.
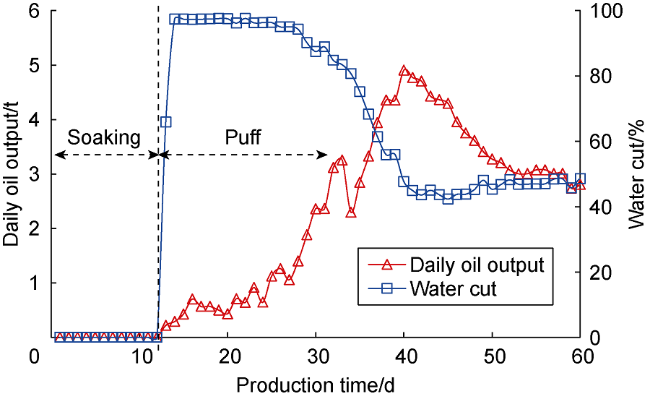
Well F159-1 was the first for CO2 huff-and-puff test in the Boxing Depression. This well encountered Es4cs, where the shales are 51 m thick with a mid-depth of 3 185 m. During the two-stage fracturing, 600 t CO2 and 23 131.9 m3 fracturing fluid were injected in the entire wellbore, and 137.9 m3 proppant was injected. When the cumulative fluid production was 2 417 m3 and the cumulative oil production was 1 012 t in the flowing stage, the wellhead tubing pressure was only 0.8 MPa. It was decided to conduct the CO2 huff-and-puff test before the well stopped flowing. The designed CO2 huff-and-puff volume was 4 000 t, with an injection rate of 100 t/d, followed by 200 m3 water injected to prevent CO2 spillover. It was calculated that the formation pressure coefficient could be restored to around 1.8. During the test, the pump pressure was 26.73 MPa and the daily injection rate was 80 t in the early stage of CO2 injection. At 10 d, the pump pressure increased to 29.1 MPa, and the daily injection rate dropped to only 9 t. Due to the limitation of casing pressure, a total of 881 t CO2 was injected. To improve the energy replenishment effect, an additional water slug of 2 016 m3 was injected, and the well was shut in for 133 d. When the wellhead tubing pressure slowly decreased from 25.5 MPa to 20.29 MPa, fluid drainage began. The daily oil production steadily increased from 1.0 t before the CO2 injection to 4.8 t, and then gradually decreased. Before the huff-and-puff operation, the water cut of the well was 65%. After soaking and putting into production, the water cut quickly rose to around 98%. As the oil production continued to increase, the water cut gradually decreased to around 45% after approximately half a month, indicating an effective extension of the flowing period (Fig. 16 ). The increase in production was very significant.
Fig. 16. CO2 huff-n-puff production of Well F159-1. |
5. Conclusions
NMR tests demonstrate that the CO2 huff-n-puff performance is sensitive to micro- and nano-scale effect, kerogen, and adsorbed oil. A somewhat longer soaking time can lead to a higher production degree of shale oil. In the huff stage, the production degree of heavy hydrocarbons is enhanced by CO2 through its effects of solubility-diffusion and mass-transfer. In the puff stage, CO2 is carried to surrounding larger pores or bedding fractures.
The injection of CO2 pre-pad is conducive to keeping the rock brittle, reducing the fracture pressure, and ensuring the CO2 filtration along the bedding surface, so that a more complex fracture network is created. Increasing the CO2 pre-pad volume can improve the energy replenishment effect. In addition, CO2 huff-n-puff enables a greater increase in recovery in shale reservoirs with lower matrix permeability, lower formation pressure, and larger heavy hydrocarbon content.
Field tests show a good pressure retention after CO2 pre-pad fracturing. The CO2 huff-n-puff in single well can effectively replenish the formation energy to improve the crude oil mobility, so that the natural flowing period is extended, and the productivity of a single well is enhanced.
Acknowledgments
We sincerely thank WANG Peng and LYU Chaohui with Sinopec Petroleum Exploration and Production Research Institute, HAN Wencheng and LIU Yan with Exploration and Development Research Institute of Sinopec Shengli Oilfield Company, and ZUO Luo with Sinopec Research Institute of Petroleum Engineering Co., Ltd. for their assistance in literature review, laboratory experiments, numerical simulations, field tests, and English translation, etc.