

Introduction
Calcite veins are widely developed in organic matter-rich shales [1⇓⇓-4], and they have been paid much attention due to containing important information about fluid overpressure, paleo-stress, rock deformation mechanics, organic and inorganic geochemical reaction, and hydrocarbon generation and expulsion related to shale [5⇓-7]. According to the structure, morphology, and arrangement, calcite veins are stretched, blocky and fibrous (calcite beef) [8]. Stretched calcite veins are stretched in stages, and the crystals go through the whole vein with serrated boundaries [9]. Blocky calcite veins are formed in a competitive environment, and the crystals are in bladed shapes because the competitiveness is gradually weak in the crystal growth direction [2]. Fibrous calcite veins are formed in an environment without competition, the width of the veins does not increase obviously in the crystal growth direction, and the aspect ratio is large. The formation process is not limited by the normal growth theory of mineral crystals [9]. Based on the growth direction, calcite veins can be divided into stretched, syntaxial, and antitaxial types [1]. Stretched veins are formed by the repeated opening and closing of fractures with vein- forming fluids in surrounding rock. The vein-forming minerals of syntaxial veins grow from surrounding rock to the middle fractures. They can be divided into symmetrical and asymmetrical types. The growth interface of the former is in the middle of the vein, and the vein- forming materials continuously precipitate on both sides of the growth interface. The growth interface of the latter is on one side of the vein, and they grows asymmetrically[8]. Antitaxial veins grow from the middle (zone or line) to the surrounding rock, and there are two interfaces for simultaneous growth [1,10]. There are two main explanations about the growth mechanism of calcite veins. One is crack-seal mechanism [11-12], used to explain the growth of stretched calcite veins, and the other is the force of crystallization [13], used to explain the growth of antitaxial fibrous calcite veins. In addition, some scholars put forward a biogenic growth mechanism [14-15].
Calcite veins are widely distributed in shale reservoirs in marine and continental basins in China, especially in the Jiyang Depression of the Bohai Bay Basin [5,16], the Dongpu Depression [17], the Biyang Depression of the Nanxiang Basin [18], the Jurassic of the Sichuan Basin [19], and the Longmaxi Formation of the Lower Silurian in the southern Sichuan Basin [6]. Some researchers believe that calcite veins are the symbol of high-TOC shale reservoirs [16], and their formation is closely related to hydrocarbon generation and expulsion of source rocks as well as fluid overpressure [20]. In addition, the formation of calcite veins is related to deep hydrothermal processes [21]. The Upper Cretaceous Qingshankou Formation in the Gulong sag of the Songliao Basin is rich in shale oil resources, with total geological resources up to 150×108 t, and showing a huge shale oil potential [22-23]. Through centimeter-level core observation, it is found that calcite veins are relatively developed in shale reservoirs of the Qingshankou Formation, and different types of calcite veins have great differences in macro- and micro-structures. At present, the genetic mechanism of various calcites is still unclear, and the relationship between the formation of calcite veins and multi-stage oil and gas accumulation is still unclear. Taking the Qingshankou Formation in the Songliao Basin as a case, this study investigates the genetic mechanism of calcite veins in the organic-rich shale through core observation, thin section analysis, cathodoluminescence (CL), laser Raman, fluid inclusion microthermometry, and in-situ LA-ICP-MS U-Pb dating, and reveals the relationship between calcite veins and oil accumulation, with the intent to provide enlightenment for oil and gas accumulation mechanism.
1. Geological setting
The Songliao Basin located in northeast China is a large Mesozoic-Cenozoic continental petroliferous basin with a fault-depression dual structure, and covering an area of 26×104 km2. The formation of the Songliao Basin was influenced by the superposition of three tectonic domains: Paleo-Asian Ocean, Mongolia-Okhotsk Ocean, and Paleo-Pacific Ocean [24]. Due to the subduction of the western Pacific plate to the Eurasia continent, the Tan-Lu fault zone underwent a large-scale horizontal displacement (about 100 Ma to 125 Ma), forming a huge inland lake. After the subduction-collision orogeny of the Siberian plate and the North China plate from the Early Jurassic to the Early Cretaceous, a series of NE and NNE-trending fault depression basins, e.g., Amur-Zeya, Songliao, Hailar, Erlian basins, and volcanic uplifts, e.g., Great Xing'an and Zhangguangcai ranges, developed in northeastern China (Fig. 1a ). The Songliao Basin, generally NNE-SSW trending, ~370 km from east to west, and ~750 km from north to south, is to the Nenjiang-Balihan detachment fault zone and the Great Xing'an Range in the west, the Xunke-Tieli fault and the Xiao Xing'an Range in the north, the Yilan-Yitong fault and the Zhangguangcai Range in the east, and the Yinshan-Yanshan orogenic belt in the south [25]. According to the tectonic and geological characteristics of the middle and shallow formations, and considering the deep structure and basement, the basin is divided into seven first-order tectonic units: i.e., a northern plunge, a northeastern uplift, a western slope, a central deep depression, a southeastern uplift, a Kailu Depression, and a southwestern uplift [24] (Fig. 1b ). The study area located in the central deep depression covers three secondary structural units: the Qijia-Gulong sag, the Daqing anticline and the Sanzhao sag from east to west (Fig. 1c ).

Fig. 1. Structural location (a), structural units (b) and well locations in the study area (c) in the Songliao Basin. |
The basement of the Songliao Basin is mainly composed of Paleozoic metamorphic and volcanic rocks. The caprock sediments from the Cretaceous to the Quaternary is about 10 000 m thick, and of which the Cretaceous accounts for more than two thirds (Fig. 2 ). The Cretaceous is the primary oil and gas bearing strata in the Songliao basin. According to the geometric and kinematic characteristics, the structural evolution of the Songliao Basin is divided into three stages: rifting, depression and tectonic inversion [24] (Fig. 2 ), creating a series of extensional, compressional and reversal structures [22]. The Lower Cretaceous is divided into Huoshiling, Shahezi, Yingcheng, Denglouku, and Quantou Formations from bottom to top (Fig. 2 ). The lithology is mainly conglomerate, glutenite, sandstone and argillaceous siltstone. Coal seams are locally distributed in the Shahezi Formation, and the sedimentary facies include alluvial fan, fan delta, river and shallow lake (Fig. 2 ). The Upper Cretaceous is divided into Qingshankou, Yaojia, Nenjiang, Sifangtaizi, and Mingshui Formations from bottom to top. The lithology is mainly mudstone, shale, fine sandstone and glutenite, and the sedimentary facies include deep lake, shallow lake, delta and meandering river. During the sedimentation of the Qingshankou Formation and the Nenjiang Formation, large-scale lacustrine invasion occurred, and thick mud shale and oil shale deposited, which are high-quality source rocks. At the same time, intermittent transgression occurred [26]. The target layer of this study is the Qingshankou Formation which can be divided into Qing 1 (K2qn1), Qing 2 (K2qn2), and Qing 3 members (K2qn3) from bottom to top (Fig. 2 ). The average thickness of the Qingshankou Formation is ~400 m, and shale is dominant, with an average thickness of more than 80 m. In addition, fine sandstone, siltstone, ostracod limestone, dolomite, and tuff are found in the Qingshankou Formation.

Fig. 2. Schematic stratigraphic column of the Songliao Basin (modified from Reference [4]). |
2. Samples and methods
In this study, 10 shale oil wells in northern Songliao Basin were carefully observed, including wells X7, X8HC, X58, X2HC, X3HC, X34, X37, X2911, X21 and Zy1 (Fig. 1c ), and 20 calcite vein samples were collected. The samples were analyzed by thin section, CL, laser Raman, microthermometric analysis of fluid inclusions, and in-situ LA-ICP-MS U-Pb dating. Twenty thin sections of calcite veins were examined using a Leica DM2700P high-precision microscope. The mineral composition and diagenetic stages were observed on 15 samples using an Axio Scope.Al/CL8200 MK5 CL microscope. Laser Raman analysis was done on the solid inclusions within calcite veins using a LabRam HR spectrometer. The wavelength was 532 nm, the objective lens was 50X, the spot size was 2 μm, the laser power was 12 mW, the line width was less than 0.1 nm, the exposure time was ~10 s, and the spectra ranged from 150 to 4 000 cm-1.
Ten calcite vein samples were used for fluid inclusion analysis. The samples were first made into thin sections, and then the petrographic characteristics, types, sizes, shapes, and distribution characteristics of fluid inclusions were observed using a Leica DM2700P high-precision microscope, and the suitable inclusions were selected for testing homogenization temperatures (Th). The Th of inclusions was measured on a LINKAM THMS600 heating-cooling stage. The heating rate was 10 °C/min at temperature lower than 80 °C, and 5 °C/min at temperature higher than 80 °C. The precision of Th analyses was ±1 °C. In addition, the data of whole rock X-ray diffraction (XRD), organic carbon content (TOC), rock-eval pyrolysis, and vitrinite reflectance (Ro) used in this study were provided by the Exploration and Development Research Institute of PetroChina Daqing Oilfield Company.
Two calcite vein samples were used for in-situ LA-ICP-MS U-Pb dating analysis [27], using RESOLution LR-S155 and Thermo Fisher iCAP (ICP-MS), in Sichuan Chuangyuan Weipu Analytical Technology Co., Ltd. The samples were firstly cast with epoxy resin and made into sample targets with a diameter of 2.5 cm, then the sample targets were polished and cleaned with ionized water in an ultrasonic cleaning instrument for about 4 h. The calcite vein samples were ablated at 10 Hz, 3 J/cm2 and a beam spot diameter of 200 μm using helium as a carrier at a flow rate of 0.35 L/min. For each sample, the acquisition of background data lasted 20 s, laser ablation lasted 30 s, and washing operation was 7 s. Every after 6 sample spots, standard samples were tested. NIST614 was used to correct the sensitivity of the instrument and the value of 207Pb/206Pb [28]. Main standard sample AHX-1 (209.8±1.3 Ma), monitoring standard samples LD-5 (72.83±0.57 Ma) and PTKD-2a (152.4±2.7 Ma) were used to correct the value of 238U/206Pb [29]. The data were processed with the Iolite software v3.71. The U-Pb ages were determined using Isoplot/EX v3.75 with regression on Tera-Wasserburg Concordia plots [30].
The burial and thermal history in typical wells in the study area was analyzed using BasinMod-1D. The lithology and geothermal data were obtained from logging data. The formation age, denudation thickness and stages were adapted from references [31-32]. The calculated present geothermal heat flow value is 84.0 mW/m2 in the Qingshankou Formation through calculation [31]. Thermal maturity simulation was performed using the Easy% Ro method.
3. Experiment results
3.1. Petrological and geochemical characteristics of Qingshankou Formation shale
XRD data show that the mineral composition in the Qingshankou Formaiton shale includes mainly quartz, feldspar and clay (Fig. 3 ). The average contents of quartz, feldspar and clay minerals are 33.5%, 17.5% and 34.8% respectively. In addition, there are some carbonate minerals, including calcite and dolomite, 6.5% and 1.0% on average, respectively. Felsic, clay and ostracod laminae are found in the shale (Fig. 4a -4c ). Some ostracod shells are relatively complete and distributed disorderly (Fig. 4a ), and others are broken into thin layers (Fig. 4b -4c ). Some felsic particles are good laminae, and others have been liquefied into sand balls as well as pillows (Fig. 4c ). Through core observation, it is found that besides bedding fractures, the Qingshankou Formation shale also has many interlayer sliding structures caused by lateral compression, such as slickensides (Fig. 4d -4e ), on which there are obvious steps, scratches, small conjugate shear faults, and small negative grabens and horsts (Fig. 4f ). The TOC of the shale is 0.8%-6.7%, with an average of 2.2%. The volatile hydrocarbon content (S1) is 0.8-8.3 mg/g, with an average of 2.6 mg/g, indicating a good hydrocarbon generation potential [4]. The Ro ranges from 1.1% to 1.7%, with an average of 1.37%, indicating the shale is in the middle to high maturity stage [4].

Fig. 3. Ternary diagram of minerals in Qingshankou Formaiton shale. |

Fig. 4. Mineral composition and typical microstructures of Qingshankou Formation shale. (a) Ostracod limestone in Qingshankou Formation shale; 2 096.51 m; Well X58; plane-polarized light; (b) clay laminae and ostracod laminae; 2 432.20 m; Well X3HC; cross-polarized light; (c) mixed deposits of clay, felsic minerals, and ostracod shell clastic in shale; 2 454.00 m; Well X3HC; plane-polarized light; (d) slickensides in shale (the red arrow indicates the sliding direction); 2 526.28 m; Well X7; (e) slickensides with steps (yellow arrows), the red arrow indicates the sliding direction; 2 491.60 m; Well X3HC; (f) the micro-horst formed by low-angle conjugate shear, with smooth surfaces on both sides (the red arrows indicate the shear direction); Well X7; 2 484.70 m. |
3.2. Macro- and micro-structures of calcite veins
Calcite veins in the Qingshankou Formation shale are relatively developed (Fig. 5 ), and generally 1 mm to 5 cm thick. Most veins are along beddings (Fig. 5a ), and a few are inclined at a high angle or nearly upright (Fig. 5b ). According to their intersection, bedding calcite veins are attributed to stage I, while inclined or nearly upright ones are stage II (Fig. 5b ). Some calcite veins are lenticular (1, 2 and 3 in Fig. 5a ), and others show an “S” shape (Fig. 5b ), a cone-in-cone structure (Fig. 5c ), or a complex wispy and branching network (Fig. 5e ). Fibrous calcite veins generally have a median zone (Fig. 5d ), and the crystals grow from the median zone to the host rock. They are not always vertical, but incline to some degrees, and the calcite lattice does not bend or incline (Fig. 5d ). In addition, some bedding calcite veins show a pinnate structure, and the single calcite vein has been cut into a "S" shape (red marks in Fig. 5e ).

Fig. 5. Macrostructures of the calcite veins in Qingshankou Formation shale (σ1—maximum principal stress; σ3—minimum principal stress). (a) Bedding calcite veins, three lenses (Nos. 1, 2, 3) were developed at the top of the picture, and stress shadows were observed; 1 861.40 m; Well X2911; (b) bedding and inclined calcite veins; 1 579.81 m; Well X37; (c) cone-in-cone structure in bedding calcite veins; 1510.32 m; Well X37; (d) bedding calcite veins with fibrous crystals; 1 526.35 m; Well X37; (e) pinnate bedding calcite veins, and single calcite veins cut into a "S" shape; 2 276.82 m; Well X34; plane-polarized light. |
From the microstructure observation, the calcite veins in the study area can be divided into two types: syntaxial (Fig. 6a ), and antitaxial (Fig. 5d ). The syntaxial veins grow from the host rock to the middle, and the crystals are dentate. Unfilled cracks can be seen in the middle of the veins (Fig. 6a ), the width of the massive crystals gradually increases from the host rock to the middle, and the crystal particles are small and dense near the host rock (the red box in Fig. 6b ), indicating a competitive growth environment. The crystals of the antitaxial veins may be fibrous (Fig. 5d ) or columnar, with e-twins visible in the columnar crystals (Fig. 6c ). Fibrous calcite veins are in a cone-in-cone shape due to solid inclusions (Fig. 6d ), and show orange and bright yellow luminescence (Fig. 6e ). Raman analysis of solid inclusions in the calcite veins shows that the spectra are dominated by first-order bands, and the D peak is 1 339.07 cm-1, and the G peak is 1 590.62 cm-1, indicating the characteristics of solid bitumen (Figs. 6f and 7 ).

Fig. 6. Microstructures of the calcite veins in Qingshankou Formation shale. (a) Syntaxial calcite veins grow from the host rock to the middle; cone-in-cone; 2 443.31 m; Well X851; plane-polarized light; (b) syntaxial calcite veins, two stages, and the width of crystals gradually increases from the host rock to the middle; 2 053.02 m; Well Zy1; cross-polarized light; (c) columnar calcite veins with e-twins; 1 660.00 m; Well X21; cross-polarized light; (d) fibrous calcite veins in a cone-in-cone shape and with ostracod fragments (red arrows); 1 509.12 m; Well X37; plane-polarized light; (e) fibrous calcite veins in orange and bright yellow; 1 509.12 m; Well X37; (f) Raman test point of calcite vein solid inclusions; 2 276.57 m; Well X34. |

Fig. 7. Raman spectral characteristics of calcite vein solid inclusions in |
3.3. Petrography and homogenization temperature of fluid inclusions
The fluid inclusions in the calcite veins include aqueous and hydrocarbon ones (Fig. 8 ). The aqueous inclusions in blocky calcite veins are liquid, elliptical, and 2-5 μm (Fig. 8a ). No fluorescence was shown under ultraviolet (UV) light.

Fig. 8. Petrography of aqueous and hydrocarbon fluid inclusions in calcite veins. (a) Aqueous inclusions in blocky calcite veins; 2 255.17 m; Well X7; (b) hydrocarbon fluid inclusions in blocky calcite veins (red arrows); 1 658.02 m; Well X21; (c) hydrocarbon fluid inclusions in blocky calcite veins (red arrows) show blue-green fluorescence; 1 658.02 m; Well X21; (d) aqueous inclusions in fibrous calcite veins; 1 893.95 m; Well X6; (e) hydrocarbon fluid inclusions in fibrous calcite veins (red arrows); 2 445.53 m; Well X7; (f) hydrocarbon fluid inclusions in fibrous calcite veins show blue-white fluorescence (red arrows), moderate luminous intensity; 2 445.53 m; Well X7. |
Hydrocarbon fluid inclusions are liquid or vapor-liquid at room temperature, distributed in groups, colorless or light-colored under plane-polarized light, and exhibit green or blue fluorescence under UV light. Most of them are oval, and a few are irregular, with a length of 3-50 μm (Fig. 8b -8c ). The aqueous inclusions in fibrous calcite veins are liquid, with a length of 3-10 μm (Fig. 8d ), and they have no fluorescence under UV light (Fig. 8f ). Hydrocarbon inclusions are also liquid and exhibit blue-white fluorescence under UV light (Fig. 8f ). The alignment direction of aqueous inclusions is consistent with the growth direction of fibrous crystals, and they are primary origin (Fig. 8d ). Isolated inclusions on some calcite crystals are also primary origin (Fig. 8e ).
The homogenization temperature (Th) of aqueous inclusions in blocky calcite veins is 132.5-145.1 °C, with an average of 136.2 °C, and the distribution interval takes the integer as 130-150 °C. The Th of aqueous inclusions in fibrous calcite veins is 141.2-157.4 °C, with an average of 151.9 °C, and the distribution interval takes the integer as 140°C to 160 °C (Fig. 9 ).

Fig. 9. Histogram of Th of inclusions in calcite veins. |
The Th of the hydrocarbon inclusions is lower than that of the aqueous. The Th of the hydrocarbon inclusions in blocky calcite veins is mainly 70.2-83.2 °C, with an average of 76.5 °C, while the Th of fibrous calcite veins is mainly 81.5°C to 106.8 °C, with an average of 102.3 °C (Fig. 9 ).
3.4. In-situ LA-ICP-MS U-Pb dating
On the basis of in-situ analysis of trace elements in calcite micro-areas, the points with a large ratio of 238U/206Pb and a relatively low content of 206Pb were selected for U-Pb test. The number of test points in each sample was at least 100. In-situ LA-ICP-MS U-Pb dating showed that sample 1 is blocky calcite veins (Fig. 10a ) whose U-Pb lower intercept age is (69.9±5.2) Ma, and MSWD (mean square weighted deviation) is 2.2 (Fig. 10b ). Sample 2 is fibrous calcite veins (Fig. 10c ) whose U-Pb lower intercept age is (44.7±6.9) Ma, and MSWD is 1.9 (Fig. 10d ). Low MSWD values indicate that the calcite veins were formed in a closed U-Pb isotope system and not influenced by post-crystallization.

Fig. 10. Sample characteristics of in-situ LA-ICP-MS U-Pb dating and Tera-Wasserburg Concordia plots. (a) Distribution of test points on blocky calcite veins; Qing1 Member; 1 902.26 m; Well X6; (b) Tera-Wasserburg Concordia plot of U-Pb dating; Qing1 Member;1 902.26 m; Well X6; (c) distribution of test points on fibrous calcite veins; Qing1 Member; 1 663.50 m; Well X21; (d) Tera-Wasserburg Concordia plot of U-Pb dating; Qing1 Member; 1 663.50 m; Well X21. |
4. Discussion
4.1. Timing of calcite vein formation
Fluid inclusions in calcite veins contain important information about vein forming time [5], and the Th of aqueous inclusions associated with hydrocarbons represents the minimum capture temperature [33-34]. The Th of aqueous inclusions in blocky calcite veins is 130-150 °C. Combined with the burial curves and thermal model, it can be concluded that the blocky calcite was formed in the Late Cretaceous, about 69-75 Ma (Fig. 11 ). The Th of aqueous inclusions in fibrous calcite veins is 140-160 °C, they were formed about 21 Ma at the latest, corresponding to the Middle to the Late Paleogene (Fig. 11 ).

Fig. 11. Burial history, thermal evolution model and simulated Ro in the Qijia-Gulong sag (Well X7), northern Songliao Basin. |
In-situ U-Pb dating can accurately determine the age of calcite veins. The ages of the calcite veins are (69.9±5.2) Ma and (44.7±6.9) Ma, which are obviously younger than the age of the wall shale (the sedimentary period of the Qingshankou Formation is 86.303-91.816 Ma [35]). The age of the blocky calcite veins (69.9±5.2) Ma corresponds to the Mingshui Formation of the Late Cretaceous, and the age of the fibrous calcite veins (44.7±6.9) Ma corresponds to the Yi'an Formation of the Paleogene (Fig. 2 ).
4.2. Genetic mechanism of calcite veins
The genesis of calcite veins in shale has been widely studied and discussed all over the world [12⇓⇓-15,36]. Besides chemical genesis, some scholars put forward biogenic genesis [14-15] and microbial genesis [8]. Biogenic genesis believes that bedding calcite veins are formed by algae biological layers or algae mats [14]. Microbial genesis is proposed because 1 μm microbial fossils were found in calcite veins [8]. Based on mineralogy, petrology and geochemistry, the formation of calcite veins in the study area is related to diagenesis and hydrocarbon generation. It has gone through three stages: fractures opening, calcite vein-forming fluids filling, and calcite veins growing.
4.2.1. The opening of horizontal fractures
Vertical or highly inclined fractures are rare in shale, but common in limestone or sandstone, because shale has low stiffness. Under the same lateral tensile conditions, the tensile stress inside shale is small, therefore, vertical fractures are not easy to form [37]. Normally, overlying gravity is the maximum principal stress. To induce horizontal fractures, there must be an external force to overcome the gravity and reverse it to the minimum principal stress. Horizontal tectonic compression and fluid overpressure are two common external forces [38]. The macroscopic and microscopic structures of calcite veins in the study area reveal that they were affected by horizontal tectonic compression. Lenticular calcite veins are common in shale (Fig. 5a ). Some lenses show a stress shadow (see No.2 lens in Fig. 5a ), and both ends of the calcite lenses were sheared to form a crab claw structure (Fig. 5a ). Some calcite veins were sheared to form a "S" shape (Fig. 5b , 5e ), indicating that the formation of the veins was affected by tectonic compression or lateral gravity sliding shear. In addition, the e-twins in the calcite veins (Fig. 6c ) also indicate shear activities. Microstructures indicating sliding shear, such as slickensides, steps and micro horsts, were observed on the host rock (Fig. 4d -4f ). In-situ U-Pb dating analysis indicates the age of the blocky calcite veins is (69.9±5.2) Ma, which is consistent with the tectonic inversion time in the Songliao Basin [24], and also consistent with regional tectonic activities, that is, the subduction of the Izanagi plate and the subduction of the Pacific plate to the Eurasian plate [39]. Fluid overpressure is another important cause for horizontal fractures in shale, which may be caused by hydrocarbon generation, hydrothermal action, tectonic activity and clay mineral transformation [38].
The analysis of the Th of aqueous inclusions, burial curve and thermal model show that the calcite veins in the study area were formed in the mid-late maturity stage (Fig. 11 ), and hydrocarbon generation played a certain role in causing fluid overpressure. The retained bitumen in the calcite veins (Figs. 6f and 7 ) also indicates hydrocarbon generation and expulsion during the formation of the veins. Due to the extremely low permeability of shale, oil discharge is hindered, but it provides conditions for overpressure and fracture opening [40]. The transformation of clay minerals, especially the illitization of smectite, is one of the important causes for overpressure. The clay minerals in the Qingshankou Formation shale are mainly illite and illite-smectite mixed layers [41] in the late stage of meso-diagenesis. When buried bellow 1 650 m, a large amount of smectite transforms into illite [42], which is beneficial to the formation of overpressure. The pressure coefficient of the study area is 1.20, and the highest can reach 1.58 [42], which provides a condition for the opening of horizontal fractures. The heterogeneity and anisotropy of shale also provides a foundation for the opening of horizontal fractures. At the same time, higher TOC can reduce the tensile strength of shale, making it easier to form horizontal fractures under tectonic compression.
4.2.2. Migration and filling of vein-forming fluids
Vein-forming fluids may migrate through advective flow and diffusive flow [1,38]. Diffusive flow occurs in a relatively closed system, and the transport distance is several centimeters to decimeters driven by a chemical potential gradient. Advective flow is a long-distance flow in an open system, generally through fractures or permeable rock. The transport distance is from meters to kilometers [43]. The vein-forming material may come from the fluid in the host rock or fractures (near sources), or from external fluids (far sources).
Through the thin section and CL analysis of the host rock, it is found that widely distributed ostracod shells (Fig. 4b -4c ) provide materials for the formation of calcite veins, especially the coexistence of calcite veins and ostracods (Fig. 6d -6e ). During diagenesis and hydrocarbon generation, organic matter produced part of CO2 through decarboxylation, and ostracods provided part of Ca2+ through dissolution. When Ca2+ and CO32- in formation fluid are saturated, driven by a chemical potential gradient, CaCO3 may precipitate due to pressure drop in fractures. Some scholars believe that the calcite veins in the shale of the Nenjiang Formation in the Songliao Basin is closely related to the distribution of Ostracods which provided calcium carbonates for the formation of calcite veins during diagenesis [44]. No large fractures were founded in the shale in the study area, so it is uncertain whether the vein-forming materials were from distant sources. However, the seepage mechanism of vein-forming fluid during calcite vein growth is still unclear. Are fibrous vein always surrounded by diagenetic fluid and do they keep growing towards to the host rock? The existence of a median line/zone indicates that fibrous veins start to grow from it, and that cracks are closed at first and then begin to expand [38]. However, it is unknown whether the mechanisms of the initial growth and expansion of fibrous veins are the same.
4.2.3. The growth of calcite veins
The growth of bedding calcite veins is complex, generally explained by two mechanisms. One is crack-seal mechanism [11], and the other is the force of crystallization [13,36]. Crack-seal mechanism is of great significance for explaining the stretched calcite veins with serrated crystals [12]. The force of crystallization explains the origin of the antitaxial calcite veins with smooth crystals [13,36]. The driving force of crack opening and closing is fluid overpressure, under which veins are competitive. No stretched calcite veins with serrated crystals were found in the study area. Maybe the multi-stage of crack-seal mechanism is not the main mechanism of vein growth in the study area. However, the petrological characteristics show that vein-forming fluid filling into the fractures promoted the growth of calcite veins (Fig. 6a -6b ).
Veins formed under the force of crystallization do not need cracks since the force of crystallization can overcome the gravity of the overlying formation to provide space for the growth of veins. Of course, it is very difficult to characterize the force of crystallization. In most cases, it is calculated according to the Van Hoff equation [36,45].
When supersaturation at hydrostatic fluid pressure is 2, and temperature is 343.15 K (70 °C), the force of crystallization is 53.78 MPa [45], which is greater than the pressure of overlying strata (about 48 MPa) at the maximum buried depth (about 2 000 m) of calcite vein formation in the study area. Therefore, it is possible that calcite veins grow under the force of crystallization without cracks in the study area. The fibrous calcite veins with a large aspect ratio (Figs. 5d and 6d ) may develop in a non-competitive environment, and the force of crystallization may be the primary driver. Of course, there are some doubts about veins growing under the force of crystallization without cracks. What is the favorable host rock, what the growing law is, and how to calculate the force of crystallization. The solid inclusions in a "S" shape (Fig. 5c ) or a cone-in-cone shape (Fig. 6d ) make calcite veins appear a cone-in-cone structure. Solid inclusions are of great significance for tracing the forming process of veins, and their formation is affected by the adhesion on the contact surface between host rock and veins [46]. Some scholars analyzed the mechanism of the cone-in-cone structure through the growth of solid inclusions [46]. In addition, Cobbold et al. proposed that the vertical tensile strength affects the formation of the cone-in-cone structure, while the seepage force controls the formation of crystals [3].
The formation of calcite veins in the study area can not be attributed to a single genesis. According to the analysis of mineral petrology, crystallography and geochemistry, the blocky or columnar syntaxial veins were formed by fluid filling into fractures (Fig. 12a ). It followed a competitive crystal growth mode. Of course, there are fibrous antitaxial veins formed under the force of crystallization without fractures (Fig. 12b ). Tectonic activity and overpressure were important driving forces. Carbon (CO32-) was sourced from organic fluid, while Ca2+ was from ostracod shell dissolution. The diagenetic process is the result of comprehensive “organic and inorganic” action.

Fig. 12. Schematic diagram of calcite vein formation process. |
4.3. The relationship between calcite veins and hydrocarbon accumulation
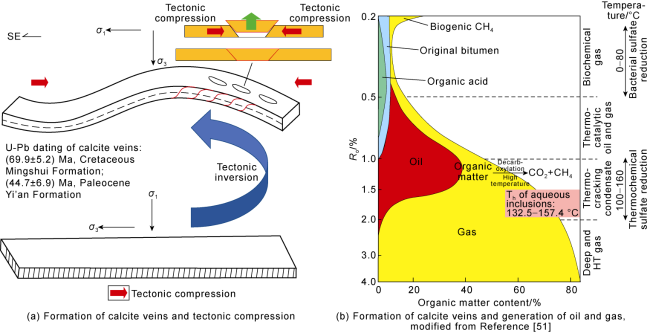
In recent years, great breakthroughs have been made to shale oil exploration in the Qingshankou Formation in northern Songliao Basin, and important progresses have been achieved in hydrocarbon generation and reservoir formation mechanism [23,42,47⇓⇓ -50]. Calcite veins in the shale oil reservoirs of the Qingshankou Formation have certain indicative significance for oil and gas accumulation. Tectonic compression induced fractures to open, which has been confirmed by typical microstructures (Figs. 4d -4f , 5e ). In-situ U-Pb dating analysis shows that the ages of calcite veins are (69.9±5.2) Ma and (44.7±6.9) Ma, and consistent with the structural inversion in the Songliao Basin [24] (Fig. 2 ), when the basin was subjected to SE compression [24] (Fig. 13a ).
Fig. 13. Relationships between calcite vein formation and tectonic compression and oil and gas formation. |
The formation of calcite veins is closely related to overpressure and hydrocarbon migration in shale [3,5,20]. The existence of hydrocarbon inclusions (Fig. 8b , 8e ) and asphaltene (Raman test point in Fig. 6f and Raman spectral analysis result in Fig. 7 ) in calcite veins also confirms that their formation is related to oil and gas generation. There are two types of calcite vein in study area, the peak Th of aqueous inclusions in blocky calcite veins is 130-150 °C, and the hydrocarbon inclusions show blue-green fluorescence, indicating that they were formed in the Late Cretaceous, and corresponding to mature stage of source rocks (oil window) of the Qingshankou Formation. In addition, the peak Th of aqueous inclusions in fibrous calcite veins is 140-160 °C, and the associated hydrocarbon inclusions are blue and white under UV light (Fig. 8f ), which indicates that the hydrocarbon inclusions are highly mature and the product from mature to high maturity stage.
In-situ U-Pb dating is widely used in petroleum geological research [4,18,27,34]. Combined with fluid inclusions, the absolute age of diagenesis and hydrocarbon accumulation can be comprehensively determined [27]. Combined with the burial and thermal history and previous studies, the U-Pb dating of the blocky calcite veins (69.9±5.2) Ma corresponds to the geological formation time of brine inclusions, which is in the sedimentary period of Mingshui Formation in Late Cretaceous, that is, the mature period of organic matter in source rocks of Qingshankou Formation, indicating the formation time of Gulong conventional oil. The U-Pb dating of the fibrous calcite veins (44.7±6.9) Ma is consistent with the formation time of brine inclusions, which is in the sedimentary period of the Yi'an Formation in Paleogene, i.e. the middle and high maturity stage of the source rocks, indicating the formation time of the Gulong light shale oil [32] (Fig. 11 ).
Therefore, the calcite veins in the organic-rich shale in the study area have indicative significance for regional tectonic activity, fluid overpressure, hydrocarbon generation and expulsion, and diagenesis-hydrocarbon accumulation dating of the Songliao Basin.
5. Conclusions
Calcite veins are widely developed in the shale reservoirs of the Upper Cretaceous Qingshankou Formation in northern Songliao Basin. Based on macroscopic observation, these calcite veins, most of which were developed along beddings are lenticular, "S"-shaped, cone-in-cone and pinnate. Based on microscopic observation, they are syntaxial and blocky or columnar, and antitaxial and fibrous.
The Th of aqueous inclusions in blocky calcite veins is (132.5-145.1) °C, and the age of in-situ U-Pb dating is (69.9±5.2) Ma. Combined with the burial history and thermal model, it is considered that they were formed when the Late Cretaceous Mingshui Formation deposited. The Th of aqueous inclusions in fibrous calcite veins ranges from 141.2 °C to 157.4 °C, and the age of U-Pb dating is (44.7±6.9) Ma, corresponding to the late maturity stage of source rocks, and they were formed when the Paleocene Yi'an Formation deposited. At the same time, structural inversion took place during the late Cretaceous in the Songliao Basin. SE compression may influence the formation of calcite veins and later shear structures.
The formation of syntaxial blocky or columnar calcite veins is related to diagenesis and hydrocarbon generation, and they gone through three stages: fractures opening, vein-forming fluid filling and vein growth. Tectonic compression and fluid overpressure are important external factors for fractures opening. In addition, the heterogeneity and anisotropy of shale play an important role in opening horizontal fractures. Vein-forming fluid is mainly a short-distance diffusion flow, and vein growth follows a competitive. The formation of antitaxial fibrous calcite veins is the result from the force of crystallization, without fractures and in a non-competitive environment. The research of calcite veins of organic-rich shale in continental lake basin has important implications on basin tectonic activities, fluid overpressure, hydrocarbon generation and expulsion of shale, and diagenesis-hydrocarbon accumulation dating of lacustrine basin.