

Introduction
Large pre-trained models are driving a new wave of technological and industrial transformation, with the application of large language models (LLMs) in specific industries and scenarios becoming a core trend for future intelligent solutions [1-2]. In response to the current situation in ChinA's mature oilfields, characterized by a large number of wells and complex production layers, reservoir engineers face an overwhelming workload for dynamic analysis. To address this, the development of a LLM tailored to reservoir dynamic analysis (RDA) holds the potential to significantly assist with tasks such as well history data retrieval and analysis, well-to-well profile plotting, calculation of key technical indicators of development and production, RDA, and measure suggestion. Through simple human-computer interaction, this model aims to assist RDA and automate a significant portion of the work, vastly improving the efficiency of oilfield development [3].
Today's LLMs are primarily built on the Transformer architecture, integrating large parameters, big data, and great computing power [4-5]. The release of ChatGPT in November 2022 showcased the immense potential of general-purpose LLMs, quickly gaining widespread attention. These models are capable of engaging in daily conversations and can also handle complex tasks such as writing articles, answering questions, and providing recommendations [6].
The general-purpose LLMs released by the United States and China by the end of 2023 accounted for 80% of the total global releases, which makes both nations as leaders in the field of LLM techniques. Internationally, notable models include OpenAI's GPT, Microsoft's PaLM, and MetA's LLaMA series, among which the LLaMa series is an open-source model [7⇓⇓⇓⇓⇓-13]. In China, prominent models include Baidu's Ernie Bot, Alibaba Cloud's Tongyi Qianwen, Tencent's Hunyuan, Baichuan Intelligence's Baichuan series, and Tsinghua University's GLM-130B [14⇓⇓-17]. Stanford University also fine-tuned the LLaMA model, resulting in Alpaca, with the Alpaca 7B version performing comparably to GPT-3.5 in Self-Instruct evaluations [18]. Furthermore, Chinese-Alpaca-2.0 extended the Alpaca model by incorporating large-scale Chinese corpora through additional pre-training, enhancing its proficiency in Chinese dialogues. However, general-purpose LLMs tend to lack domain-specific expertise and have limited understanding of specialized knowledge and terminology. To address this, augmenting these models with specialized vocabularies and additional pre-training can make them more suitable for specific industries such as finance, law, healthcare, and oil and gas exploration and development.
As of June 2024, the oil and gas industry has issued several large language models successively over the past year. However, Liu et al. [19] emphasized that the focus for LLM applications in this field should be on fine-tuning and adapting them to downstream tasks, rather than developing L0-level general foundational models. They recommended independently developing L3-level scenario-specific models and high-quality L2-level industry foundational models, as well as application scenario models specific for oil and gas analysis driven by business needs and guided by the principle of solving specific problems. In response to this, Chang et al. [20] explored the intelligent application of scenario-specific LLMs in multimodal and multi-task geophysical analysis within the oil and gas sector. Nonetheless, in the specific RDA application scenarios, engineers must rely on production data, various engineering software tools, and expert knowledge to provide reliable recommendations for development plan adjustments and measures.
In response to the intelligent demands of RDA, this paper proposes a method for constructing scenario-specific LLMs and outlines key technologies. We use Named Entity Recognition (NER) to identify sub-tasks within RDA, apply Text-to-SQL in sub-tasks requiring external retrieval of static and dynamic reservoir data by converting natural language into structured query language, and utilize classification tasks to select appropriate formula calculators or commercial software as computational aids for sub-tasks requiring specialized calculations. By integrating static reservoir data, dynamic data queries, and computational results through an industry-specific LLM, we achieve intelligent analysis and recommendation capabilities for reservoir dynamic challenges. This paper marks the first application of large AI models to the field of RDA, providing a feasible technical solution that simplifies the human-computer interaction process in this specific context.
1. The approach to apply LLMs in RDA
To construct LLMs tailored to RDA, the first step is to establish an industry-specific model that centers around petroleum engineering expertise. Afterward, fine-tuning is necessary for optimizing the model to address specific tasks within the scenario, ensuring it can accurately solve problems in this vertical field. Therefore, building a LLM for RDA consists of three steps: incremental pre-training, subsystem task fine-tuning, and functional subsystem coupling (Fig. 1 ). Incremental pre-training involves selecting a suitable foundational general model and preparing a pre-training dataset. This stage also includes expanding the model's specialized vocabulary related to petroleum engineering and applying relevant datasets to perform incremental pre-training, which results in a petroleum engineering industry model for subsequent studies. Subsystem task fine-tuning focuses on three primary task demands: analysis and recommendation, data retrieval, and tool classification. This process yields three models, each with specialized response capabilities tailored to these specific tasks. Functional subsystem coupling involves defining data flow input and output interfaces for these three fine-tuned models and coupling them based on a specific logical structure. This coupling process forms three functional subsystems, each designed to meet the requirements of RDA scenarios.
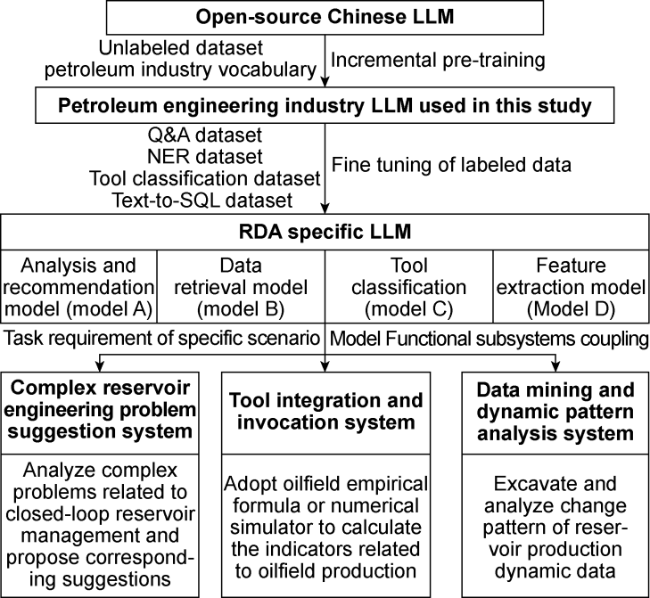
Fig. 1. Schematic approach of constructing a scenario-specific LLM for RDA. |
1.1. Incremental pre-training
Given the current absence of open-source large models specific to the oil and gas industry for academic research, this paper developed a petroleum engineering industry LLM based on Chinese-Alpaca-2.0 (an open-source Chinese LLM) for subsequent application research of scenario-specific LLMs. The process includes expanding the vocabulary by 0.7 kB with commonly used technical terms and performing incremental pre-training on an unlabeled dataset of approximately 8.5 GB, which consists of petroleum engineering literature, books, and other resources. Due to the stringent data source requirements for incremental pre-training, a careful balance between performance and cost must be maintained when constructing this industry model for research purposes.
The pre-training dataset includes professional literature, books, and relevant software help documents covering oil and gas reservoir development engineering, geological exploration, drilling engineering, and fracturing engineering. The PDF file data extraction and processing procedure using Python toolkits involves several steps: PyPDF2 is used to differentiate between document-based and image-based PDFs, Tesseract-OCR is employed to convert image-based PDFs into document-based PDFs, and Grobid is applied to transform document-based PDFs into XML/TEI (Extensible Markup Language/Text Encoding Initiative) encoded files. LXML's Etree module is then used to read and split the XML/TEI files by paragraphs. These files are subsequently converted into lightweight Markdown format using the XML2MD toolkit, ultimately producing a dataset of approximately 8.5 GB for incremental pre-training. Additionally, technical terms are collected and filtered based on the content of the pre-training dataset. This expands the base 55 kB vocabulary of Chinese-Alpaca-2.0 by 0.7 kB with specialized terminology, ensuring that the petroleum engineering industry model in this study can accurately recognize relevant technical terms. In addition, these specialized terms are properly segmented during the tokenization process.
After the vocabulary expansion, the tokenizer preserves essential "elements" of the technical terms, enabling the LLM to more accurately capture contextual relationships between specialized information from domain-specific corpora during incremental pre-training.
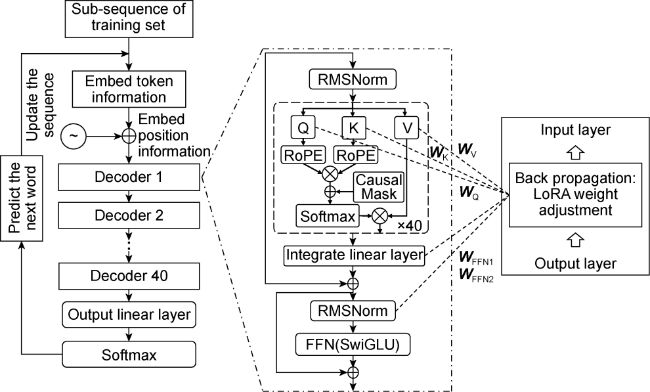
Fig. 2. Model structure and parameter adjustment method of incremental pre-training. LoRA—low rank adaptation technology used to fine tune large language models; RMSNorm—root mean square normalization layer; Q, K, V—value vector, key vector, query vector calculation layer; RoPE—rotation position code; Causal Mask—causal mask; Softmax—flexible maximum transfer function; FNN—feedforward neural network layer; SwiGLU—gated linear unit activation function. |
The Chinese-Alpaca-2.0 (13 B) model used in this study consists of 40 stacked Transformer decoder layers. Each decoder contains a self-attention mechanism with 40 attention heads, and each self-attention head utilizes four weight matrices: WQ, WK, WV, and WO, where WO represents the output layer's weight matrix. The multilayer perceptron (MLP) is composed of two feedforward neural network layers WFNN1, WFNN2. During incremental pre- training, each backpropagation step involves the adjustment of 6 480 weight matrices, including 6 400 from the WQ, WK, WV, and WO matrices, and 80 from the WFNN1 and WFNN2 matrices. The LoRA (Low-Rank Adaptation) method [24] is employed for weight adjustment. This approach can provide the existing weight matrices with a bypass to freeze all the model's weight parameters of the general foundational model during training, adjusting only the down-projection and up-projection matrices. This greatly reduces the number of parameters that need adjusting during backpropagation.
1.2. Fine-Tuning for subsystem tasks
The LLM for RDA is built using a hybrid expert system approach, a method increasingly common in applying LLMs to specific scenarios through the integration of multiple models [25]. This RDA model leverages three fine-tuned models, namely A, B, and C, each specialized in distinct tasks—analysis and recommendations, data retrieval, and tool classification, respectively, and makes use of a feature extraction model D to gather multidimensional entity information from user inputs and plan the specific calls to models A, B, and C, enabling four comprehensive application functions: (1) solving RDA questions, (2) querying static and dynamic oilfield databases to uncover data trends, (3) using tools to calculate key oilfield development indicators, and (4) performing integrated analyses of complex problems related to tasks (1) to (3).
The RDA model consists of four fine-tuned models, each of which is fine-tuned on the petroleum engineering industry model via the LoRA method by using different labeled dataset. The analysis and recommendation model, the data retrieval model, and the tool classification model are used for fine-tuning of specific scenarios, and the feature extraction model is primarily responsible for extracting features from user inputs.
Models A, B, and C all receive natural language inputs and output results are in Markdown format, while coupling between computer program modules typically occurs through function calls, so these models are integrated into three subsystems: System I (Complex Reservoir Engineering Problem Suggestion System), System II (Data Mining and Dynamic Pattern Analysis System), and System III (Tool Integration and Invocation System). Each system is assigned different parameter invocation interfaces and return values to ensure programmable coupling between systems. In these systems, function input parameters and variables are combined into JSON (JavaScript Object Notation) strings, which serve as prompts for the LLM. This blended prompting method [26] allows each system to flexibly utilize the model, achieving multi-purpose functionality with a single model.
(1) Complex reservoir engineering problem suggestion system (Fig. 3 ): For general reservoir engineering questions, the system directly calls the industry model and sends the result to output 1. For more specific reservoir dynamic analysis questions, such as single-well dynamics, well group injection-production dynamics, or block dynamics analysis, the system constructs a blended prompt. This prompt combines the user's query with the static and dynamic data from System II and the external tool invocation results from System III, which is then sent to Model A for an answer. The result is returned to output 2.
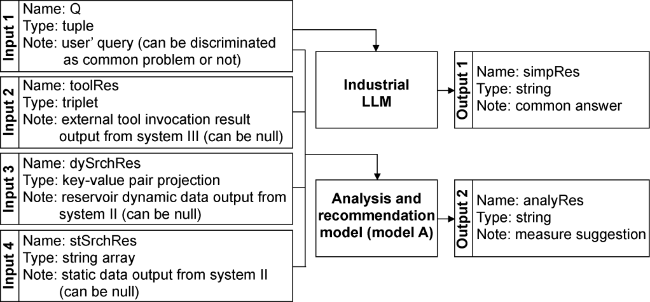
Fig. 3. Complex Reservoir Engineering Problem Suggestion System (System I). AnalyRes, simplRes—system I output; DySrchRes, stSrchRes—system II output and system I input; Q—system I input; ToolRes—system III output and system I input. |
(2) Data mining and dynamic pattern analysis system (Fig. 4 ): This system utilizes Text-to-SQL functionality of Model B to convert natural language into SQL (Structured Query Language) queries, enabling database searches. The resulting query data is sent to outputs 1 and 2, providing static and dynamic reservoir data. Moreover, when trend analysis is needed, the retrieved data is passed to Model A for further analysis, and the trend analysis result is sent to output 3.
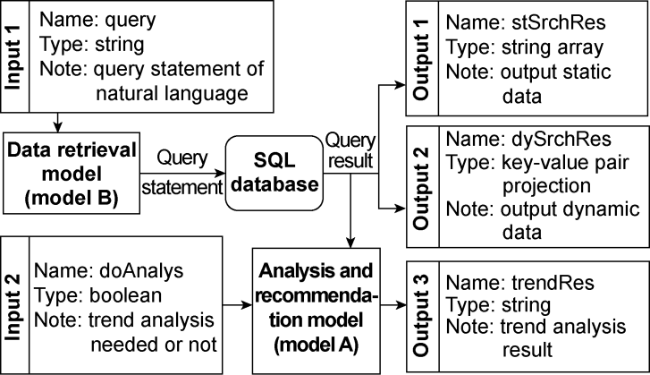
Fig. 4. Structure of Data Mining and Dynamic Pattern Analysis System (System II). DoAnalysis, query—System II input; StSrchRes—system II output and system I and III input; TrendRes—System II output; DySrchRes—system II output and system I and III input. |
(3) Tool integration and invocation system (Fig. 5 ): This system predefines API (Application Programming Interface) calls for various tools within different functions. Model C converts descriptions containing tool information into specific classification numbers, facilitating tool lookup and invocation. These tools, combined with the static and dynamic data from System II, are used to calculate key development indicators in dynamic analysis. To balance the input/output datA's flexibility and the model's readability during tool invocation, all external tool service input/output streams are standardized into JSON string format.
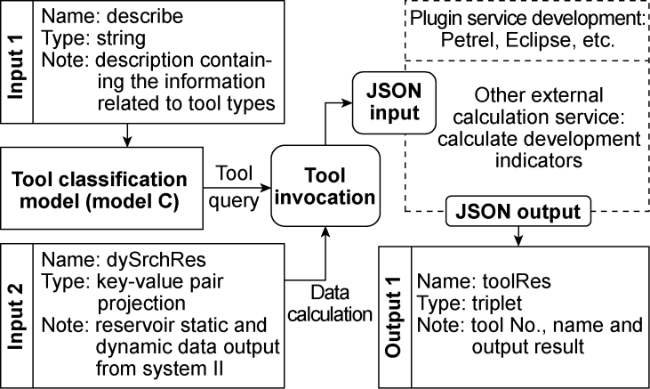
Fig. 5. Structure of Tool Integration and Invocation System (System III). DySrchRes, describe—system III input; ToolRes—system III output and system I input. |
To ensure the independence and scalability of tool invocations, external tools are built separately and invoked through RPC (Remote Procedure Call) protocols and RESTful (Representational State Transfer) interfaces. For example, in developing the Petrel plugin service, the Petrel SDK (Software Development Kit) is used to perform specific functions, such as well-to-well profile plotting. This service takes the model name and well number as input parameters, retrieves well coordinates via the Petrel SDK interface, and generates an inter-well profile based on the coordinates of two wells. The generated image is saved to a file server, and the file path along with the geological properties between wells is returned in JSON string format.
1.3. Coupling of functional subsystems
In the coupled model for RDA, the output of the feature extraction model D, directly influences how systems I, II, and III collaborate in responding to the current user query. To achieve the integration and coordination among these systems, a functional subsystem coupling method is proposed (Fig. 6 ).
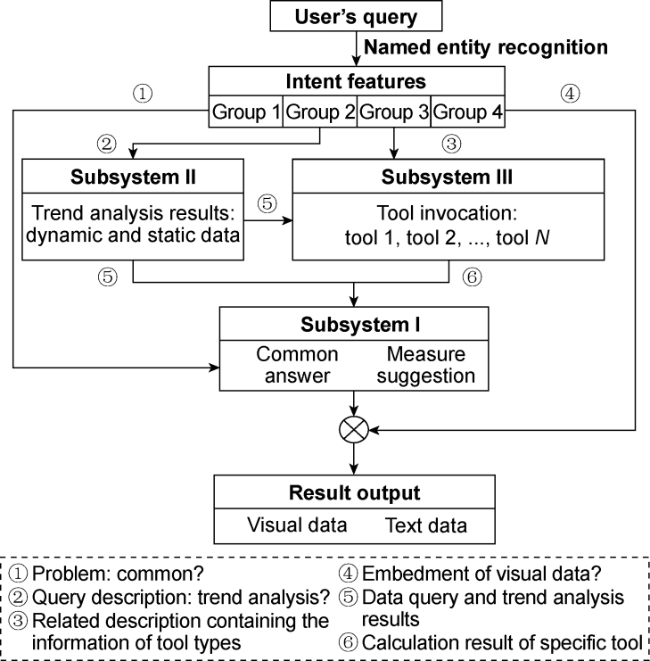
Fig. 6. Functional subsystem coupling method for LLM for RDA (N—number of tools). |
The coupling process begins with detailed parsing of the user's query using Named Entity Recognition (NER), extracting relevant entities and performing deeper semantic analysis. The user's intent is then categorized into four groups: general question and answer, data retrieval and analysis, and the potential demands for computation or specialized analysis suggestions. For general queries, the system routes the question to System I for a direct response. For data retrieval tasks, the model employs the Text-to-SQL functionality of System II to query the relevant data from the database. For tasks requiring computation or specialized analysis suggestions, the model uses the external tool invocation capabilities of System III to independently compute technical indicators and invoke Petrel for generating relevant plots. All user requests and their corresponding results—whether visual or text-based— are displayed through a unified front-end interface.
This approach ensures the independence of each subsystem while efficiently sharing information and resources, significantly enhancing the system's overall flexibility and scalability. It also provides ample scope for expanding the functionality of the RDA model in the future.
2. Fine-tuning and testing of LLMs for RDA
2.1. Fine-tuning and testing of the analysis and recommendation model
The fine-tuning dataset for the analysis and recom-mendation model (Model A) contains a total of 110 entries, including 77 focused on single-well dynamic analysis, 20 on well-group injection-production dynamic analysis, and 13 on block dynamic analysis. Each fine- tuning entry consists of three parts: case descriptions, problems to be solved, and proposed solutions, corresponding to inputs, instructions, and outputs, respectively.
By adjusting the time period, stage, and layer information for each instance in Model A's fine-tuning dataset, a total of 330 test entries were generated. The model's question-answering (QA) performance was evaluated across four dimensions: relevance, accuracy, completeness, and fluency. To reduce bias, the independent evaluations of Model A's responses by three experts in the field of reservoir dynamic analysis were compared, as shown in Table 1. The results show that, aside from subjective factors, the fine-tuned analysis and recommendation model demonstrates strong performance in terms of completeness (96.7% accuracy) and fluency (99.4% accuracy). Although accuracy (88.3%) and relevance (92.9%) require improvement, the model still provides satisfactory responses for most analysis and recommendation tasks. The challenges in accuracy and relevance arise from the complex geological conditions, multiple production strategies, and variable dynamic responses in reservoir dynamic analysis. In some cases, changes to the time period, stage, or layer information make the original solutions in the analysis template less applicable. Moving forward, problematic test entries will be identified for refinement, and the original fine-tuning dataset will be expanded and complemented to further optimize Model A's performance.
Table 1. QA performance testing of the analysis and suggestion model |
| Experts | Total samples | Relevant dimensions | Accurate dimensions | Complete dimensions | Fluent dimensions | ||||
|---|---|---|---|---|---|---|---|---|---|
| Number of exact samples | Accuracy/ % | Number of exact samples | Accuracy/ % | Number of exact samples | Accuracy/ % | Number of exact samples | Accuracy/ % | ||
| Expert 1 | 330 | 307 | 93.0 | 295 | 89.4 | 326 | 99.0 | 330 | 100.0 |
| Expert 2 | 330 | 315 | 95.5 | 297 | 90.0 | 324 | 98.0 | 328 | 99.4 |
| Expert 3 | 330 | 298 | 90.3 | 282 | 85.5 | 310 | 93.9 | 326 | 98.8 |
| Comprehensive | 330 | 92.9 | 88.3 | 96.7 | 99.4 | ||||
2.2. Fine-tuning and testing of the feature extraction model
The fine-tuning dataset for the feature extraction model (Model D) contains a total of 256 entries, covering seven dimensions: Well No. (Well_id), Layer No. (Well_layer), Start Time (Data_from), End Time (Data_to), Stage (Period), Primary Issue (Target), and Display Type (Wanted_type). After fine-tuning, Model D is able to convert user input into a JSON string that encapsulates multidimensional data information.
A comprehensive dataset of 1 300 questions related to reservoir dynamic analysis was designed for testing purposes. Using the Named Entity Recognition (NER) accuracy evaluation method proposed by Dunn et al. [27], the effectiveness and accuracy of the model's entity recognition were evaluated based on three aspects: entity recognition rate, numerical variable entity recognition accuracy, and semantic recognition accuracy (see Table 2 ). The test results indicate that the semantic recognition accuracy for "Target" (91.5%) and "Wanted_type" (89.8%) require further improvement. The lower accuracy is attributed to the fact that relevant information for these two dimensions cannot be directly extracted from the question. Moving forward, implementing more refined post-processing rules may help reduce the error rate.
Table 2. NER performance test of NER Model |
| Named entities | Definition | Total number of samples | Entity identification | Numeric variable entity identification | Semantic recognition | |||
|---|---|---|---|---|---|---|---|---|
| Number of correct samples | Recognizable rate/% | Number of correct samples | Accuracy/ % | Number of correct samples | Accuracy/ % | |||
| Well_id | Well No. | 1 300 | 1 275 | 98.1 | 1 247 | 96.5 | ||
| Well_layer | Layer No. | 1 300 | 1 235 | 95.0 | 1 222 | 94.0 | ||
| Data_from | Start time | 1 300 | 1 287 | 99.0 | 1 274 | 98.0 | ||
| Data_to | End time | 1 300 | 1 287 | 99.0 | 1 274 | 98.0 | ||
| Period | Stage (e.g., annually) | 1 300 | 1 261 | 97.0 | 1 274 | 98.0 | ||
| Target | Primary issues (e.g., oil production) | 1 300 | 1 209 | 93.0 | 1 189 | 91.5 | ||
| Wanted_ type | Type of display (e.g., curved graph) | 1 300 | 1 235 | 95.0 | 1 168 | 89.8 | ||
2.3. Fine-tuning and testing of the data retrieval model
The fine tuning dataset used for data retrieval model (model B) can be fine tuned to get a model that can convert natural language query questions into SQL query statements. The Text-to-SQL fine-tuning dataset in the field of RDA constructed in this paper contains 128 common natural language query questions and their corresponding SQL query statements in the field of RDA.
By designing 1300 data sets of common natural language query questions in the field of RDA, and according to the different SQL query difficulty grading standards and accuracy testing methods proposed by Yu et al. [28], the data set was divided into four levels: simple, medium, complex, and extremely difficult. There were 700, 500, 80, and 20 SQL statements respectively. The text-to-SQL performance of the model before and after fine-tuning was compared and tested (Table 3 ). The results show that compared with the LLM of the petroleum engineering industry before fine tuning, the overall accuracy of model B matching after fine tuning has increased by 31.0 percentage points, and the overall implementation accuracy has reached 95.2%. The errors of model B mainly occur in complex and extremely difficult SQL statements, and the related errors mainly focus on the ambiguity caused by the inaccurate description of natural language input during the generation of more complex and multi-level nested Select query statements. Next, the complexity of the syntax structure of the Select query statement can be limited through prompt words, to avoid the ambiguity of the Text-to-SQL statement itself, and further improve the accuracy of Text-to-SQL.
Table 3. Text-to-SQL performance test of Data Retrieval Model |
| Model accuracy standards | Matching situation before fine-tuning | Matching situation after fine-tuning | Implementation after fine-tuning | ||||
|---|---|---|---|---|---|---|---|
| Grading | Total number of samples | Number of exact samples | Accuracy/ % | Number of exact samples | Accuracy/ % | Number of exact samples | Accuracy/ % |
| Simple | 700 | 485 | 69.3 | 700 | 100.0 | 700 | 100.0 |
| Medium | 500 | 337 | 67.4 | 498 | 99.6 | 462 | 92.4 |
| Complex | 80 | 46 | 57.5 | 70 | 87.5 | 53 | 66.3 |
| Extremely difficult | 20 | 5 | 25.0 | 11 | 55.0 | 8 | 40.0 |
| Overall accuracy | 67.3 | 98.3 | 95.2 | ||||
2.4. Fine-tuning and testing of the tool classification model
The fine-tuning data set used for the tool classification model (model C) lists 28 tool use scenarios for dynamic reservoir analysis and their corresponding category labels (tool numbers). The fine tuned model can convert the input natural language description into the corresponding tool number.
By designing 1 300 test questions related to 28 tool use scenarios, three different tool identification methods were compared (Table 4 ). The results show that the accuracy rate of the "NER target+classification task discrimination tool" method adopted by the LLM for the RDA scenario in this paper is the highest, reaching 89.3%, while the accuracy rates of the NER direct recognition tool and the classification task direct discrimination tool are 35.9% and 32.5% respectively. This shows that the method proposed in this paper to extract key entity information through named entity recognition technology before classification can make the classification task obtain better overall fine tuning effect on a small number of training samples, and greatly improve the accuracy of tool recognition.
Table 4. Three different methods of tool identification and their accuracy assessment |
| Identification tools | Number of exact samples | Accuracy/ % |
|---|---|---|
| NER direct recognition tool | 467 | 35.9 |
| Classification task direct discrimination tool | 423 | 32.5 |
| NER target+classification task discrimination tool | 1 161 | 89.3 |
3. Function testing of the LLM
Taking PK3 block of Daqing Oilfield as an example, the relevant practical application cases in the process of dynamic reservoir analysis were selected to test the LLM of this scenario, mainly for the auxiliary dynamic reservoir analysis of some injection and production well groups, including real-time retrieval and query of single-well injection and production data, sorting and retrieval of single-well historical measure data, calling software to draw well-to-well profiles, and analyzing the injection and production connectivity and the response horizon of water injection.
PK3 block is located in the south of Daqing Placanticline, NW China, with an oil-bearing area of 55.3 km2, geological reserves of 4 113×104 t, reservoir depth of 800-1 000 m, and 26 horizons.
3.1. Real-time retrieval and query of single-well injection and production data, and sorting and retrieval of single-well historical measure data
Taking some injection and production well group units in PK3 block as an example, the LLM of dynamic reservoir analysis scenario can directly access the database through text language expression, retrieve the corresponding injection and production data, and display the curve. The selected question is: "Check the stratified oil and water production data of Well D0770692 from 2012 to 2021, and the stratified water injection data of Well D0770069 and Well D0780070 from 2012 to 2021, and display the curve chart". The LLM of dynamic reservoir analysis can access the database through language description, query the injection and production data of related wells and generate curves (Fig. 7 ).
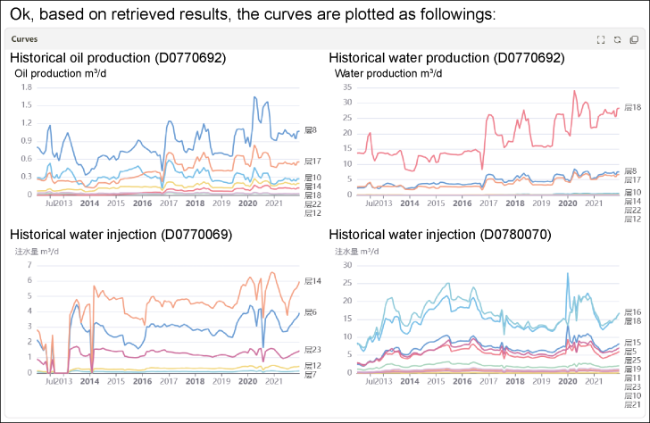
Fig. 7. Query and plotting results of historical injection and production data. |
The LLM of dynamic reservoir analysis scenario can help query and sort out the historical measure data of any single well, which is convenient for reservoir engineers to access and view them at any time. The problem selected in this paper is: "Sort out the historical measure data of Well D0780070, and provide relevant Excel files". The results are shown in Fig. 8 .
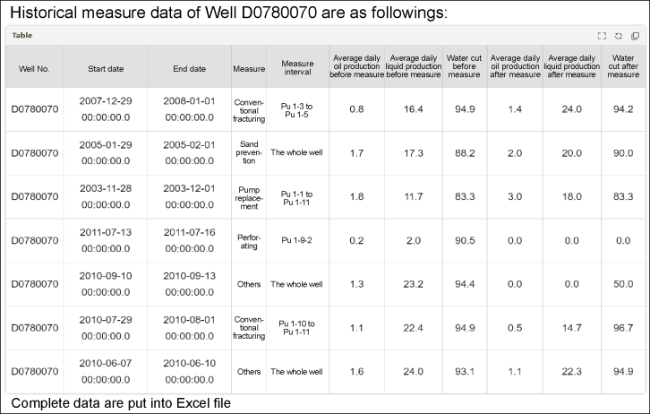
Fig. 8. Querying and printing results of well historical measure data. |
3.2. Invoking tools to map the well-to-well profiles and calculate key technical indicators
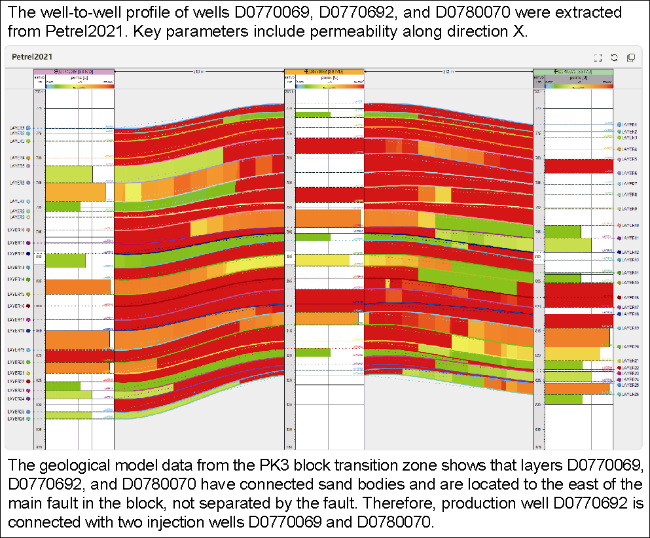
The question "Call Petrel2021 software to draw the profile through D0770069, D0770692 and D0780070 wells, and mark the permeability in the X direction" was selected to test the tool invocation capacity of the model. The LLM of dynamic reservoir analysis can call Petrel2021 software to draw the well-to-well profile according to the well name and relevant attribute requirements (Fig. 9 ). At the same time, after fine-tuning, the LLM of RDA scenario with the ability to call tools can read the relevant dynamic data from the database, and call the relevant empirical formula to calculate the technical indicators and return the results. As for the problem of "calculate the water cut rise rate of PK3 block in 2020", the LLM called the formula based on the relevant dynamic data in the database to calculate the water cut increase rate of PK3 block in 2020, which is 1.82%.
Fig. 9. Calling Petrel2021 software to draw the well-to-well profile and the injection and production connectivity analysis results based on the geological model data. |
3.3. Analyzing the connection relationship between injection and production well groups and the response layer of water injection in a single well
The question "Analyze the injection and production connectivity of D0770069, D0770692 and D0780070 wells" was selected to test the ability of the model to understand and analyze the injection and production connectivity of the well cluster, and verify the efficiency of the model in dealing with complex oil and gas reservoir engineering problems. The LLM of reservoir dynamic analysis scenario can obtain the coordinates of relevant well locations, sand body connectivity and fault locations in the geological model data of PK3 block, and judge the injection and production connectivity of related wells. The analysis results show that the production well D0770692 of the selected three wells is connected with the water injection wells D0770069 and D0780070. From the perspective of reservoir engineering, in the production performance curve, the liquid rate of the production well has obvious response after the injection rates of two injection wells are increased or decreased, so it is judged that the connectivity between the production wells and the two injection wells is good, which is consistent with the analysis results of the LLM.
The question "analyze the water injection responding horizon of Well D0770692 and give suggestions" was selected to test the ability of the LLM to analyze the response horizon of single-well water injection and propose suggestions. According to the historical separate-layer water production and permeability data of Well D0770692, the model made corresponding analysis, and gave judgments and suggestions: (1) The water production rate of the 18th layer in Well D0770692 is the highest, followed by the 8th and 17th layers, and the 10th, 12th, 14th, and 22nd layers rarely produce water. (2) The water injection response of the 18th layer is the highest, and this layer may be flooded. It is recommended to take water plugging measures. (3) The 10th, 12th, 14th and 22nd layers are low permeability layers, which are almost ineffective. We should try to change the water injection method, and take fracturing and other technical means to improve the percolation capacity of the reservoir. The manual analysis and judgment indicate that the average water production of the 18th layer of the well is 20 m3/d, and the average water cut is 98.7%. This layer has indeed been flooded. It can be seen that the model analysis results are in good agreement with the actual production status.
4. Conclusions
The LLM of RDA scenario was constructed via three steps of incremental pre-training, command fine-tuning and function subsystem coupling. The functional subsystem fine tuned based on named entity recognition technology, tool invocation technology, and Text-to-SQL technology and its efficient coupling method were proposed, and the LLM of artificial intelligence was applied to the field of RDA. Finally, the LLM of reservoir dynamic analysis scenario was tested by taking some injection and production well groups in the actual block of transition zone of the PK3 fault block in Daqing Oilfield as an example, which verifies its application value and potential in assisting reservoir engineers in reservoir dynamic analysis, providing better technical support for the application of the LLM in reservoir dynamic analysis. Although the LLM of reservoir dynamic analysis scenario in this paper has preliminarily realized the relevant functions of reservoir dynamic analysis assistant, such as real-time retrieval and query of single-well injection and production data, sorting and retrieval of single-well historical measure data, calling software to draw well-to-well profile, and analyzing injection and production connectivity and water injection response horizon, but its overall query function is obviously stronger than the analysis ability, and a lot of in-depth research work still needs to be carried out before it is actually applied to the industrial field of reservoir dynamic analysis.
In terms of building an LLM in a professional field, the 8.5 GB incremental pre-training data set used in this paper is difficult to fully support the building needs of an LLM in a professional field. Considering that the analysis capability of the LLM of RDA scenario still needs to be based on the deep reading and understanding ability of the LLM of the professional field to the case prompt words or context of the oil and gas development professional field, the analysis and understanding ability of the LLM of RDA scenario can be further enhanced by expanding the high-quality oil and gas industry corpus in the future, or the functions of the LLM can be researched directly based on the mature LLMs used in the oil and gas field.
As for the function of RDA scenarios, diversified test cases or datasets simulating different reservoir characteristics can be added in the future to improve the accuracy and adaptability of the model in all kinds of RDA scenarios, especially for the analysis of different geological conditions and reservoir types. In order to adapt to the continuous accumulation of oilfield data and the changes in reservoir conditions, we can draw inspiration from the working mechanism of OpenAI's newly released O1-preview model from September this year. By applying a 'slow thinking' model to reservoir dynamic analysis, we aim to enable the model to independently devise a multi-step workflow for specific problems. This capability will allow the model to tackle complex problems step by step, based on the defined workflow, thereby improving its performance in complex inference tasks. In terms of system maintenance, a semi-automatic or automatic update mechanism can be established according to the changes in the database structure to realize the iterative updating of data. Additionally, it is considered to introduce the workflow of human-machine collaboration and allow reservoir engineers to intervene, correct or supplement the model output and feedback it to the model, so that it can be effectively integrated into the learning and optimization process of the model, and realize the deep integration and complementarity of human-machine collaboration.