

Introduction
The Sichuan Basin is the earliest petroliferous basin in China for commercial shale gas exploration and development [1-2]. Currently, the shale gas in the basin is mainly producing from the Upper Ordovician Wufeng Formation-Lower Silurian Longmaxi Formation (hereinafter referred to as Wufeng-Longmaxi). Commercial breakthroughs and large-scale beneficial development have been achieved in Luzhou, Changning, Weiyuan, Fuling, and other blocks. A series of shale gas exploration and development technologies have been developed for the Wufeng-Longmaxi marine shales in the mid-deep (2 500- 3 500 m) strata of the basin, enabling the first shale gas field in China with reserves at level of trillion cubic meters and production at level of ten billion cubic meters [3]. Meanwhile, major oilfield companies, research institutions, and relevant governmental authorities are actively engaged in the construction of second shale gas field in China with the same scale in deep (3 500-4 500 m) Wufeng-Longmaxi shales. In contrast, the Cambrian Qiongzhusi Formation, also a typical deep shale system, has not achieved any commercial breakthrough and is challenged by unknown shale gas enrichment pattern and undefined prospects for production, although it is widely distributed in the entire Upper Yangtze region covering the Sichuan Basin and has an excellent hydrocarbon generation potential [4]. In 2009, China National Petroleum Corporation (CNPC) deployed Well Wei 201 in the relatively shallow and tectonically stable Weiyuan anticline to explore the potential of the Qiongzhusi Formation. This well revealed a production rate of 1.08×10⁴ m3/d in the test upon vertical well fracturing, recording the “gas breakthrough” in the Qiongzhusi Formation. However, six wells subsequently deployed toward specific formations in the Weiyuan and Changning anticlines failed to yield ideal results, which is not consistent with the previous understanding that organic-rich shale is enriched with gas continuously and stably in a large area under certain burial depth and preservation conditions[5-6].
Compared with the successful operations in the Wufeng- Longmaxi, the shale gas exploration of the Qiongzhusi Formation is believed to be deficient in three aspects:
(1) Unclear dominant sedimentary facies zones. Previous studies preliminarily investigated the lithofacies and sedimentary facies of the Qiongzhusi Formation shale in the Deyang-Anyue aulacogen [7-8], but did not precisely divide the facies zones in different structural parts of the aulacogen, and not identify the differences and controlling factors of microfacies.
(2) Unknown areas with appropriate maturity. The Qiongzhusi Formation shale is old, deep, and thermally mature, with Ro˃3.5% in most wells [9]. Such a high maturity leads to a high degree of organic matter graphitization and thus a decreased resistivity. For the exploration and development of shale gas, the distribution range of the moderate thermal maturation degree or maturity is not known, and the upper limit of the thermal maturity is not determined.
(3) Undefined shale gas enrichment zones. Porosity and total gas content are critical parameters for evaluating shale gas plays. Shale gas occurs in nanopores primarily in adsorbed and free states, and the development of organic pores significantly influences shale porosity [10⇓⇓-13]. In the Qiongzhusi Formation shale, organic pore is underdeveloped and inorganic pore is less developed, resulting in a porosity of 1.2%-3.7% (average 2.3%) and a total gas content of 0.7-3.0 m3/t (average 1.56 m3/t), which are much lower than those of the Longmaxi Formation. Compared to the Longmaxi Formation, the Qiongzhusi Formation shale has three major challenges: unclear distribution of plays with high porosity and high gas content, uncertain pore types and genesis, and unrevealed controlling factors of gas content. These challenges restrict the exploration and development of shale gas in the Qiongzhusi Formation.
This study systematically investigates the Cambrian Qiongzhusi Formation in the Sichuan Basin for its tectonic evolution and key factors controlling shale gas enrichment. By integrating core observations, well logging data, seismic interpretation, thermal simulation experiment, geochemical analysis, physical property analysis, and gas content measurement, the controls of the Deyang- Anyue aulacogen and the Leshan-Longnüsi paleouplift on shale gas enrichment in the Qiongzhusi Formation are clarified, and the “aulacogen-uplift” enrichment pattern is proposed. Furthermore, shale gas plays of the Qiongzhusi Formation are defined through precise characterization of the Deyang-Anyue aulacogen and Leshan- Longnüsi paleouplift. Combined with thermal simulation experiment and lower resistivity method, the prospects of the Qiongzhusi Formation shale gas are further discussed. This study aims to provide a theoretical basis for resource and prospect evaluation of the Qiongzhusi Formation shale, thereby facilitating its exploration and development.
1. Geological setting
The Rodinia began to break apart in the Nanhua period, initiating the evolution of the Proto-Tethys Ocean. During this period, the Sichuan Basin was situated on the northwestern margin of the Upper Yangtze Block in an extensional tectonic setting [14⇓⇓⇓⇓-19]. From the Sinian to Early Cambrian, repeated episodes of the Tongwan orogeny caused differential uplift across the basin, making the Sinian Dengying Formation suffer varying degrees of uplift and erosion. As a result, the nearly north-south- oriented Deyang-Anyue aulacogen (also known as the Mianyang-Changning extensional trough) was formed in the Changning-Neijiang-Deyang region, which laid down the sedimentary pattern in the basin. Prior to the Ordovician deposition, the Leshan-Longnüsi paleouplift began to form. It was reworked in the Caledonian and finalized in the early Hercynian. The Leshan-Longnüsi paleouplift, together with the Deyang-Anyue aulacogen, controlled the formation, adjustment, and preservation of both ancient and modern hydrocarbon reservoirs [7,14 -15].
The Qiongzhusi Formation is in conformable contact with the underlying Cambrian Maidiping Formation within the aulacogen, and in unconformable contact with the underlying Dengying Formation on the east and also the Dengying Formation in the western Weiyuan area on the west. Due to differential denudation, only a part of the Maidiping Formation remained in the west of Weiyuan, and the Qiongzhusi Formation is in conformable or unconformable contact with the Maidiping Formation in the west of Jinshi structure [16]. The lithology is primarily composed of mud shale, tuff, and siltstone, with thicknesses ranging from 100 m to 600 m and burial depths predominantly between 3 000 m and 5 000 m. The Qiongzhusi Formation is divided into the Qiong 1 and Qiong 2 members, with Qiong 1 subdivided into two submembers, Qiong 1-1 and Qiong 1-2. The Qiong 1 member exhibits high GR values (120-300 API) with 1 to 3 high GR intervals, whereas the Qiong 2 member shows lower GR values (60-240 API) with 1 high GR interval that becomes indistinct in the southern part of the aulacogen [17]. Based on lithology, paleontology, and well-logging responses, the Qiongzhusi Formation is preliminarily divided into eight layers (Fig. 1 ). Layers 1, 3, 5 and 7 consist of black shale, while layers 2, 4, 6 and 8 consist of silty shale or silty-fine sandstone. The Qiong 1-1 submember comprises layers 1 to 4, the Qiong 1-2 submember includes layers 5 and 6, and the Qiong 2 member consists of layers 7 and 8. Regionally, the stratigraphy can be correlated, and it is slightly different only in the Jinshi area due to varying lithofacies.
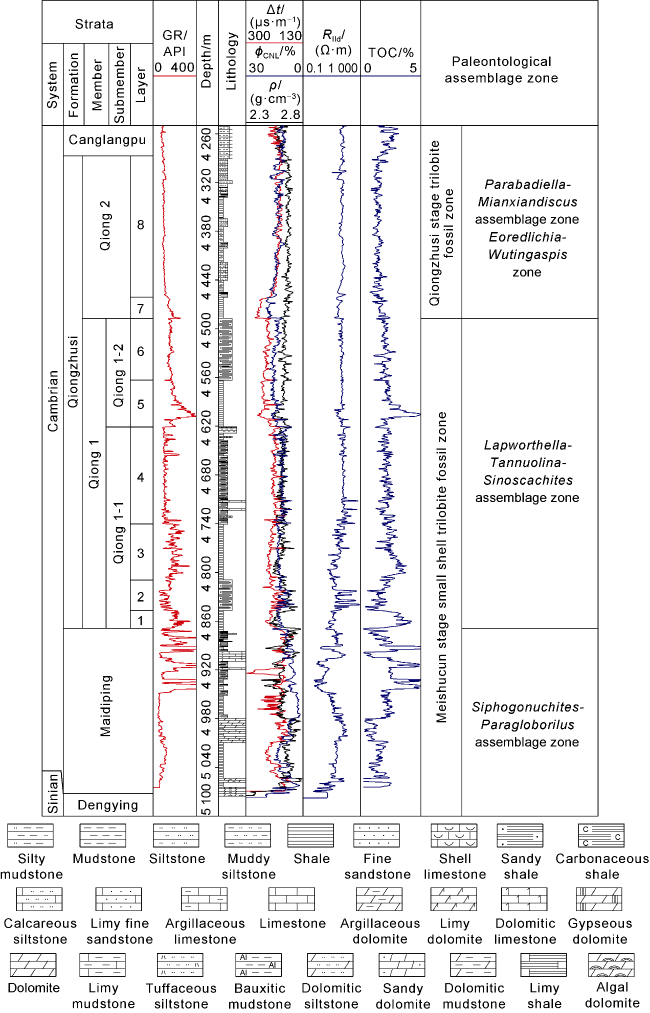
Fig. 1. Composite stratigraphic column of Well Zi 201 (modified from Reference [17]). GR—Gamma ray; Δt—interval transit time; ϕCNL—Neutron porosity; ρ—Density; Rlld—Deep lateral resistivity; TOC—Total organic carbon content. |
2. The aulacogen-uplift enrichment pattern in the Cambrian Qiongzhusi Formation
2.1. The Deyang-Anyue aulacogen controls the development of organic-rich shale
At the end of Dengying Formation deposition, the Deyang-Anyue area was uplifted due to the rising process in Episode II of the Tongwan Movement, severely denudating the Dengying Formation. The subsequent extension initially shaped an aulacogen, which subsided radially from the center. The aulacogen-centered Maidiping Formation was deposited. In the later stage, due to Episode III of the Tongwan Movement, the aulacogen experienced renewed compression and uplift, resulting in erosion of the Maidiping Formation outside the aulacogen. Then, enhanced extension led to the significant deposition and filling of the Maidiping Formation and Qiongzhusi Formation centered in the aulacogen [18⇓-20]. The aulacogen diminished and ultimately disappeared during the Canglangpu-Longwangmiao stages of the Early Cambrian. The Deyang-Anyue aulacogen exhibits a dumbbell-shape with wide north-south and narrow center in both sectional and planar views [21-22].
In this study, the formation thickness variations in and around the aulacogen in different periods are finely characterized. It is clarified that the aulacogen is zonal in the east-west direction and segmental in the north-south direction, and it controls the deposition of high-quality shale of the Qiongzhusi Formation. The east-west structural morphology of the aulacogen exerts a comprehensive control over the lateral facies variations of the Qiongzhusi Formation, while the north-south structural morphology governs the thickness distribution differences within the formation.
2.1.1. Aulacogen as the center of fine-grained sedimentation in the Qiongzhusi Formation
The aulacogen controls the distribution of strata, with a significant increase in thickness toward the north. At the end of the Dengying Formation deposition, influenced by the Tongwan Movement, the Deyang-Anyue aulacogen began to take shape. The northern part experienced intense erosion, making the Dengying Formation thin in the north and thick in the south (Fig. 2a ). Consequently, during the subsequent deposition of the Maidiping and Qiongzhusi Formations, the paleo-topography was relatively low in the northern part of the aulacogen and high in the southern part. The Maidiping and Qiongzhusi Formations are thicker and broader in the northern part, and locally denudated in the undulating southern part (Fig. 2b -2c).
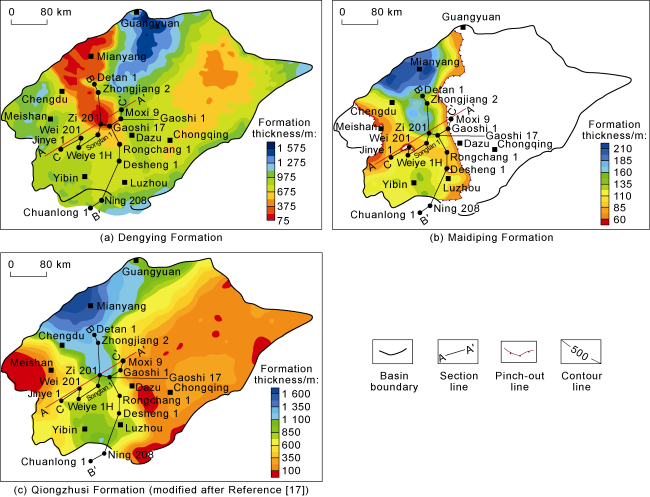
Fig. 2. Thickness distribution of the Dengying, Maidiping, and Qiongzhusi Formations in the Sichuan Basin. |
The aulacogen area as a whole presents a paleo-topography with steeper east than west and lower north than south. Influenced by the sedimentary structural differentiation within the aulacogen, the Maidiping and Qiongzhusi Formations gradually thin from the center to margin and from the northern to southern part of the aulacogen (Fig. 3 ). Within the aulacogen, the sedimentary strata are very thick, including both the Qiongzhusi and Maidiping Formations. In the northern part, the paleo-topography is relatively low, forming a deep-water quiet reduction environment conducive to black shale deposition. The overall black shales are stable and thick (570-830 m in the Qiongzhusi Formation, and 35-205 m in the Maidiping Formation). The Qiongzhusi Formation develops four sets of black shale and four sets of silty shale. In the southern part, the paleo-topography is higher, resulting in fewer sets of black shale with significantly reduced thickness in the Qiongzhusi Formation. Well Ning 208 reveals the Qiongzhusi Formation of only 251 m and the Maidiping Formation of 0-75 m thick. From inside to outside the aulacogen, the Qiongzhusi Formation is thicker than 500 m within the aulacogen, and the Maidiping Formation with large thickness is developed at the bottom. Outside the aulacogen, the Qiongzhusi Formation is thinner than 350 m, and the Maidiping Formation is generally eroded at the top or even missing in some areas (Fig. 4 ).
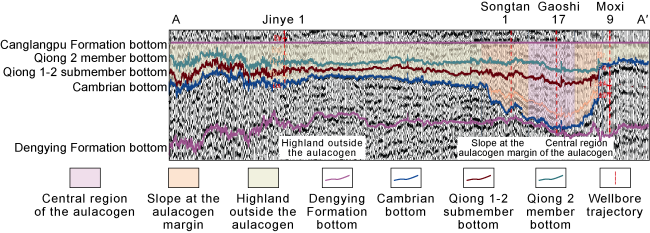
Fig. 3. Seismic section and interpretation of the Deyang-Anyue aulacogen (section location shown in |
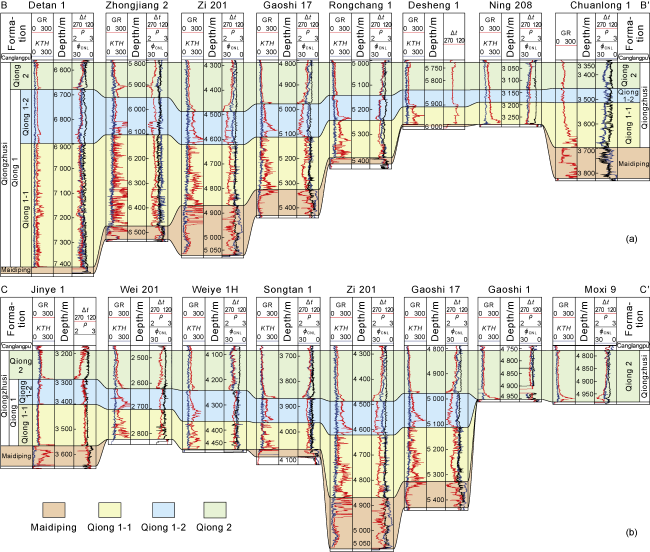
Fig. 4. North-south (a) and east-west (b) well-tie sections showing the formation thicknesses in the Deyang-Anyue aulacogen ( |
2.1.2. Aulacogen as the most favorable facies zone for black shale deposition in the Qiongzhusi Formation
The aulacogen controls the facies zones and depositional environments, which are found most favorable in deep-water zones within the aulacogen. During the deposition of the Qiong 1-2 submember, the aulacogen was in its mature stage, with sedimentary strata in wide distribution and with significant lateral differences. This study focuses on the paleogeographic features and sedimentary microfacies prior to the deposition of layer 5 of the Qiongzhusi Formation in the central part of the aulacogen. Based on seismic horizon tracing using sequence stratigraphy and geophysics, and drilling-derived geological features, the aulacogen is divided into three geomorphic units: the highland outside the aulacogen, the slope at the aulacogen margin, and the center of the aulacogen (Fig. 3 ). Morphologically, the central part of the aulacogen is also steep eastward and gentle westward, with a “steep scarp” on the east, where both morphology and sedimentary strata vary greatly, and a gentle slope on the west, with the slope gradient and seismic responses being referential for defining the boundary between the center of the aulacogen and the slope at the aulacogen margin. During the deposition of the Qiong 2 Member, the Qiongzhusi Formation was largely filled and leveled up. Using the impression method, together with seismic and drilling data of Qiong 1-2-Qiong 2, the paleogeography prior to the deposition of Qiong 1-2 was restored. The center of the aulacogen is located in the area along Wells Zhongjiang 2-Gaoshi 17, the slope at the aulacogen margin in the area along Wells Weiyuan 201-Weiye 1H, and the highland outside the aulacogen in the area around Well Jinye 1.
Based on petrological characteristics and logging facies, the sedimentary microfacies of the Qiong 1-2 submember within the aulacogen in the study area are mainly classified into deep-water mud shelf facies and deep-water muddy silt shelf facies. The aulacogen controls the distribution of the paleo-topography, which in turn governs the distribution of sedimentary microfacies. It is found that the sedimentary microfacies is primarily deep-water mud shelf in the center of the aulacogen, deep-water silty mud shelf in the slope at the aulacogen margin, and deep-water muddy silt shelf in the highland outside the aulacogen (Fig. 5 ).
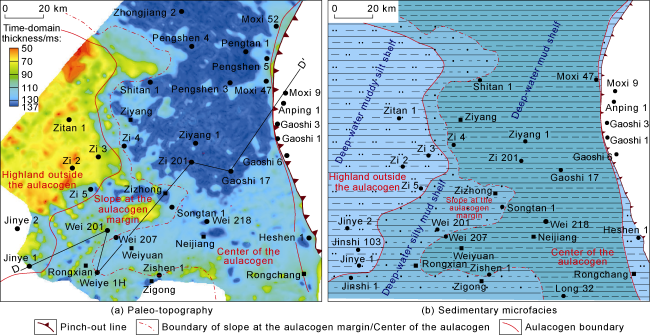
Fig. 5. Paleo-topography and sedimentary microfacies of layer 5 of the Qiongzhusi Formation. |
The deep-water mud shelf facies in the center of the aulacogen predominantly develops black siliceous shale, commonly with horizontal bedding, indicative of a strong reducing environment, and the U/Th ratio greater than 1.25. The silty mud shelf facies in the slope at the aulacogen margin mainly consists of black-gray silt-containing siliceous shale. The muddy silt shelf facies in the highland outside the aulacogen is dominated by silty shale, muddy siltstone and siltsone (Fig. 6 ).
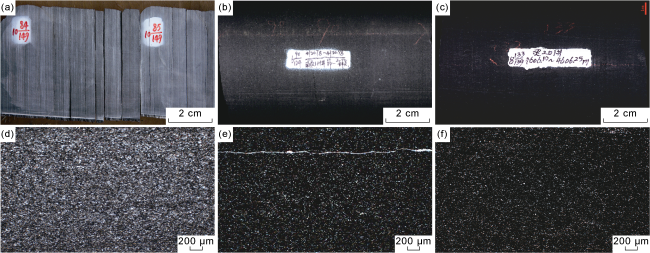
Fig. 6. Characteristics of the Qiongzhusi Formation shale in different geomorphic units in the study area. (a) Well Jinshi 103, 3 463.97 m, highland outside the aulacogen, core, gray silty shale; (b) Well Weiye 1H, 4 320.78 m, slope at the aulacogen margin, core, dark gray shale; (c) Well Zi 201, 4 606.10 m, center of the aulacogen, core, black shale; (d) Well Jinshi 103, 3 463.97 m, highland outside the aulacogen, thin section, silt-sized grains in dominance, plane-polarized light; (e) Well Weiye 1H, 4 320.98 m, thin section, mud-silt-sized grains in dominance, plane-polarized light; (f) Well Zi 201, 4 606.10 m, thin section, mud-sized grains in dominance, plane-polarized light. |
The shales within and at the margin of the aulacogen are generally darker in color, finer in grain size, and better in reducing conditions, than those outside the aulacogen. For example, the core from Well Zi 201 within the aulacogen is darker than that from Well Wei 201 at the margin; the former is predominantly black and gray-black with a grain size of approximately 15-20 μm, while the latter is mainly gray-black with a grain size of approximately 30-45 μm (Fig. 6 ).
The paleo-topography within the aulacogen controls the redox condition in waters. The U/Th ratio is used to indicate the redox level of the Qiongzhusi Formation, with U/Th>1.25 indicating a strong reducing environment and U/Th<1.25 indicating a weakly reducing environment [23]. Furthermore, the distribution of the strong reducing interval of the Qiongzhusi Formation within the aulacogen is clearly defined (Fig. 7 ). It is indicated that the strong reducing intervals are mainly concentrated within the aulacogen. For instance, the Qiongzhusi Formation in Well Zi 201 is predominantly in a strong reducing environment, with U/Th>1.25 or peaking at 4.9, and including strong reducing intervals with a cumulative thickness of 151.5 m. In Well Gaoshi 17, the strong reducing intervals are 115 m cumulatively, with a much higher degree of reduction within the aulacogen than outside the aulacogen. In Wells Wei 201 and Jinye 1 locating at the margin to outside the aulacogen, the redox conditions are generally weaker, and exhibits a strong reducing environment locally which is favorable for shale deposition and organic matter accumulation and also for hydrocarbon generation during the burial.
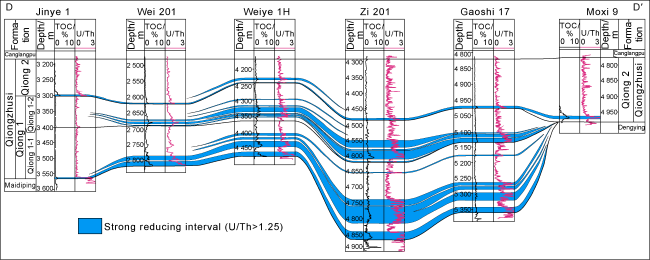
Fig. 7. Well-tie section of strong reducing intervals in the central part of the Deyang-Anyue aulacogen (section location shown in |
2.2. The Leshan-Longnüsi paleouplift delays the thermal maturation of shale
The Leshan-Longnüsi paleouplift began to take shape during the deposition of the Canglangpu Formation. Along with the Caledonian movement, the central part of the aulacogen was uplifted, and the western and eastern sides were connected to form a unified paleouplift. The aulacogen was finalized in the early Hercynian, covering an area of 64 000 km2 [14,24]. Combined with a large amount of seismic data, a detailed structural description is made for the Leshan-Longnüsi paleouplift before the Permian. Given the large extent of the paleouplift, a transitional zone being gentler from the core to the periphery exists, with a boundary at the elevation of -1800 m (Fig. 8 ). Accordingly, the control of the paleouplift on the thermal maturity is discussed.
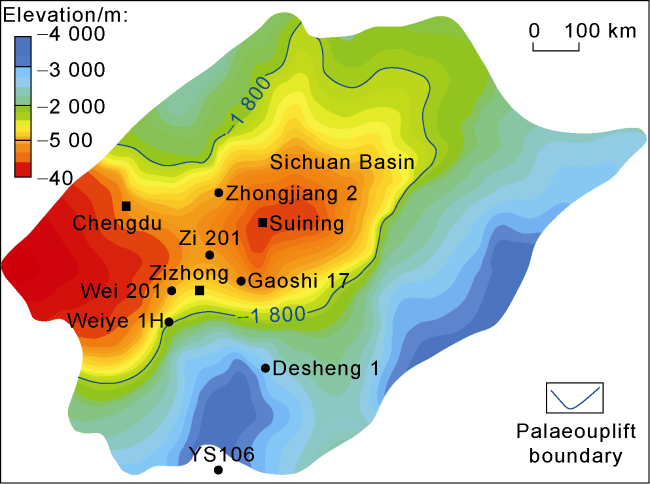
Fig. 8. Paleo-structural map of the Leshan-Longnüsi paleouplift in the Sichuan Basin prior to the Permian [17]. |
2.2.1. Relatively low thermal maturity of the Qiongzhusi Formation shale in the paleouplift area
The Leshan-Longnüsi paleouplift controls the thermal maturity of the Qiongzhusi Formation shale, with relatively low thermal maturity within the paleouplift. Thermal maturity is one of key parameters in shale gas resource evaluation. During the evolutionary process of hydrocarbon accumulation, as the burial depth increases, the shale becomes thermally mature, leading to organic matter cracking to generate shale gas. The exploration and development practices of marine shale gas in the Longmoxi Formation show that excessive thermal maturation causes a cessation of gas generation, deterioration of reservoir quality, and reduction in gas content. Thus, Ro˃3.6% is considered as the upper limit for marine shale gas exploration [9,25⇓ -27]. Meanwhile, the C-H bond of the aromatic molecules of kerogen is released, forming organic pores dominated by intermolecular pores in aromatic molecules and vesicles. The aromatized organic matters tend to be dense and orderly in structure, and the organic matter appears to have the characteristics of graphitization, leading to the reduction in gas content[28⇓-30].
The thermal maturity is primarily controlled by the burial depth and strong compaction of the formation. For the Qiongzhusi Formation marine shale, there is no organic matter of vitrinite, making the organic matter maturity evaluation impossible by using the indicators such as vitrinite reflectance (Ro). Laser Raman spectroscopy parameters for organic carbon, which are not subjected to the inhibition of vitrinite reflectance, are suitable for examining source rocks in the high-mature to overmature stage [31]. In this study, the maturity of the Qiongzhusi Formation shale reservoir is evaluated using vitrinite reflectance values calculated from Laser Raman spectroscopy parameters. The Laser Raman experiment is conducted on shale samples from different structural positions of the paleouplift. The results indicate that within the paleouplift, the Ro values of the Qiongzhusi Formation shale from wells Zhongjiang 2 and Gaoshi 17 are 3.28% and 3.58%, respectively, mainly ranging from 3.0% to 3.6%, suggesting a moderate thermal maturation stage. Outside the paleouplift, the Ro values of the Qiongzhusi Formation shale from wells Desheng 1 and YS106 are 4.12% and 4.20%, respectively, mainly ranging from 3.5% to 4.2%, and the heights of peaks D and G in the Laser Raman spectra tend to be consistent, indicating the onset of bituminization (or graphitization) stage (Fig. 9 ). This maturity distribution pattern suggests that the Leshan-Longnüsi paleouplift plays a controlling role in the thermal maturation of the Qiongzhusi Formation shale. The strata within the paleouplift remain at high paleo-topographic positions, with shallow burial and weak compaction, leading to moderate thermal maturity in the Qiongzhusi Formation, which is in the peak gas generation window.
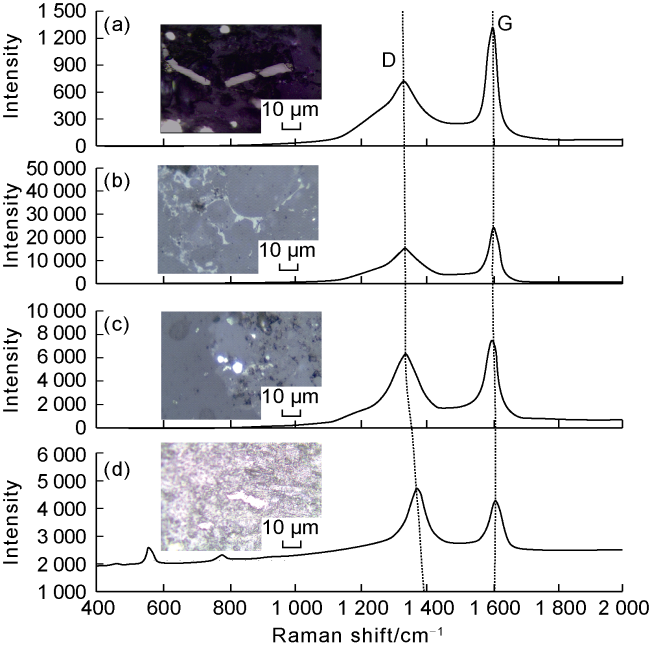
Fig. 9. Laser Raman spectroscopy results for the Qiongzhusi Formation (well locations shown in |
2.2.2. High resistivity characteristic of gas-bearing interval in shallow, low-maturity shale in the paleouplift area
The resistivity of shale is high within the paleouplift, but significantly low outside the paleouplift. Generally, high-quality shale reservoirs are characterized by high resistivity and high gas saturation. The distribution of high-resistivity shale can be used to identify prospects for shale gas exploration [32-33]. Actual drilling data show that resistivity distributions are strongly coupled with the morphology of the paleouplift. Wells deployed within the paleouplift, such as Shitan 1, Zhongjiang 2, and Zi 4, have resistivity values greater than 10 Ω·m. In contrast, Wells Desheng 1 and Gongshen 1 outside the paleouplift exhibit very low resistivity, typically less than 10 Ω·m (Fig. 10a ). Furthermore, the exploration and development practices for the Wufeng-Longmoxi shale gas in southern Sichuan Basin demonstrate that 10 Ω·m is the threshold of resistivity indicating whether shale gas can be commercially developed. Within the paleouplift, the shales generally exhibit relatively shallow burial and lower maturity, and existed at high positions during the oil and gas generation periods, being favorable for shale gas accumulation. Thus, the overall gas saturation is high, and resistivity displays a significant negative correlation with burial depth. At structural highs, the resistivity is high and the gas-bearing property is good. The 10 Ω·m resistivity corresponds to the boundary at 7 200 m. Outside the paleouplift, high temperature and pressure induced by sustained burial lead to increased maturity and water saturation; the resistivity is commonly lower than 10 Ω·m, and the 10 Ω·m resistivity corresponds to the boundary at approximately 5 500 m (Fig. 10b ).
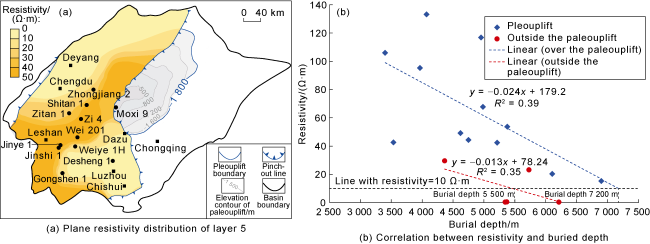
Fig. 10. Relationship between resistivity and burial depth of layer 5 in the Qiongzhusi Formation, Sichuan Basin. |
2.3. Aulacogen and paleouplift jointly control shale gas enrichment
2.3.1. Generation and enrichment evolution of the Qiongzhusi Formation shale gas under the aulacogen - uplift setting
Previous studies on the shale gas enrichment patterns in the Wufeng-Longmaxi proposed various theories, such as two-factor control on enrichment, three-factor control on enrichment, three-factor control on production, five properties integrated, and source-cap hydrocarbon-controlling [34⇓⇓⇓⇓⇓⇓-41]. Despite of differences, these theories all emphasize the impacts of structural evolution, sedimentation, and reservoir characteristics on shale gas enrichment. Based on the tectonic setting of the study area, the north-south master section through the northern, central, and southern parts of the Deyang-Anyue aulacogen is selected for analysis in this study. First of all, the maturity is measured via Laser Raman spectroscopy of core samples and restored by basin numerical simulations. Then, considering the impacts of the Deyang-Anyue aulacogen and the Leshan-Longnüsi paleouplift on the oil and gas enrichment in the Qiongzhusi Formation shale, and through analysis of several milestones including the Caledonian uplifting before and after the deposition of the Qiongzhusi Formation, and the main oil/gas generation periods and maximum paleoburial phase of source rocks, the oil and gas migration processes in different periods are restored. Finally, the aulacogen-uplift enrichment pattern of shale gas in the Qiongzhusi Formation is proposed, that is, the aulacogen controls deposition, the paleouplift controls evolution, and the aulacogen and paleouplift jointly control enrichment. This study reveals the findings in three aspects. First, the Deyang-Anyue aulacogen provides abundant sedimentary space and material foundation, leading to rich hydrocarbon sources and significant hydrocarbon generation potential in the Qiongzhusi Formation shale. Second, the Leshan-Longnüsi paleouplift, always situated at high positions, exhibits relatively small burial depths, preventing the Qiongzhusi Formation shale from excessive thermal maturation, and thus leaving good reservoirs. Third, in the aulacogen-uplift overlap area, the Cambrian bottom has a simple structure, without evidently large faults, and the Qiongzhusi Formation reflects a formation pressure coefficient generally exceeding 1.8, indicating good preservation conditions. Thus, this region is considered as the most favorable prospect (Fig. 11 ).
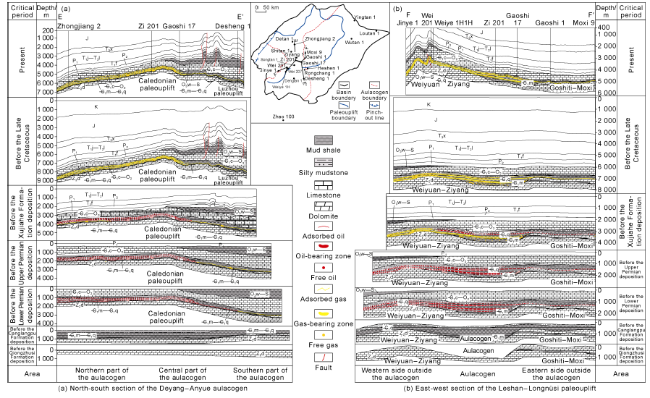
Fig. 11. Evolutionary processes and model diagram for hydrocarbon enrichment in the Qiongzhusi Formation. Z2d—Sinian Dengying Formation; —C1m—Cambrian Maidiping Formation; —C1q—Qiongzhusi Formation; —C1c—Cambrian Canglangpu Formation; O3l—Ordovician Linxiang Formation; O3w—Ordovician Wufeng Formation; S—Silurian; P1—Lower Permian; P2—Upper Permian; T1f—Triassic Feixianguan Formation; T1j—Triassic Jialingjiang Formation; T2l—Triassic Leikoupo Formation; T3x—Triassic Xujiahe Formation; J—Jurassic; K—Cretaceous). |
In the Early Cambrian, the global sea level rose rapidly, and the Sichuan Basin was generally a semi-deep to deep water shelf under a cratonic setting. The presence of the Deyang-Anyue aulacogen controlled the development of the depositional (subsidence) center and hydrocarbon generation center for the Lower Cambrian Qiongzhusi Formation. Upon the completion of uplifting in Episode II of the Tongwan Movement, the aulacogen began to experience marine transgression. Initially, due to the relatively low sea level, the Maidiping Formation in the center of the aulacogen accumulated thick strata, thinning outward, and this layer acted as the sealing layer at the base of the Qiongzhusi Formation shale gas reservoir within the aulacogen. Subsequently, as the relative sea level rose, the overall depositional environment within the aulacogen became favorable as deep-water siliceous mud shelf, depositing the thickest, organic-rich shale in the Qiongzhusi Formation, conducive to the deposition of high-quality shale.
During the Late Cambrian to Ordovician, the Maidiping Formation and Qiongzhusi Formation source rocks within the aulacogen entered the oil generation window. Oil began to generate and migrated along regional unconformities toward the Weiyuan-Ziyang and Gaoshiti- Moxi low uplifts at the sides of the aulacogen, as well as towards the Dengying and Longwangmiao Formations.
From the end of Late Ordovician to the Silurian, the Sichuan Basin stayed in the Caledonian tectonic cycle. The central part of the basin began to uplift under the compressional stress, forming the Leshan-Longnüsi paleouplift. Wells Desheng 1 and Zhongjiang 2 in low-lying areas simultaneously supplied hydrocarbons to both sides of the aulacogen and the Caledonian paleouplift where Well Zi 201 is located. In the southern part, Well Desheng 1 reveals a rapid thermal maturation due to its greater burial depth, reaching high maturity to over-maturity, thus hydrocarbon accumulation likely occurred earlier than that in the northern part.
From the Early to Late Permian, the Maidiping Formation and Qiongzhusi Formation source rocks became further mature, accompanied with increasing quantity of hydrocarbons generated. In the southern part of the aulacogen, the source rocks had reached the high to over mature stage, while the source rocks of the Qiongzhusi Formation in the Weiyuan area became high mature to initially generate a large volume of oil, and the Weiyuan-Ziyang area captured substantial oil and gas, enlarging the scale of ancient oil reservoirs.
From the end of the Permian to the Late Triassic, the Sichuan Basin as a whole was in a stable subsidence stage. Meanwhile, influenced by high heat flow from the Emei mantle plume in the Late Permian, the Lower Cambrian source rocks commonly and rapidly reached medium to high maturity and began to generate and expulse hydrocarbons massively. Two highs of the Leshan-Longnüsi paleouplift, i.e. the Ziyang structure and the Gaoshiti- Moxi structure, continued to receive substantial hydrocarbon charging. Additionally, the Weiyuan area had already entered the stage of cracking to generate gas, and the northern and central parts of the aulacogen and the Gaoshiti area also witnessed condensate oil and wet gas generation. During this period, the Qiongzhusi Formation within the Caledonian paleouplift experienced a process of self-generating and self-preserving of hydrocarbons, and was also supplied with hydrocarbons from the source rocks within the aulacogen. As a result, widespread overpressure appeared across the Qiongzhusi Formation due to hydrocarbon generation.
From the Middle-Late Triassic to the Early Cretaceous, there was no significant tectonic reorganization in the Weiyuan-Gaoshiti-Moxi area. The high point of the Ziyang-Weiyuan structure remained in the Ziyang part, and on the slope of the southern wing of the ancient structure. With the deposition of the Jurassic and Cretaceous strata, the burial depth of the Qiongzhusi Formation exceeded 6 000 m, and the source rocks extensively became over-mature and began to generate gas by cracking. In this stage, the gas generation process caused expansive hydrocarbon migration and diffusion, until shale gas was enriched in the entire Qiongzhusi Formation. In the southern part of the aulacogen (e.g. Well Desheng 1), where the over-mature stage appeared early, the source rocks reached the limit of gas generation by cracking and ceased further hydrocarbon generation. Coupling with the presence of faults in this area, the situation likely affected the preservation conditions of ancient gas reservoirs in the Qiongzhusi Formation (Figs. 8 and 9 ).
From the Late Cretaceous to the present, the Sichuan Basin has experienced an intense northwest-southeast compression since the Cenozoic. The tectonic uplift caused the rapid formation of the Weiyuan anticline in the core of the Leshan-Longnüsi paleouplift, and the Ziyang area became a secondary anticline on the northern flank of the Weiyuan anticline. Early accumulated natural gas in the Ziyang structure migrated to and accumulated in the structural highs of the Weiyuan anticline, while natural gas in the Gaoshiti-Moxi area underwent local adjustments. The Weiyuan area experienced intense tectonic activity, with an uplift and erosion of nearly 4 000 m, exposing the Triassic strata directly to the surface, and significantly reducing the sealing capacity of cap rocks. This period also witnessed the formation of faults that cut through the Qiongzhusi Formation. Such faults allowed natural gas to leak and dissipate from the Dengying Formation. As a result, the overall pressure coefficient in the Weiyuan anticline reduced upwards. The pressure in Well Wei 201 is currently at a normal level. The Gaoshiti-Moxi area experienced minimal structural adjustments, impacting less the overpressure and gas reservoir preservation conditions. In the early stage, the Weiyuan-Ziyang area was even deeper and experienced a faster thermal maturation of source rocks than that in the Gaoshiti-Moxi area. Later tectonic uplift and fault conditions caused differential shale gas enrichment in the eastern and western sides of the aulacogen.
The key factors for the large-scale gas enrichment in the Qiongzhusi Formation include favorable deposition conditions, moderate thermal maturity, and stable, weak structural modification. The aulacogen-uplift overlap area, always staying along the hydrocarbon migration pathways, exhibits good reservoirs and overall tectonic stability, offering the best exploration potential.
2.3.2. Joint control of aulacogen-uplift on reservoir development
Using core samples early taken from wells bypassing the Qiongzhusi Formation, this study employed high-precision scanning electron microscopy (SEM) and large- area high-resolution imaging techniques to quantitatively assess the organic pores, inorganic pores, organic fractures, and inorganic fractures, with an overall scanning resolution of 4 nm. Results indicate that inorganic pores are generally more developed than organic pores in the Qiongzhusi Formation, exhibiting larger pore diameters and weaker compaction effects in the overlap area. The overlap area has remained at a high structural position, with relative tectonic stability, weak diagenesis and late tectonism, and overall favorable pore structure. Both organic and inorganic pores are well-developed. Shale mineral particles are predominantly in point and planar contacts, creating numerous mineral intergranular pores and resulting in high porosity. At Well Zhongjiang 2, organic pores correspond to a plane porosity of 0.71% and diameters of 50-200 nm, and inorganic pores to a plane porosity of 1.12% and diameters of 0.1-4.0 μm. At Well Gaoshi 17, organic pores reflect a plane porosity of 1.13% and diameters of 50-200 nm, and inorganic pores reflect a plane porosity of 1.90% and diameters of 0.1-4.0 μm. At the edge of the overlap area, as a result of intensified diagenetic compaction, mineral particles exhibits concave-convex contact, in addition to planar contact, with a slightly less porosity than the center of the overlap area. For example, at Well Wei 201, organic pores exhibit a plane porosity of 0.43% and diameters of 50-150 nm, and inorganic pores show a plane porosity of 0.89% and diameters of 0.08-3.50 μm. Outside the overlap area, due to compaction along with sustained burial, mineral particles are primarily in concave-convex and suture contacts, without presence of pores, leading to a low porosity. For example, at Well Ning 208, organic pores have the plane porosity of 0.23% and diameters of 50-120 nm, and inorganic pores have the plane porosity of 0.56% and diameters of 0.05-4.00 μm (Fig. 12 ).
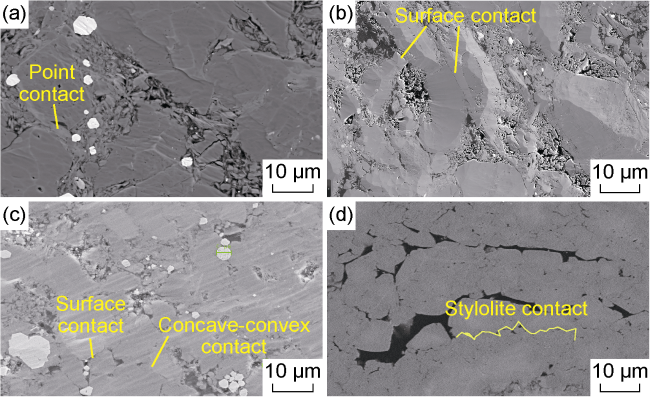
Fig. 12. Diagenetic differences inside and outside the aulacogen-uplift overlap area. (a) Well Zhongjiang 2, inside the overlap area, layer 5, SEM; (b) Well Gaoshi 17, inside the overlap area, layer 5, SEM; (c) Well Wei 201, at the edge of the overlap area, layer 5, SEM; (d) Well Ning 208, outside the overlap area, layer 5, SEM. |
Under the aulacogen-uplift control, the Qiongzhusi Formation in the overlap area exhibits optimal reservoir quality. Vertically along the aulacogen from north to south, porosity, total gas content, and gas saturation increase and then decrease. Similarly, along the paleouplift from west to east, porosity and total gas content increase and then decrease. A relatively high gas saturation is observed within the paleouplift. Wells with the highest reservoir parameters in the Qiongzhusi Formation are all situated in the aulacogen-uplift overlap area. Inside this area, the porosity ranges from 3.0% to 4.5%, total gas content of 5-8 m3/t, and gas saturation exceeds 70%. Outside this area, the porosity is 1.5%-3.0%, total gas content is 1.5-4.0 m3/t, and gas saturation falls below 70%. Clearly, the reservoir parameters are superior inside the overlap area (Table 1 ), suggesting good reservoir conditions of the Qiongzhusi Formation.
Table 1. Log-interpreted reservoir parameters of layer 5 of the Qiongzhusi Formation in the Sichuan Basin |
| Structural location | Well | TOC/% | Porosity/% | Total gas content/(m3∙t-1) | Gas saturation/% | |
|---|---|---|---|---|---|---|
| Along the axis of the aulacogen | Inside the overlap area | Detan 1 | 2.00 | 3.67 | 5.00 | 56.95 |
| Zhongjiang 2 | 3.00 | 3.43 | 2.97 | 51.39 | ||
| Shitan 1 | 2.80 | 3.99 | 7.29 | 73.02 | ||
| Ziyang 1 | 2.70 | 4.39 | 7.49 | 71.35 | ||
| Zi 201 | 2.80 | 4.57 | 7.54 | 74.03 | ||
| Gaoshi 17 | 2.60 | 4.68 | 8.23 | 72.75 | ||
| Outside the overlap area | Rongchang 1 | 4.20 | 3.26 | 1.89 | 35.00 | |
| Desheng 1 | 2.70 | 3.15 | 1.77 | 25.00 | ||
| Zhao 103 | 2.00 | 3.64 | 1.69 | 54.87 | ||
| Along the axis of the paleouplift | Inside the overlap area | Wei 201 | 2.90 | 1.90 | 2.42 | 75.79 |
| Wei 207 | 2.50 | 3.33 | 4.49 | 74.65 | ||
| Songtan 1 | 2.30 | 3.39 | 5.28 | 76.33 | ||
| Ziyang 1 | 2.70 | 4.39 | 7.49 | 71.35 | ||
| Zi 201 | 2.80 | 4.57 | 7.54 | 74.03 | ||
| Gaoshi 17 | 2.60 | 4.68 | 8.23 | 72.75 | ||
| Outside the overlap area | Gaoshi 1 | 1.90 | 2.47 | 2.22 | 69.84 | |
| Moxi 9 | 2.10 | 3.87 | 6.94 | 73.68 | ||
| Outside of the aulacogen and paleouplift | Wutan 1 | 2.30 | ||||
| Loutan 1 | 2.80 | |||||
| Yingtan 1 | 2.80 | |||||
Note: The structural locations of wells are shown in |
The overlap area is dominated by deep-water mud shelf and silty mud shelf facies, which favor organic matter accumulation. Inside the overlap area, TOC values generally exceed 2%, indicating an abundance of organic-rich black shale with significant hydrocarbon generation potential. Additionally, the organic matter within the paleouplift exhibits lower thermal maturity than that outside the paleouplift, alongside high resistivity, suggesting that the Qiongzhusi Formation shale is at the peak of gas generation. Furthermore, the hydrocarbon generation in the Qiongzhusi Formation creates an overpressure condition, while in the structurally stable overlap area with no large deep faults the pores are highly resistant to compaction, facilitating the self-generation and self-perversion of shale gas in the Qiongzhusi Formation. Thus, the Qiongzhusi Formation displays overall excellent reservoir parameters, supporting the formation of extensive, gas-rich, high-quality shale reservoir conditions.
2.3.3. Good preservation conditions of the Qiongzhusi Formation shale gas in the aulacogen-uplift overlap area
The top of the Qiongzhusi Formation is generally comprised of relatively dense muddy siltstone or mud- bearing limestone, with considerable thickness, low porosity, and low permeability, which serve as an effective seal for the underlying shale gas. The overlying Canglangpu Formation consists of quartzitic sandstone, yellow sandy shale, greenish-gray argillaceous sandstone, thin limestone, and micritic dolomite. The micritic dolomite in the Canglangpu Formation is notably dense [44], with substantial thickness and extensive distribution, making it a suitable regional roof.
Within the overlap area, beneath the Qiongzhusi Formation, there are the Dengying and Maidiping Formations. The Maidiping Formation predominantly comprises siliceous dolomite, phosphatic dolomite, phosphorite, and phosphatic limestone, all dense lithologies that impede hydrocarbon migration from the Cambrian into the Dengying Formation. This barrier effect results in a high gas content, up to 15 m3/t, in layer 1. From the edge of the overlap area to outside the overlap area, the Maidiping Formation is significantly thinner or absent in most areas. In the core of the Weiyuan anticline, the Qiongzhusi Formation unconformably contacts the Dengying Formation. Here, the top of the Dengying Formation comprises ancient karst reservoirs with good physical properties, facilitating hydrocarbon diffusion towards the bottom under concentration gradients and resulting in poor floor conditions. This leads to a generally lower gas content of layer 1 than 2 m3/t (Fig. 13 ). Geochemical evidence further indicates that the gas source for the underlying Dengying Formation is the Qiongzhusi Formation [8,45⇓ -47], exemplifying a typical reservoir-caprock assemblage with upper seal and downward seepage, which is detrimental to shale gas preservation. In the overlap area, the pressure coefficient exceeds 2.0 primarily, indicating pervasive overpressure and gas-rich conditions. This favorable preservation is primarily due to the good roof and floor conditions within the overlap area, which are conducive to shale gas preservation in the Qiongzhusi Formation.
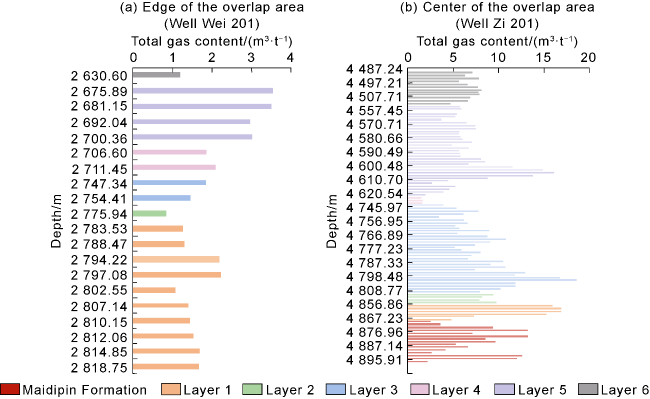
Fig. 13. Total gas content in representative wells. |
Summarily, the deposition, reservoir, and tectonic evolution conditions in the overlap area of the Deyang-Anyue aulacogen and Leshan-Longnüsi paleouplift are good, which is conducive to shale gas enrichment in the period of deposition-oil generation-gas generation-adjustment. This overlap area is considered as the most ideal prospect.
3. Prospects of shale gas exploration
3.1. Prediction of favorable exploration targets
3.1.1. Division of favorable zones
Based on the four combinations of the Deyang-Anyue aulacogen and the Leshan-Longnüsi paleouplift, namely, aulacogen-uplift overlap, aulacogen outside & uplift inside, uplift outside & aulacogen inside, and aulacogen outside & uplift outside, along with the sedimentary environment, reservoir quality, and preservation conditions of the Qiongzhusi Formation, the Qiongzhusi Formation of the Sichuan Basin is divided into 6 subclasses of prospects under 4 classes (Fig. 14 ).
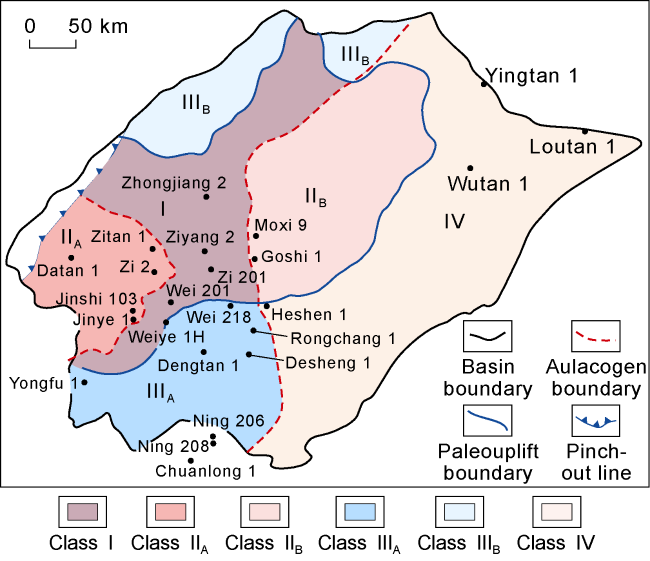
Fig. 14. Division of favorable zones in the Qiongzhusi Formation of the Sichuan Basin. |
Class I: The overlap area of the aulacogen and paleouplift is defined as Class I prospect, covering an area of approximately 23 000 km2. This prospect has favorable sedimentary conditions and moderate thermal maturity, and it is the most favorable exploration target in the Sichuan Basin for the Qiongzhusi Formation. Well Zi 201, a typical well in this prospect, reveals a porosity of 4.8% and a total gas content of 7.5 m3/t.
Class II: Exploration practices in the Longmoxi Formation have shown that shale with favorable sedimentary environment and high organic matter abundance exhibits poor gas content when its thermal maturity is too high [27,48]. Therefore, good sedimentary conditions may not necessarily match good reservoir quality, while over-maturity often corresponds to poor reservoir quality. Inside the paleouplift, the Qiongzhusi Formation generally shows moderate thermal maturity, high resistivity, and high gas content. Outside the paleouplift, the Qiongzhusi Formation, even within the aulacogen, has extremely high thermal maturity, low resistivity, and poor gas content. When the aulacogen or the uplift alone is considered, the thermal evolution controlled by the paleo-uplift is more important than the sedimentation controlled by the aulacogen. Therefore, the paleouplift area outside the aulacogen is assigned as Class II prospect, covering approximately 20 000 km2. Furthermore, the Qiongzhusi Formation reflects superior sedimentary thickness and reservoir quality inside the paleouplift at the western side of the aulacogen to the eastern side. Thus, the paleouplift at the western side of the aulacogen is assigned as Class IIA prospect, covering an area of approximately 12 000 km2, where Well Jinshi 103 reveals the Qiongzhusi Formation having a thickness of 365 m, porosity of 3.8%, and total gas content of 5.5 m3/t. The paleouplift at the eastern side of the aulacogen is assigned as Class IIB prospect, where Well Moxi 9 reveals the Qiongzhusi Formation having a thickness of 252 m, porosity of 3.5%, and total gas content of 4.5 m3/t.
Class III: Following the principles for the division of Class II, the non-paleouplift areas within the aulacogen are assigned as Class III prospects. The areas outside the paleouplift have undergone continued deep burial, leading to excessively high thermal maturity, which may result in graphitization, low resistivity, and low gas content. In the northern part of the aulacogen, the Qiongzhusi Formation lies at a depth of 6 000-9 500 m, which exceeds the current technical feasibility for exploration. In the southern part, the Qiongzhusi Formation is at a shallower depth of 4 000-6 500 m. Therefore, the southern part of the aulacogen is assigned as Class IIIA prospect, covering an area of approximately 18 000 km2. Typically, Well Rongchang 1 reveals that layer 5 of the Qiongzhusi Formation, at a depth of 5 342 m, has a Laser Raman maturity of 3.80%, porosity of 3.26%, and total gas content of 1.89 m3/t; Well Desheng 1 demonstrates the layer at 5 950 m with the Laser Raman maturity of 4.12%. These data indicate excessive maturity and poor reservoir quality in this prospec. The areas outside the paleouplift in the northern part of the aulacogen are assigned as Class IIIB, where the Qiongzhusi Formation lies at depth greater than 7 500 m, possibly with high maturity and deteriorated reservoir quality.
Class IV: The areas outside the aulacogen and paleouplift of the Sichuan Basin are assigned as Class IV prospects. These areas are primarily located in the eastern part of the basin, where the Qiongzhusi Formation is generally deep (deeper than 6 500 m), covering an area of approximately 56 000 km2. Typical wells in these prospects, such as Wutan 1, Loutan1, and Yingtan 1, reveal the Qiongzhusi Formation generally at the depth of 6 700-7 300 m. Specifically, the Qiong 1-2 shale has the average porosity of 2.3%, 2.8%, and 2.8% in, respectively. This indicates that the shale with relatively poor original sedimentary conditions has significantly deteriorated properties after re-experiencing a deep burial. Thus, the non-aulacogen and non-paleouplift areas of the Sichuan Basin represent Class IV prospect with the least exploration potential.
3.1.2. Division and evaluation of sweetspot zones
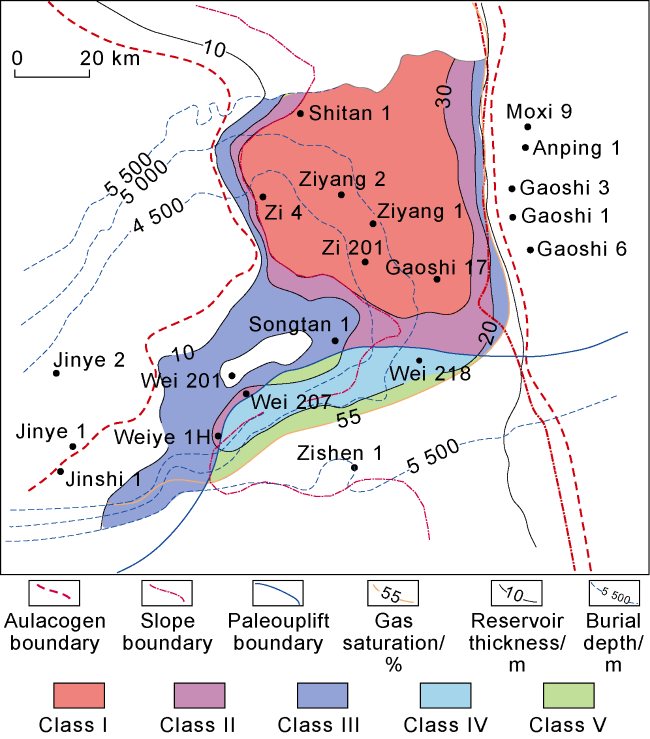
The Qiongzhusi Formation shale is controlled by the aulacogen. Within the aulacogen, deep-water shelf facies deposits predominate. In sedimentary environments characterized by large water depths and strong reductive conditions, large quantities of black fine-grained mud shale can be deposited. Shale reservoir thicknesses are generally greater than 40 m. Due to the continuous uplift of the paleouplift and its relatively higher position, the very thick shale reservoirs exhibit moderate maturity, corresponding to a better hydrocarbon generation potential. Taking into account the sweetspot evaluation practices for the Longmoxi Formation and the current drilling and reservoir stimulation technologies, factors such as reservoir thickness, gas saturation, and burial depth are incorporated into the criteria for defining sweetspot zones. Accordingly, a shale gas sweetspot zone evaluation criterion is established for the Qiongzhusi Formation. It includes the indicators as follows: (1) reservoir thickness greater than 10 m; (2) gas saturation greater than 55%; and (3) burial depth less than 5 500 m. Based on reservoir thickness, the central part of the aulacogen is divided into five classes of sweetspot zones (Fig. 15 ). The favorable sweetspot zones below 5 500 m cover an area of 8 200 km2, with total shale gas resources of 4.8×10¹² m3. Class I sweet spot zones are located within the aulacogen-uplift overlap area and have a reservoir thickness greater than 30 m, covering 4 400 km2. Class II sweet spot zones are within the overlap area and have a reservoir thickness greater than 20 m, covering 1 200 km2. Class III sweet spot zones are within the overlap area and have a reservoir thickness greater than 10 m, covering 1 400 km2. Class IV sweet spot zones are developed outside the overlap area (non-paleouplift area within the aulacogen), with a reservoir thickness greater than 20 m, covering 800 km2. Class V sweet spot zones are found outside the overlap area (non-paleouplift area within the aulacogen), with a reservoir thickness greater than 10 m and gas saturation greater than 55%, covering 400 km2 (Fig. 15 ).
Fig. 15. Sweespot zone evaluation for layer 5 of the Qiongzhusi Formation in the Deyang-An’yue aulacogen. |
3.2. Exploration and achievements
3.2.1. Major strategic breakthroughs in exploration
By applying the aulacogen-uplift enrichment pattern, the exploration potential of the Lower Cambrian Qiongzhusi Formation shale gas within the aulacogen-uplift overlap area (Well Ziyang 201, Fig. 1 ) and at the edge of the overlap area (Well Weiye 1H) has been confirmed.
Well Zi 201 is located in the Weiyuan structure. Class I+II Qiongzhusi Formation shale reservoirs are 42 m thick continuously, with TOC of 2.8%, porosity of 4.8%, total gas content of 8.0 m3/t, and brittle mineral content of 79.3%. The well has the vertical depth of 4 608 m, and the horizontal length of 1 800 m. The target drilling rate is 100%. The fracturing operation involved 29 stages, totally 1 795 m, with an average fluid injection intensity of 42.4 m3/m, and an average proppant injection intensity of 3.8 t/m. The well achieved a tested gas production rate of 73.88×10⁴ m3/d using 13 mm nozzle and at a stable wellhead pressure of 47.8 MPa, marking the first high- yield industrial gas flow from shale reservoirs deeper than 4 500 m in the Cambrian in China. The well was put on stream on June 11, 2023, and has produced approximately 500 d to date. Currently, it is well performed in production, with a casing pressure of 41 MPa. In the first year of production, it achieved an average daily gas production of 11.22×10⁴ m3, and a cumulative production of 5 800×104 m3, with a flowback rate of 33.6% and the estimated ultimate recovery (EUR) of 2.1×10⁸ m3.
Well Weiye 1 is located in the Weiyuan structure. Class I+II Qiongzhusi Formation shale reservoirs are 18 m thick continuously, with TOC of 2.7%, porosity of 3.7%, total gas content of 6.3 m3/t, and brittle mineral content of 67.5%. The well has the vertical depth of 4 332 m, and the horizontal length of 1 800 m. The target drilling rate is 100%. The fracturing operation involved 29 stages, totaling 1 716 m, with an average fluid injection intensity of 38.8 m3/m and an average proppant injection intensity of 3.9 t/m. Its production rate is tested to be 38.6×10⁴ m3/d, marking a new breakthrough in shale gas exploration in the Sichuan Basin in 2023. The well was put into production on May 9, 2023, and has produced for approximately 550 d to date, with the casing pressure of 4.9 MPa. In the first year of production, it achieved an average daily gas production of 10.4×10⁴ m3 and a cumulative production of 5 400×104 m3, with a flowback rate of 44.37%. Currently, it is well performed with stable production, a decline in liquid production, a minor pressure drop rate, and the EUR of 1.36×10⁸ m3.
Both Wells Zi 201 and Weiye 1H have confirmed that the aulacogen-uplift overlap area contains optimal reservoirs, which are conducive to shale gas enrichment, thereby validating the immense potential of deep shale gas in the Cambrian Qiongzhusi Formation.
3.2.2. Extended application and results
Under the guidance of the aulacogen-uplift enrichment pattern, and with the significant breakthrough in deep to ultra-deep shale gas exploration at Wells Zi 201 and Weiye 1H, the exploration and development of shale gas in the Sichuan Basin has shifted significantly in trend, orientation and landscape.
Firstly, the exploration focus has shifted from the Longmoxi Formation alone to both the Longmoxi and Qiongzhusi Formations. This has driven a research and exploration boom in the Qiongzhusi Formation shale gas both in the Sichuan Basin and its surrounding areas. Both China National Petroleum Corporation (CNPC) and China Petroleum & Chemical Corporation (Sinopec) have accelerated their shale gas exploration and evaluation in the Qiongzhusi Formation of the Sichuan Basin, recognizing it as a key target for increasing reserves and production [17,49]. CNPC is evaluating shale gas exploration and development potential in the Qiongzhusi Formation by facies, burial depth, and layers, and has deployed over 20 exploratory and apparisal wells. For example, Well Wei 218, which has been cored and is located in Class IIIA prospect, reveals that the shale in layer 5 of the Qiongzhusi Formation has the thickness of 7.5 m, average TOC of 2.9%, average porosity of 3.5%, average water saturation of 38.2%, average gas content of 4.8 m3/t, and resistivity of 2.6 Ωm. These results confirm that, in the areas outside the paleouplift, shales remain at relatively low structural positions and have always been affected by continued deep burial, leading to remarkably increased thermal maturity, and reduced porosity, resistivity, and gas content, together with a further validated boundary of the aulacogen-uplift overlap area. Sinopec has deployed Well Ziyang 2 (19 km from Well Zi 201) in Class I prospect within the aulacogen-uplift overlap area, which achieved a tested production rate of 125.7×10⁴ m3/d, and Well Jinye 3 in Class IIA prospect, which achieved 82.6×10⁴ m3/d. This further proves that the aulacogen-uplift overlap area contains optimal reservoirs with the best gas content, making the area the most favorable prospect for shale gas exploration and development.
Secondly, the exploration depth in the Sichuan Basin has shifted from mid-deep strata to ultra-deep strata. Guided by the aulacogen-uplift enrichment pattern, CNPC has been further devoted to exploring and evaluating ultra-deep strata, and has confirmed the Longmaxi Formation and Upper Permian Wujiaping Formation as the most favorable targets for ultra-deep exploration, for which significant breakthroughs have been achieved recently. For the Longmaxi Formation, Well Lu 226 in the Luzhou area, with a depth of 4 563 m, has been tested with a production rate of 52.1×10⁴ m3/d and EUR of 1.42×10⁸ m3. For the Wujiaping Formation, Well Da 201 in the Daye 1 well block, with a depth of 4 560 m, revealed a test production rate of 56.27×10⁴ m3/d.
3.3. Risks and challenges
Within the aulacogen-uplift overlap area, the Qiongzhusi Formation mainly develops four sets of black shale and four sets of silty shale, with large reservoir thickness. These shales require further evaluation on reservoir characteristics, controlling factors and differences. Regarding the superimposition of multiple reservoirs, further research and testing are necessary to evaluate the potential and strategy of three-dimensional development for the Qiongzhusi Formation. As the Qiongzhusi Formation belongs to the Lower Cambrian, the shale is generally deeply buried, making it a deep and ultra-deep shale gas exploration target. The lower depth limit for gas accumulation in the overlap area has posed new challenges to engineering technology. In terms of drilling, the ultra-deep strata present challenges such as multi-pressure system, long open-hole section, and higher temperature in deep to ultra-deep horizontal well target sections. Under these conditions, the rotary steering drilling technique is inapplicable, and drilling tools/processes need to be improved. In terms of reservoir stimulation, the plasticity of rocks is increased under high temperature and stress conditions, and in-depth research is required into volume fracturing and complex fracture network formation in deep to ultra-deep strata.
4. Conclusions
Through the study of the Qiongzhusi Formation in respect of structural evolution and factors controlling shale gas enrichment, the controls of the Deyang-Anyue aulacogen and Leshan-Longnüsi paleouplift on shale gas enrichment in the Qiongzhusi Formation are clarified, and the aulacogen-uplift enrichment pattern is proposed.
The east-west distribution of the aulacogen controls the sedimentary facies. The center of the aulacogen is dominated by deep-water mud shelf facies, the slope at the aulacogen margin mainly consists of deep-water silty mud shelf facies, and the highland outside the aulacogen is characterized by shallow-water silt shelf and deep- water muddy silt shelf facies. The margin and interior of the aulacogen, where deep-water shelf is developed in deep-water anoxic ring-zones, is the most favorable sedimentary site for black shale. The north-south distribution of the aulacogen controls the sedimentary thickness of the Qiongzhusi Formation, which is low in the north and high in the south.
The paleouplift controls the thermal maturation of the Qiongzhusi Formation shale. Paleouplifting led to the rising of the Qiongzhusi Formation, with lower lithostatic pressure and geothermal gradient than those at the uplift margin, in addition to smaller burial depth and weaker compaction. In the center of the paleouplift, the shale has lower organic maturity and no significant graphitization characteristics. Under the joint control of thermal maturity and burial depth, the resistivity is higher in the center of the paleouplift than in areas outside the paleouplift, suggesting that the Qiongzhusi Formation shale in the center of the paleouplift has moderate thermal maturity and burial depth, that is, favorable shale reservoir conditions.
The aulacogen and paleouplift jointly control shale gas enrichment. Shale gas in the Qiongzhusi Formation is enriched extensively in the overlap area. The aulacogen-uplift overlap area is characterized by good sedimentary conditions, moderate thermal maturity, and stable, weak modification, which favor large-scale hydrocarbon generation and gas enrichment in the Qiongzhusi Formation. Effective porosity, gas-bearing property, TOC, and gas content are all favorable in the overlap area. Within the overlap area, there are typically four sets of reservoirs, with large thicknesses and high quality. Outside the overlap area, 1 to 3 sets of reservoirs are recognized, which are generally thinner (less than 100 m) than those within the overlap area. The overlap area exhibits a pressure coefficient greater than 2.0, with overpressure, gas-rich conditions, due to the presence of the Maidiping Formation as a bottom seal and the dense black shale and Canglangpu Formation as the high-quality roof. Moerover, no large and deep faults have been found in the overlap area. The structural conditions are relatively simple, providing good preservation conditions for the Qiongzhusi Formation shale gas in the overlap area.
Guided by the aulacogen-uplift enrichment pattern, four classes of shale gas prospects are identified, with the aulacogen-uplift overlap area being the most favorable one. The preferred sweetspot zones below 5 500 m covers an area of 8 200 km2 with resource quantity of 4.8×10¹² m3. Wells Zi 201 and Weiye 1H deployed within and at the edge of the overlap area have already achieved strategic breakthroughs. These results confirm that the aulacogen-uplift overlap area contains optimal reservoirs for shale gas enrichment. The deep to ultra-deep strata of the Cambrian Qiongzhusi Formation are believed to have a huge potential of shale gas.