

Introduction
The 3-year COVID-19 pandemic came to an end in 2023, but the world is still undergoing major changes unseen in a century, global security challenges are being complicated by the escalation of the Russia-Ukraine conflict, the resumption of the Israeli-Palestinian conflict, and the frequent occurrence of major regional security concerns, and the global oil and gas landscape is undergoing profound adjustments [1-2]. Due to factors such as concerns about conflict spillovers, uncertainty about global growth prospects, and substantial increases in oil production in non-OPEC (Organization of the Petroleum Exporting Countries) oil-producing countries such as the United States of America (USA), international oil prices generally showed a trend of “fluctuating within a certain range in the first half of the year and spiking followed by declining in the second half of the year” in 2023 [3]. Affordability and security concerns arising from the global energy crisis have drawn the attention of governments and energy companies to focusing more on the development of low-carbon energy technologies [4]. Under this background, the operation strategies of international oil companies exhibit the following new trends: more focus on corporate competitiveness, proactive strategic adjustment, upsurge in the number of oil and gas mergers and acquisitions, steady growth in the total amount of upstream investments, refocusing on core businesses, and overall consideration of the green energy transition and energy security. In the current context where the world faces greater instability and uncertainty and geopolitical tensions and their spillover effects continue to increase, Chinese oil companies should put energy security first and build integrated energy systems while ensuring energy supply. On the one hand, despite the strong growth in global investment related to the energy transition, major international oil companies are still re-strengthening their upstream businesses, setting higher goals for oil and gas investment and production, and actively participating in oil and gas mergers and acquisitions [5]. Onshore conventional oil and gas resources will remain dominant for a certain period of time in the future. Unconventional oil and gas resources can generate substantial economic benefits and play an important role in supplementing conventional oil and gas resources, and offshore oil and gas resources have huge potential for high-yield and low-carbon development [6]. On the other hand, in addition to oil and gas resources, the utilization of associated resources has received increasing attention. With the promotion of environmental awareness and the advancement of science and technology, the demand for electric vehicles and batteries has been growing rapidly, leading to a significant increase in the global demand for lithium, and major international oil companies have successively entered the lithium metal industry. Owing to its large reserves, zero pollution and high calorific value, hydrogen energy plays an important role in the energy transition process, and major international oil companies attach high importance to hydrogen business and have successively initiated strategic planning in this field. Helium is widely used in medical, industrial and other fields and is considered a rare gas comparable to gold. China’s dependence on imports for its helium supply was once as high as 95%, which might cause a “bottleneck” for supply chain [7]. Comprehensive strategic planning is required for Chinese oil companies to accelerate the development and utilization of associated resources by leveraging their advantages in respect of technologies and resources and using existing oil and gas production facilities.
Based on the latest developments and trends in the global oil and gas industry, this paper provides an in-depth analysis of the status and characteristics of global oil and gas development in 2023, comprehensively investigates the major trends in global oil and gas development with a focus on collaborative development of oil and gas resources and emerging strategic resources. Suggestions are proposed from multiple perspectives such as focusing on core businesses, continued development of emerging fields, tight/shale oil and gas revolutions, and the construction of a comprehensive energy collaboration system for supply security with a view to providing references for the formulation of national energy strategies and high-quality international cooperation among oil companies in the oil and gas industry [8].
1. Current status and characteristics of global oil and gas development
In 2023, the world entered the post-pandemic era. The performance of the global economy exceeded the forecasts of many international institutions, but weak economic recovery remained a challenge for most countries, and global energy consumption increased continuously at a low rate. Geopolitical conflicts occurred frequently, causing energy supply-side disruptions, oil prices fluctuated significantly, and the global gas market balance remained fragile [9]. Driven by factors such as security of supply, investing activities in hydrocarbon exploration and production continued to grow, exhibiting a trend similar to that in 2022, and oil and gas production and reserves continued to increase as new projects were made and put into production. Additional reserves of onshore conventional oil and gas remained the largest contributor to the total additional oil and gas reserves, unconventional oil and gas production drove the growth of global oil and gas production, and offshore oil and gas reserves and production increased rapidly.
1.1. Wide distribution of oil and gas fields around the world and continuous expansion of the upstream production landscape
According to the statistics of Wood Mackenzie, as of the end of 2023, there are 16 961 oil and gas fields around the world, including 9 774 oil fields and 7 187 gas fields, among which 6 329 oil and gas fields are in production (IP), including 4 204 oil fields and 2 125 gas fields; 10 632 oil and gas fields are not in production (NIP), including 5 570 oil fields and 5 062 gas fields (Table 1 ). Globally, oil and gas fields are mainly distributed in 139 host countries in six regions: Central Asia-Russia, the Middle East, Africa, America, Asia Pacific and Europe [10]. In 2023, the number of oil/gas-producing/host countries and the number of IP oil and gas fields increased by 6 and 643 compared to the previous year, respectively, and the upstream production landscape continued to expand.
Table 1. Statistics of the number of oil and gas fields around the world in 2023 [10] |
| Region | Number of NIP oil and gas fields | Number of NIP oil and gas fields | Total number of oil and gas fields around the world | ||||||
|---|---|---|---|---|---|---|---|---|---|
| Oil field | Gas field | Oil and gas field | Oil field | Gas field | Oil and gas field | Oil field | Gas field | Oil and gas field | |
| Africa | 444 | 80 | 524 | 931 | 482 | 1 413 | 1 375 | 562 | 1 937 |
| Asia-Pacific | 358 | 408 | 766 | 972 | 1 446 | 2 418 | 1 330 | 1 854 | 3 184 |
| Europe | 425 | 343 | 768 | 997 | 1 030 | 2 027 | 1 422 | 1 373 | 2 795 |
| Central Asia-Russia | 704 | 189 | 893 | 1 281 | 580 | 1 861 | 1 985 | 769 | 2 754 |
| America | 2 071 | 1 060 | 3 131 | 1 028 | 1 354 | 2 382 | 3 099 | 2 414 | 5 513 |
| Middle East | 202 | 45 | 247 | 361 | 170 | 531 | 563 | 215 | 778 |
| Total | 4 204 | 2 125 | 6 329 | 5 570 | 5 062 | 10 632 | 9 774 | 7 187 | 16 961 |
The types of oil and gas fields that are not producing are categorized into six groups in 2023. (1) A total of 138 oil and gas fields were licensed for development, most of which were located in Europe, where the number of such fields accounted for 23.19%. Among these fields, the number of gas fields licensed for development in the Asia-Pacific region and Central Asia-Russia is greater than that of oil fields licensed for development. (2) A total of 128 oil and gas fields were to be licensed for development, most of which were located in the Asia-Pacific region, where the number of such fields accounted for 22.66%. America had the largest number of oil fields to be licensed for development, accounting for 92.59%, while the Asia-Pacific region had the largest number of gas fields to be licensed for development, accounting for 79.31%. (3) A total of 227 oil and gas fields were not in production due to economic vulnerability, most of which located in Europe and the Middle East, where the total number of such fields accounted for 60.35%. (4) A total of 7 471 oil and gas fields were not in production due to low economic efficiency, most of which were located in the Asia-Pacific region, where the number of such fields accounted for 26.45%. (5) A total of 1 976 oil and gas fields were shut down, most of which were located in America and Europe, where the total number of such fields accounted for 64.02%. (6) A total of 692 oil and gas fields were abandoned, most of which were located in America, where the number of such fields accounted for 65.90% [10].
1.2. YoY growth in recoverable oil and gas reserves and outstanding contribution of new discoveries and reserves re-estimates
As of the end of 2023, the global remaining economically recoverable reserves are 2 149.88×10⁸ tons of oil equivalent (toe), including 1 240.08×10⁸ t of oil and 107.72×10¹² m3 of gas, and the global remaining technically recoverable reserves are 4 483.82×10⁸ toe, including 2 413.46×10⁸ t of oil and 245.13×10¹² m3 of gas [10]. The geographic distribution of remaining technically recoverable reserves of oil and gas around the world is characterized by “two major regions, one medium region, and three minor regions”. “Two major regions” refer to the Middle East and America, with remaining technically recoverable reserves accounting for more than 25% of the world’s total remaining technically recoverable reserves. “One medium region” refers to Central Asia-Russia, which has remaining technically recoverable reserves accounting for 17.99% of the world’s total. “Three minor regions” are Africa, the Asia-Pacific and Europe, with remaining technically recoverable reserves accounting for less than 10% of the world’s total (Table 2 ).
Table 2. Distribution of remaining recoverable reserves of oil and gas in six major regions in 2023 [10] |
| Region | Oil/108 t | Gas/1012 m3 | Oil and gas/108 toe | |||
|---|---|---|---|---|---|---|
| Remaining economically recoverable reserves | Remaining technically recoverable reserves | Remaining economically recoverable reserves | Remaining technically recoverable reserves | Remaining economically recoverable reserves | Remaining technically recoverable reserves | |
| Middle East | 559.20 | 992.26 | 27.82 | 93.96 | 794.17 | 1 785.84 |
| America | 395.59 | 917.86 | 32.39 | 42.07 | 669.15 | 1 273.18 |
| Central Asia-Russia | 177.81 | 293.97 | 26.85 | 60.69 | 404.58 | 806.55 |
| Africa | 57.49 | 121.44 | 6.02 | 20.37 | 108.34 | 293.48 |
| Asia-Pacific | 31.97 | 53.81 | 11.96 | 22.32 | 132.98 | 242.32 |
| Europe | 18.02 | 34.12 | 2.68 | 5.73 | 40.66 | 82.52 |
| Total | 1 240.08 | 2 413.46 | 107.72 | 245.14 | 2 149.88 | 4 483.89 |
In 2023, the remaining technically recoverable reserves of oil and gas around the world increased by 141.37×10⁸ toe or 3.26% over the previous year, mainly due to contributions from new projects and reserve re-estimates (Table 3 and Table 4 ). The additional reserves from new projects in 2023 were mainly distributed primarily in the USA (12.89×10⁸ toe) and consist primarily of onshore conventional oil and gas, ultra-deepwater conventional oil and gas, oil sand and shale gas; the additional reserves from reserve re-estimates in 2023 were mainly distributed in Saudi Arabia, Iran, and the USA and consist primarily of tight/shale oil and gas (48.55×10⁸ toe) and onshore conventional oil and gas (23.23×10⁸ toe).
Table 3. Major new projects around the world in 2023 [10] |
| Project | Country | Type | Operator | Oil and gas reserves in 2023/108 toe |
|---|---|---|---|---|
| Shahini gas field | Iran | Onshore conventional gas | NIOC | 4.06 |
| San Juan gas field | USA | Onshore conventional oil/gas | 3.66 | |
| Kaminho project in Block 20/11 | Angola | Ultra-deepwater conventional oil/gas | TotalEnergies | 3.52 |
| Project Millennium | Canada | Oil sand | Suncor | 2.81 |
| Kodiak oil field | USA | Onshore conventional oil | Pantheon Resources | 2.37 |
| Marcellus gas field | USA | Shale gas | EQT | 1.88 |
| Salina gas field | USA | Onshore conventional gas | 1.07 | |
| Illinois oil field | USA | Onshore conventional oil | 1.01 |
Table 4. Main projects with reserve re-estimates around the world in 2023 [10] |
| Project | Country | Type | Operator | Oil and gas reserves in 2022/ 108 toe | Oil and gas reserves in 2023/108 toe | YoY growth in oil and gas reserves/108 toe |
|---|---|---|---|---|---|---|
| Jafurah gas field | Saudi Arabia | Tight gas | Saudi Aramco | 49.34 | 61.74 | 12.40 |
| Eridu oil field | Iraq | Onshore conventional oil | Lukoil | 4.40 | 13.68 | 9.28 |
| South Pars gas field | Iran | Onshore conventional gas | Pars Oil and Gas Company (POGC) | 91.17 | 98.21 | 7.04 |
| South Zagros oil field | Iran | Onshore conventional oil/gas | Iranian Central Oil Fields Company (ICOFC) | 3.92 | 10.73 | 6.81 |
| Williston Tight Oil Project | USA | Tight oil | 4.15 | 10.94 | 6.79 | |
| Abu Dhabi onshore oil field | UAE | Onshore conventional oil | ADNOC | 40.35 | 44.22 | 3.87 |
| Yakaar-Teranga gas field | Senegal | Offshore conventional gas | Kosmos Energy | 1.19 | 5.05 | 3.86 |
| Bone Spring Core Tight Oil Project | USA | Tight oil | EOG Resources | 1.10 | 4.51 | 3.41 |
| Wolfcamp Core Tight Oil Project | USA | Tight oil | EOG Resources | 0.58 | 3.90 | 3.32 |
| SARB and Umm Lulu oil fields | UAE | Onshore conventional oil/gas | ADNOC | 0.15 | 3.42 | 3.27 |
| Greater Green River Basin | USA | Onshore conventional oil/gas | 1.66 | 4.45 | 2.79 | |
| Gulf of Mexican Coastal Basin | USA | Tight oil | 12.25 | 14.95 | 2.70 | |
| Ark-La-Tex Basin | USA | Shale gas | 13.02 | 15.70 | 2.68 | |
| Wolfcamp North Tight Oil Project | USA | Tight oil | EOG Resources | 1.01 | 3.53 | 2.52 |
| Bone Spring Eddy West Tight Oil Project | USA | Tight oil | EOG Resources | 0.35 | 2.74 | 2.39 |
| Niobrara-Wattenberg oil field | USA | Tight oil | PDC Energy | 2.30 | 0 | −2.30 |
| Midland Basin | USA | Tight oil | 25.46 | 21.55 | −3.91 | |
| Denver-Julesburg Basin | USA | Tight oil | 7.84 | 2.90 | −4.94 | |
| Ruwais Diyab gas field | UAE | Shale gas | ADNOC | 5.97 | 0.94 | −5.03 |
| Appalachian Basin | USA | Shale gas | 21.85 | 14.52 | −7.33 | |
| North Field | Qatar | Onshore conventional oil/gas | QatarEnergy LNG | 87.30 | 78.60 | −8.70 |
| Delaware Basin | USA | Tight oil | 39.47 | 24.98 | −14.49 |
As of the end of 2023, the remaining technically recoverable reserves in the world’s top 10 hydrocarbon- bearing basins accounted for 66.99% of the world’s total remaining technically recoverable reserves. The world’s top three basins ranked by the remaining technically recoverable reserves of oil and gas are Rub’ al Khali Basin, Widyan-North Arabian Gulf Basin and Western Canada-Alberta Basin. The world’s top three basins ranked by the remaining technically recoverable oil reserves are Widyan-North Arabian Gulf Basin, Rub’ al Khali Basin and Guarico Sub-basin, and the top three basins ranked by the remaining technically recoverable gas reserves are Rub’ al Khali Basin, West Siberian (Southern Kara Sea/Yamal) Basin and Widyan-North Arabian Gulf Basin (Table 5 ).
Table 5. Remaining technically recoverable reserves of oil and gas in the world’s top ten basins in 2023 [10] |
| Basin | Oil/108 t | Gas/1012 m3 | Oil and gas/108 toe | |||
|---|---|---|---|---|---|---|
| Remaining economically recoverable reserves | Remaining technically recoverable reserves | Remaining economically recoverable reserves | Remaining technically recoverable reserves | Remaining economically recoverable reserves | Remaining technically recoverable reserves | |
| Rub’ al Khali Basin | 150.24 | 320.82 | 16.51 | 64.19 | 289.68 | 862.97 |
| Widyan-North Arabian Gulf Basin | 362.17 | 536.43 | 7.19 | 14.00 | 422.90 | 654.67 |
| Western Canada- Alberta Basin | 60.51 | 212.48 | 4.99 | 5.86 | 102.66 | 261.97 |
| Guarico Sub-basin | 0 | 248.43 | 0.02 | 0.71 | 0.17 | 254.43 |
| West Siberian (Central) Basin | 76.02 | 119.43 | 7.89 | 13.40 | 142.66 | 232.61 |
| Zagros Basin | 43.29 | 124.93 | 2.25 | 12.38 | 62.29 | 229.49 |
| West Siberian (Southern Kara Sea/Yamal) Basin | 13.17 | 24.73 | 9.84 | 20.58 | 96.28 | 198.55 |
| Delaware Basin | 95.63 | 95.63 | 6.13 | 6.13 | 147.40 | 147.40 |
| Niger Delta Basin | 10.39 | 34.55 | 0.87 | 5.57 | 17.74 | 81.59 |
| Amu Darya Basin | 0.57 | 1.67 | 3.64 | 9.26 | 31.31 | 79.88 |
As of the end of 2023, the remaining technically recoverable reserves of oil and gas in the top 10 host countries in the world accounted for 76.25% of the total remaining technically recoverable reserves. Among the top 10 host countries, there are three host countries with remaining technically recoverable reserves accounting for more than 10% of the total, four host countries with remaining technically recoverable reserves accounting for 5%-10%, and three host countries with remaining technically recoverable reserves accounting for less than 5%; six host countries have remaining technically recoverable reserves greater than 300×108 toe, three host countries have remaining technically recoverable reserves of (100-300)×108 toe, and one host country has remaining technically recoverable reserves less than 100×108 toe. In terms of geographic distribution, among the world’s top 10 host countries, six host countries are located in the Middle East, with remaining technically recoverable reserves accounting for 37.84% of the total remaining technically recoverable reserves of the world, where offshore conventional gas reserves play a dominant role in Qatar and Iran and onshore conventional oil plays a dominant role in Saudi Arabia, the UAE, Iraq and Kuwait; three host countries are located in America, with remaining technically recoverable reserves accounting for 24.45% of the world’s total, where unconventional oil reserves play a dominant role in the USA, Venezuela and Canada; the remaining host country is located in Central Asia-Russia, where onshore conventional gas reserves play a dominant role in Russia (Table 6 ).
Table 6. Remaining technically recoverable reserves of oil and gas in the world’s top 10 host countries in 2023 [10] |
| Country | Region | Number of oil and gas fields | Remaining technically recoverable reserves/108 toe | Proportion in global remaining technically recoverable reserves/% | Main oil/gas type | ||
|---|---|---|---|---|---|---|---|
| Oil field | Gas field | Oil and gas fields | |||||
| Russia | Central Asia-Russia | 1 571 | 453 | 2 024 | 626.84 | 13.98 | Onshore conventional gas accounting for 47.88%, onshore conventional oil accounting for 36.58% |
| Qatar | Middle East | 18 | 6 | 24 | 519.21 | 11.58 | Offshore conventional gas accounting for 74.92%, offshore conventional oil accounting for 24.48% |
| USA | America | 1 668 | 1 825 | 3 493 | 458.46 | 10.23 | Unconventional oil accounting for 45.72%, unconventional gas accounting for 40.12% |
| Saudi Arabia | Middle East | 90 | 45 | 135 | 394.13 | 8.79 | Onshore conventional oil accounting for 40.17%, offshore conventional oil accounting for 31.36% |
| Venezuela | America | 214 | 23 | 237 | 355.99 | 7.94 | Unconventional oil accounting for 79.60% |
| Iran | Middle East | 104 | 60 | 164 | 337.58 | 7.53 | Offshore conventional gas accounting for 33.49%, onshore conventional oil accounting for 30.02% |
| Canada | America | 450 | 231 | 681 | 281.60 | 6.28 | Unconventional oil accounting for 74.34% |
| UAE | Middle East | 53 | 24 | 77 | 194.85 | 4.35 | Onshore conventional oil accounting for 35.03%, offshore conventional oil accounting for 30.64% |
| Iraq | Middle East | 141 | 17 | 158 | 160.89 | 3.59 | Onshore conventional oil accounting for 86.75% |
| Kuwait | Middle East | 22 | 1 | 23 | 89.48 | 2.00 | Onshore conventional oil accounting for 87.06% |
As of the end of 2023, the remaining technically recoverable reserves of oil and gas in the world’s top 10 oil and gas fields accounted for 12.16% of the world’s total remaining technically recoverable reserves. These oil and gas fields include four fields with remaining technically recoverable reserves greater than 50×108 toe, four fields with remaining technically recoverable reserves of (40-50)×108 toe, and two fields with remaining technically recoverable reserves of (30-40)×108 toe. In terms of geographic distribution, nine of the top 10 oil and gas fields in the world are located in the Middle East, and the remaining one is located in Central Asia-Russia (Table 7 ). The remaining technically recoverable reserves of oil and gas in the world’s top 10 oil fields accounted for 7.99% of the total remaining technically recoverable reserves. The top 10 oil fields include one oil field with remaining technically recoverable reserves greater than 50×108 toe, three oil fields with remaining technically recoverable reserves of (40-50)×108 toe, and six oil fields with remaining technically recoverable reserves of (25-40)×108 toe. In terms of geographic location, nine of the top 10 oil fields of the world are located in the Middle East, and the remaining one is located in Central Asia-Russia (Table 8 ). The remaining technically recoverable reserves in the top 10 gas fields accounted for 8.44% of the world’s total remaining technically recoverable reserves. The top 10 gas fields include two gas fields with remaining technically recoverable reserves greater than 50×108 toe, and one gas field with remaining technically recoverable reserves of (40-50)×108 toe, and seven gas fields with remaining technically recoverable reserves of (10-40)×108 toe. In terms of geographic location, three of the top 10 gas fields of the world are located in the Middle East, and the other six are located in Central Asia-Russia (Table 9 ).
Table 7. Remaining technically recoverable reserves of the world’s top 10 oil and gas fields in 2023 [10] |
| Oil/gas field | Region | Oil/108 t | Gas/1012 m3 | Oil and gas/108 toe | |||
|---|---|---|---|---|---|---|---|
| Remaining economically recoverable reserves | Remaining technically recoverable reserves | Remaining economically recoverable reserves | Remaining technically recoverable reserves | Remaining economically recoverable reserves | Remaining technically recoverable reserves | ||
| South Pars gas field | Middle East | 11.77 | 18.65 | 5.96 | 9.99 | 62.08 | 102.98 |
| North gas field | Middle East | 15.30 | 15.30 | 7.94 | 7.94 | 82.39 | 82.39 |
| Jafurah gas field | Middle East | 13.63 | 40.30 | 0.80 | 2.69 | 20.36 | 63.03 |
| Ghawar oil field | Middle East | 50.84 | 50.84 | 0.27 | 0.27 | 53.16 | 53.16 |
| South Yoloten gas field | Central Asia-Russia | 0.17 | 0.65 | 1.57 | 5.78 | 13.44 | 49.44 |
| Safaniya oil field | Middle East | 30.87 | 43.62 | 0.13 | 0.16 | 31.94 | 44.95 |
| Zuluf oil field | Middle East | 20.53 | 40.88 | 0.07 | 0.14 | 21.14 | 42.10 |
| Greater Burgan oil field | Middle East | 23.75 | 40.03 | 0.24 | 0.24 | 25.75 | 42.03 |
| Abu Dhabi onshore oil field | Middle East | 31.99 | 34.43 | 0 | 0.01 | 31.99 | 34.55 |
| Shaybah oil field | Middle East | 20.19 | 25.48 | 0 | 0.60 | 20.19 | 30.54 |
Table 8. Remaining technically recoverable reserves of the world’s top 10 oil fields in 2023 [10] |
| Oil field | Region | Oil/108 t | Gas/1012 m3 | Oil and gas/108 toe | |||
|---|---|---|---|---|---|---|---|
| Remaining economically recoverable reserves | Remaining technically recoverable reserves | Remaining economically recoverable reserves | Remaining technically recoverable reserves | Remaining economically recoverable reserves | Remaining technically recoverable reserves | ||
| Ghawar oil field | Middle East | 50.84 | 50.84 | 0.27 | 0.27 | 53.12 | 53.12 |
| Safaniyah oil field | Middle East | 30.87 | 43.62 | 0.13 | 0.16 | 31.97 | 44.97 |
| Zuluf oil field | Middle East | 20.53 | 40.88 | 0.07 | 0.14 | 21.12 | 42.06 |
| Greater Burgan oil field | Middle East | 23.75 | 40.03 | 0.24 | 0.24 | 25.78 | 42.06 |
| Abu Dhabi onshore oil field | Middle East | 31.99 | 34.43 | 0 | 0.01 | 31.99 | 34.51 |
| Shaybah oi lfield | Middle East | 20.19 | 25.48 | 0 | 0.60 | 20.19 | 30.55 |
| Abu Dhabi Uncon oil field | Middle East | 0 | 29.85 | 0 | 0 | 0 | 29.85 |
| Northern oil fields | Middle East | 19.08 | 24.22 | 0.43 | 0.61 | 22.71 | 29.37 |
| Khurais oil field | Middle East | 25.32 | 25.32 | 0.08 | 0.08 | 26.00 | 26.00 |
| Yuganskneftegaz oil field | Central Asia-Russia | 18.08 | 24.48 | 0.15 | 0.15 | 19.35 | 25.75 |
Table 9. Remaining technically recoverable reserves of the world’s top 10 gas fields in 2023 [10] |
| Gas field | Region | Oil/108 t | Gas/1012 m3 | Oil and gas/108 toe | |||
|---|---|---|---|---|---|---|---|
| Remaining economically recoverable reserves | Remaining technically recoverable reserves | Remaining economically recoverable reserves | Remaining technically recoverable reserves | Remaining economically recoverable reserves | Remaining technically recoverable reserves | ||
| South Par gas field | Middle East | 11.77 | 18.65 | 5.96 | 9.99 | 62.11 | 103.03 |
| North gas field | Middle East | 15.30 | 15.30 | 7.94 | 7.94 | 82.36 | 82.36 |
| South Yoloten gas field | Central Asia-Russia | 0.17 | 0.65 | 1.57 | 5.78 | 13.43 | 49.47 |
| Tambeiskoye gas field | Central Asia-Russia | 0 | 0.83 | 1.95 | 3.51 | 16.47 | 30.48 |
| Shtokmanovskoye gas field | Central Asia-Russia | 0 | 0.49 | 0 | 2.92 | 0 | 25.15 |
| ADNOC Natural Gas Project | Middle East | 8.20 | 8.74 | 0.61 | 1.42 | 13.35 | 20.73 |
| Bovanenkovo gas field | Central Asia-Russia | 0.37 | 0.66 | 1.68 | 2.08 | 14.56 | 18.23 |
| ArkLaTex Basin Shale Gas Project | America | 1.23 | 1.23 | 1.82 | 1.82 | 16.60 | 16.60 |
| Astrakhan gas field | Central Asia-Russia | 1.59 | 3.15 | 0.57 | 1.56 | 6.40 | 16.33 |
| Yamburg gas field | Central Asia-Russia | 0.12 | 0.60 | 1.01 | 1.81 | 8.65 | 15.89 |
In 2023, the remaining technically recoverable reserves of oil and gas around the world increased significantly over the previous year. For the reserves of different types of oil and gas resources, the remaining technically recoverable reserves of onshore conventional oil and gas as of the end of 2023 amounted to 1 781.37×10⁸ toe, accounting for 39.73% of the world’s total remaining technically recoverable reserves and representing a year-over-year (YoY) growth of 65.52×10⁸ toe (as compared to 2022) and a growth rate of 3.82%. In particular, the YoY growth in onshore conventional gas reserves and the corresponding growth rate are 6.38×10¹² m3 and 7.50%, respectively. The remaining technically recoverable reserves of unconventional oil and gas (onshore + marine) in 2023 were 1 143.16× 10⁸ toe, accounting for 25.50% of the world’s total remaining technically recoverable reserves and representing a YoY growth of 17.87×10⁸ toe. Specifically, the YoY growth in unconventional oil reserves and the corresponding growth rate are 19.09×10⁸ t and 2.36%, respectively. The remaining technically recoverable reserves of offshore conventional oil and gas in 2023 were 1 559.27× 10⁸ toe, accounting for 34.78% of the world’s total remaining technically recoverable reserves and representing a YoY growth of 57.97×10⁸ toe and a growth rate of 3.86%. In particular, the YoY growth in offshore conventional gas reserves and the corresponding growth rate are 6.62×10¹² m3 and 6.04%, respectively (Table 10 ).
Table 10. YoY change in the remaining technically recoverable reserves of various types of oil and gas resources around the world [10] |
| Oil/gas type | Remaining technically recoverable reserves in 2022 | Remaining technically recoverable reserves in 2023 | YoY change in 2023 | ||||||
|---|---|---|---|---|---|---|---|---|---|
| Oil/108 t | Gas/ 1012 m3 | Oil and gas/ 108 toe | Oil/ 108 t | Gas/ 1012 m3 | Oil and gas/ 108 toe | Oil/ 108 t | Gas/ 1012 m3 | Oil and gas/ 108 toe toe | |
| Onshore conventional oil/gas | 997.20 | 85.11 | 1 715.85 | 1 008.65 | 91.49 | 1 781.37 | 11.45 | 6.38 | 65.52 |
| Offshore conventional oil/gas | 576.49 | 109.52 | 1 501.30 | 578.36 | 116.14 | 1 559.27 | 1.87 | 6.62 | 57.97 |
| Unconventional oil/gas | 807.35 | 37.65 | 1 125.29 | 826.44 | 37.50 | 1 143.16 | 19.09 | −0.15 | 17.87 |
| Total | 2 381.04 | 232.28 | 4 342.44 | 2 413.46 | 245.13 | 4 483.82 | 32.42 | 12.85 | 141.38 |
In 2023, for changes in oil and gas reserves in different regions, America was the main region where the remaining technically recoverable reserves of oil and gas increased significantly by 65.33×10⁸ toe or 5.41%; for changes in oil reserves compared to 2022, the Middle East and America were the main regions where the remaining technically recoverable oil reserves increased significantly by 21.44×10⁸ t or 2.21% and 18.21×10⁸ t or 2.02%, respectively; for changes in gas reserves compared to 2022, America was the main region where the remaining technically recoverable gas reserves increased significantly by 5.57×10¹² m3 or 15.26% (Table 11 ).
Table 11. YoY change in the remaining technically recoverable reserves of oil and gas in six major regions [10] |
| Region | Remaining technically recoverable reserves in 2022 | Remaining technically recoverable reserves in 2023 | YoY change in 2023 over 2022 | ||||||
|---|---|---|---|---|---|---|---|---|---|
| Oil/108 t | Gas/1012 m3 | Oil and gas/ 108 toe | Oil/108 t | Gas/1012 m3 | Oil and gas/ 108 toe | Oil/108 t | Gas/1012 m3 | Oil and gas/ 108 toe | |
| Middle East | 970.82 | 92.20 | 1 749.34 | 992.26 | 93.96 | 1 785.84 | 21.44 | 1.76 | 36.50 |
| America | 899.65 | 36.50 | 1 207.85 | 917.86 | 42.07 | 1 273.18 | 18.21 | 5.57 | 65.33 |
| Central Asia-Russia | 300.32 | 57.62 | 786.85 | 293.97 | 60.69 | 806.55 | −6.35 | 3.07 | 19.70 |
| Africa | 122.26 | 19.44 | 286.45 | 121.44 | 20.37 | 293.48 | −0.82 | 0.93 | 7.03 |
| Asia-Pacific | 52.75 | 20.85 | 228.82 | 53.81 | 22.32 | 242.32 | 1.06 | 1.47 | 13.50 |
| Europe | 35.24 | 5.67 | 83.13 | 34.12 | 5.73 | 82.52 | −1.12 | 0.06 | −0.61 |
| Total | 2 381.04 | 232.28 | 4 342.44 | 2 413.46 | 245.13 | 4 483.82 | 32.42 | 12.85 | 141.38 |
1.3. Continuous growth in oil and gas production, significant contribution of new projects put into production and capacity expansion projects
Global oil and gas production in 2023 amounted to 82.38×10⁸ toe, including 47.47×10⁸ t of oil and 40 899.45× 10⁸ m3 of gas. The geographic distribution of global oil and gas production in 2023 was characterized by “two major regions, one medium region, and three minor regions”. “Two major regions” refer to America and the Middle East, each of which with oil and gas production exceeding 20×108 toe. “One medium region” refers to Central Asia-Russia, with oil and gas production of 13.69×10⁸ toe. “Three minor regions” refer to Africa, the Asia-Pacific and Europe, each of which with oil and gas production less than 10×108 toe (Table 12 ).
Table 12. Oil and gas production in the six major regions in 2023 [10] |
| Region | Oil/108 t | Gas/108 m3 | Oil and gas/108 toe |
|---|---|---|---|
| America | 16.83 | 13 674.29 | 28.50 |
| Middle East | 15.41 | 7 872.36 | 22.13 |
| Central Asia- Russia | 6.63 | 8 274.02 | 13.69 |
| Asia-Pacific | 3.33 | 6 341.46 | 8.74 |
| Africa | 3.60 | 2 615.76 | 5.84 |
| Europe | 1.67 | 2 121.56 | 3.48 |
| Total | 47.47 | 40 899.45 | 82.38 |
In 2023, global upstream hydrocarbon exploration and development activities remained active; global oil and gas production increased by 1.05×10⁸ toe or 1.29% over the previous year. There were six host countries with YoY changes greater than 1 000×104 t in oil production and four host countries with YoY changes of (500-1 000)×104 t in oil production, and in particular, the USA experienced the largest positive YoY growth in oil, production amounting to 5 258.14×10⁴ t and consisting primarily of tight oil production, while Saudi Arabia experienced the largest YoY decline in oil production amounting to 3 988.89×10⁴ t, with the largest decline in oil production in shallow-water areas (Table 13 ). Among the world’s top 10 host countries with YoY changes greater than 40×108 m3 in gas production in 2023, the USA is the host country experiencing the largest positive YoY growth in gas production, amounting to 253.84×10⁸ m3 and consisting primarily of tight gas, while Russia is the host country experiencing the largest YoY decline in gas production amounting to 516.77×10⁸ m3, with the largest decline in onshore conventional gas production (Table 14 ).
Table 13. YoY change in oil production in major oil-producing countries [10] |
| Country | Oil production/104 t | Total YoY change in 2023/104 t | Main oil type involved | YoY change in 2023/104 t | |
|---|---|---|---|---|---|
| 2022 | 2023 | ||||
| USA | 91 761.19 | 97 019.33 | 5 258.14 | Tight oil | 5 021.58 |
| Onshore conventional oil | −159.63 | ||||
| Deepwater conventional oil | 648.58 | ||||
| Saudi Arabia | 58 961.32 | 54 972.43 | −3 988.89 | Shallow-water conventional oil | −2 592.33 |
| Onshore conventional oil | −1 415.33 | ||||
| Brazil | 14 928.07 | 17 019.47 | 2 091.40 | Ultra-deepwater conventional oil | 1 384.08 |
| Deepwater conventional oil | 324.70 | ||||
| Iran | 19 924.83 | 21 982.24 | 2 057.41 | Shallow-water conventional oil | 235.52 |
| Onshore conventional oil | 1 862.54 | ||||
| Norway | 9 380.69 | 10 688.05 | 1 307.36 | Onshore conventional oil | 1 292.03 |
| Deepwater conventional oil | −785.12 | ||||
| UAE | 23 495.27 | 24 721.83 | 1 226.56 | Shallow-water conventional oil | 428.48 |
| Onshore conventional oil | 798.08 | ||||
| Canada | 27 831.33 | 28 625.00 | 793.68 | Onshore conventional oil | −238.48 |
| Oil sand | 730.02 | ||||
| Libya | 5 222.06 | 5 852.74 | 630.67 | Onshore conventional oil Shallow-water conventional oil | 670.49 −39.82 |
| Kazakhstan | 9 000.54 | 9 576.03 | 575.49 | Shallow-water conventional oil | 611.82 |
| Onshore conventional oil | −38.51 | ||||
| Guyana | 1 468.62 | 2 023.52 | 554.90 | Ultra-deepwater conventional oil | 554.90 |
Table 14. YoY change in gas production in major gas-producing countries [10] |
| Country | Gas production/108 m3 | Total YoY change in 2023/108 m3 | Main gas type involved | YoY change in 2023/108 m3 | |
|---|---|---|---|---|---|
| 2022 | 2023 | ||||
| Russia | 6 832.76 | 6 315.99 | −516.77 | Onshore conventional gas | −521.38 |
| Shallow-water conventional gas | 4.61 | ||||
| USA | 10 063.34 | 10 317.18 | 253.84 | Tight gas | 157.97 |
| Shale gas Onshore conventional gas | 139.24 −33.17 | ||||
| Iran | 3 090.76 | 3 180.76 | 90.00 | Shallow-water conventional gas | 49.83 |
| Onshore conventional gas | 40.17 | ||||
| Saudi Arabia | 1 008.09 | 1 094.17 | 86.08 | Onshore conventional gas | 37.84 |
| Shallow-water conventional gas | 45.90 | ||||
| China | 1 874.46 | 1 931.55 | 57.09 | Tight gas | 25.00 |
| Shale gas Onshore conventional gas | 11.95 15.63 | ||||
| Algeria | 978.85 | 1 032.02 | 53.17 | Tight gas | −1.74 |
| Onshore conventional gas | 54.91 | ||||
| Netherlands | 157.57 | 106.37 | −51.20 | Onshore conventional gas | −35.77 |
| Shallow-water conventional gas Tight gas | −15.21 −0.21 | ||||
| UAE | 382.11 | 331.18 | −50.93 | Onshore conventional gas | −47.55 |
| Shallow-water conventional gas | −3.38 | ||||
| Egypt | 630.48 | 582.29 | −48.19 | Onshore conventional gas | −2.74 |
| Deepwater conventional gas | −35.64 | ||||
| Shallow-water conventional gas | −9.82 | ||||
| Canada | 1 658.26 | 1 702.36 | 44.10 | Onshore conventional gas | −30.40 |
| Coalbed methane (CBM) Shale gas Tight gas | −1.77 1.72 75.41 | ||||
The growth in global oil and gas production in 2023 was mainly contributed by new projects put into production and capacity expansion projects. Specifically, the total contribution of new projects put into production as of 2023 was 3 018×104 toe, including 1 832×104 toe of tight/shale oil and gas produced in the USA and Canada, 705×104 toe from blocks 404a & 208 in Algeria, and 274×104 toe from Project MC 984 of the Vito discovery in the USA [10]. The total contribution of capacity expansion projects in 2023 amounted to 8 692×104 toe, which consists primarily of conventional oil and gas production from large offshore and onshore fields and includes 1 879×104 toe from conventional oil and gas projects in ultra-deepwater areas, 809×104 toe from conventional oil and gas projects in shallow-water areas, 690×104 toe from onshore conventional oil and gas projects, 486×104 toe and 204×104 toe from the Kovyktinskoye and Semakovskoye fields in Russia, respectively [10].
The world’s top 10 oil fields ranked by oil production as of the end of 2023 include eight oil fields in the Middle East, with total oil production accounting for 13.33% of global oil production, one oil field in Central Asia-Russia, with oil production accounting for 1.35% of global oil production, and one country in America, with oil production accounting for 0.86% (Table 15 ). Among the world’s top 10 gas fields ranked by gas production in 2023, four fields are located in the Middle East, with gas production accounting for 11.49% of global gas production, and four fields are located in Central Asia-Russia, with gas production accounting for 4.70% of global gas production (Table 16 ).
Table 15. The top 10 oil fields in the world ranked by oil production [10] |
| Oil field | Operator | Country | Region | 1st production year | Oil production in 2023/104 t | Remaining technically recoverable reserves/108 t |
|---|---|---|---|---|---|---|
| Ghawar oil field | Saudi Aramco | Saudi Arabia | Middle East | 1951 | 17 636.16 | 50.84 |
| Abu Dhabi onshore oil field | ADNOC Onshore | UAE | Middle East | 1963 | 10 222.34 | 34.43 |
| Greater Burgan oil field | Kuwait National Petroleum Company (KNPC) | Kuwait | Middle East | 1946 | 6 746.70 | 40.03 |
| Rumaila oil field | Basra Energy Company Limited (BECL) | Iraq | Middle East | 1954 | 6 579.69 | 16.93 |
| Khurais oil field | Saudi Aramco | Saudi Arabia | Middle East | 1963 | 6 488.02 | 25.32 |
| Yugansk oil field | Yukos Oil Company | Russia | Central Asia-Russia | 1977 | 6 413.45 | 24.48 |
| Shaybah oil field | Saudi Aramco | Saudi Arabia | Middle East | 1998 | 5 596.53 | 25.48 |
| Upper Zakum oil field | ADNOC Offshore | UAE | Middle East | 1982 | 5 076.50 | 16.06 |
| Safaniya Field | Saudi Aramco | Saudi Arabia | Middle East | 1957 | 4 952.69 | 43.62 |
| Tupi oil field | Petrobras | Brazil | America | 2009 | 4 095.65 | 3.42 |
Table 16. World’s top 10 gas fields ranked by gas production [10] |
| Gas field | Operator | Country | Region | 1st production year | Gas pro- duction in 2023/108 m3 | Remaining technically recoverable reserves/ 108 m3 |
|---|---|---|---|---|---|---|
| South Pars gas field | POGC | Iran | Middle East | 2002 | 2 373.98 | 99 851.78 |
| North gas field | QatarEnergy LNG | Qatar | Middle East | 1996 | 1 710.17 | 79 435.26 |
| Bovanenkovo gas field | Gazprom | Russia | Central Asia-Russia | 2012 | 656.93 | 20 824.19 |
| Zapolyarnoye gas field | Gazprom | Russia | Central Asia-Russia | 2001 | 623.14 | 11 148.86 |
| Hassi R’Mel oil and gas field | Sonatrach | Algeria | Africa | 1961 | 560.21 | 8 604.07 |
| Troll gas field | Equinor | Norway | Europe | 1995 | 375.50 | 6 420.78 |
| Yamburg gas field | Gazprom | Russia | Central Asia-Russia | 1983 | 343.23 | 18 066.39 |
| Ghawar gas field | Saudi Aramco | Saudi Arabia | Middle East | 1951 | 341.26 | 14 497.50 |
| South Tambeiskoye gas field | Yamal LNG OAO | Russia | Central Asia-Russia | 2017 | 297.87 | 8 952.83 |
| Parsian gas field | South Zagros Oil and Gas Production Company (SZOGPC) | Iran | Middle East | 2003 | 273.62 | 2 485.91 |
In terms of YoY changes in production for various types of oil and gas resources, onshore conventional oil and gas production in 2023 amounted to 36.84×10⁸ toe, accounting for 44.72% of global oil and gas production and representing a YoY decline of 0.25×10⁸ toe or decline rate of 0.67% (Table 17 ). Unconventional oil and gas production in 2023 was 22.40×10⁸ toe, accounting for 27.19% of global oil and gas production and representing a YoY growth of 1.05×10⁸ toe or 4.92% (Table 17 ). Offshore conventional oil and gas production in 2023 was 23.14× 10⁸ toe, accounting for 28.09% of global oil and gas production and representing a YoY growth of 0.25×10⁸ toe or 1.09% (Table 17 ).
Table 17. YoY change in production for various types of oil and gas resources [10] |
| Type | 2022 | 2023 | YoY change in 2023 | Rate of change in 2023 over 2022/% | ||||||||
|---|---|---|---|---|---|---|---|---|---|---|---|---|
| Oil/ 108 t | Gas/ 108 m3 | Oil and gas/ 108 toe | Oil/ 108 t | Gas/ 108 m3 | Oil and gas/ 108 toe | Oil/ 108 t | Gas/ 108 m3 | Oil and gas/ 108 toe | Oil | Gas | Oil and gas (toe) | |
| Onshore conventional oil/gas | 22.87 | 16 661.07 | 37.09 | 22.99 | 16 228.74 | 36.84 | 0.12 | −432.33 | −0.25 | 0.53 | −2.60 | −0.67 |
| Unconventional oil/gas | 11.31 | 11 766.83 | 21.35 | 11.99 | 12 192.90 | 22.40 | 0.68 | 426.07 | 1.05 | 6.01 | 3.62 | 4.92 |
| Offshore conventional oil/gas | 12.29 | 12 422.13 | 22.89 | 12.49 | 12 477.81 | 23.14 | 0.20 | 55.68 | 0.25 | 1.63 | 0.45 | 1.09 |
| Total | 46.47 | 40 850.03 | 81.33 | 47.47 | 40 899.45 | 82.38 | 1.00 | 49.42 | 1.05 | 2.15 | 0.12 | 1.29 |
For YoY changes in oil and gas production in different regions in 2023, America experienced the largest positive YoY growth and increasing rate in oil and gas production amounting to 1.16×10⁸ toe, representing a growth rate of 4.24%. Africa, the Middle East, and Europe experienced positive YoY growths of 0.16×10⁸, 0.11×10⁸ and 0.06×10⁸ toe, respectively, representing growth rates of 2.82%, 0.50%, and 1.75%, respectively. Central Asia-Russia experienced the largest YoY decline amounting to 0.37×10⁸ toe, representing a decline rate of 2.63% (Table 18 ).
Table 18. YoY change in oil and gas production in the six major regions [10] |
| Region | 2022 | 2023 | YoY change in 2023 | Rate of change in 2023 over 2022/% | ||||||||
|---|---|---|---|---|---|---|---|---|---|---|---|---|
| Oil/ 108 t | Gas/ 108 m3 | Oil and gas/ 108 toe | Oil/ 108 t | Gas/ 108 m3 | Oil and gas/ 108 toe | Oil/ 108 t | Gas/ 108 m3 | Oil and gas/ 108 toe | Oil | Gas | Oil and gas (toe) | |
| America | 15.91 | 13 398.63 | 27.34 | 16.83 | 13 674.29 | 28.50 | 0.92 | 275.66 | 1.16 | 5.78 | 2.06 | 4.24 |
| Middle East | 15.49 | 7 648.57 | 22.02 | 15.41 | 7 872.36 | 22.13 | −0.08 | 223.79 | 0.11 | −0.52 | 2.93 | 0.50 |
| Central Asia-Russia | 6.62 | 8 725.25 | 14.06 | 6.63 | 8 274.02 | 13.69 | 0.01 | −451.23 | −0.37 | 0.15 | −5.17 | −2.63 |
| Asia-Pacific | 3.41 | 6 323.17 | 8.81 | 3.33 | 6 341.46 | 8.74 | −0.08 | 18.29 | −0.07 | −2.35 | 0.29 | −0.79 |
| Africa | 3.50 | 2 549.01 | 5.68 | 3.60 | 2 615.76 | 5.84 | 0.10 | 66.75 | 0.16 | 2.86 | 2.62 | 2.82 |
| Europe | 1.54 | 2 205.40 | 3.42 | 1.67 | 2 121.56 | 3.48 | 0.13 | −83.84 | 0.06 | 8.44 | −3.80 | 1.75 |
| Total | 46.47 | 40 850.03 | 81.33 | 47.47 | 40 899.45 | 82.38 | 1.00 | 49.42 | 1.05 | 2.15 | 0.12 | 1.29 |
1.4. Abundant reserves in oil and gas fields unproduced and to be produced, low economic efficiency as the main impeding factor for oil and gas development
The total recoverable oil reserves of large oil fields unproduced as of the end of 2023 were 499.75×10⁸ t [10], which represent a YoY growth of 12.3×10⁸ t or 2.52% and are distributed primarily in large oil fields licensed for development (Fig. 1a ). Specifically, the recoverable oil reserves of large oil fields licensed for development were 51.21×10⁸ t [10], representing a YoY growth of 20.95×10⁸ t or 69.23%. The recoverable conventional oil reserves in onshore areas in 2023 were 44.25×10⁸ t [10], representing a YoY growth of 21.28×10⁸ t, and the recoverable oil reserves in ultra-deepwater areas were 3.41×10⁸ t [10], representing a YoY growth of 0.69×10⁸ t (Fig. 1b ).
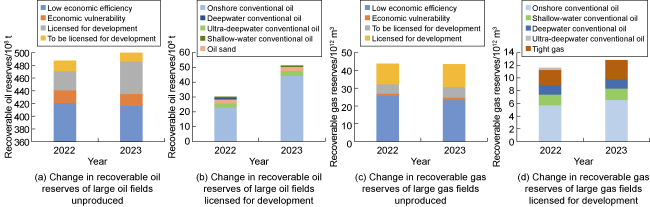
Fig. 1. Changes in recoverable reserves of the large oil/gas fields unproduced around the world. |
The total recoverable gas reserves of large gas fields unproduced as of the end of 2023 were 43.48×10¹² m3 [10], which represent a YoY decline of 0.28×10¹² m3 or 0.64% and are mainly distributed in large gas fields with low economic efficiency (Fig. 1c ). Specifically, the recoverable gas reserves of large gas fields with low economic efficiency were 23.34×10¹² m3, among which the recoverable gas reserves of large conventional gas fields in onshore, shallow-water and deepwater areas accounted for 90.87% [10]. The recoverable gas reserves of large gas fields licensed for development as of the end of 2023 were 12.82×10¹² m3[10], representing a YoY growth of 1.22×10¹² m3 or 10.52%. The recoverable reserves of onshore conventional gas and tight gas reserves are 6.54×10¹² m3 and 2.97×10¹² m3, respectively [10] (Fig. 1d ).
In terms of future oil/gas production, production in large oil fields to be produced is estimated to reach its peak in 2036 at 1.56×10⁸ t, including 1.2×10⁸ t of onshore conventional oil and 2 465×104 t of ultra-deepwater conventional oil (Fig. 2a ) [10]. Gas production in large gas fields to be produced is estimated to reach its peak in 2033 at 2 791×108 m3, including 1 401×108 m3 of onshore conventional gas and 643×108 m3 of shallow-water conventional gas (Fig. 2b ) [10].
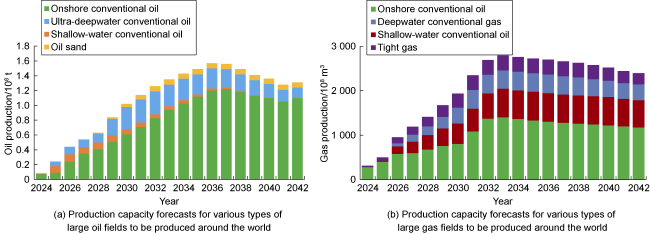
Fig. 2. Production capacity forecasts for various types of large oil/ gas fields to be produced around the world. |
2. Major trends in global oil and gas development
The combined effects of multiple factors such as geopolitical conflicts, financial turbulence, and energy transition brought huge uncertainty to global economic growth and oil-gas supply-demand situation. Global oil demand increases significantly, but it was still not enough to absorb the continued increase in oil supply from non-OPEC oil-producing countries such as the USA, and global oil prices are under pressure and experiencing significant fluctuations [11]. Due to factors such as security of oil and gas supply, investing activities in hydrocarbon exploration and development remain active, and global oil and gas reserves and production continue to increase. In the context of energy transition, international oil companies took active steps to adjust their development strategies, enter the field of associated resources, and secure associated resources projects in advance through investment, acquisition or cooperation. In general, the major trends in global oil and gas development in 2023 can be summarized in seven aspects.
2.1. The combined effects of the COVID-19 pandemic and Russia-Ukraine conflict reshaped the geographic pattern of global oil and gas production, and the global macro-environment affected the trend of oil and gas production
In 2023, the COVID-19 pandemic and Russia-Ukraine conflict affected the oil- and gas-producing regions around the world. Specifically, the spillover effects of the Russia-Ukraine conflict led to reduced oil and gas production in both Russia and Europe, and geopolitical turbulence and foreign capital withdrawal resulted in reduced oil and gas production in Africa. Therefore, Central Asia-Russia, Europe and Africa are the three major regions that have experienced declines in oil and gas production since the COVID-19 pandemic. Oil and gas production in these regions in 2023 was 1.25×10⁸ toe less than that in 2019 (Fig. 3a ). On the other hand, international oil companies refocused on unconventional oil and gas assets in North America, returned to the North America market through large-scale mergers and acquisitions of oil and gas assets, and employed technological innovation to promote the efficient development of deepwater oil fields and unconventional oil and gas resources in South America. In addition, deepwater oil and gas fields in Brazil were successively put into production, and tight/shale oil and gas industry in Argentina developed vigorously, driving growth in oil and gas production in Latin America. As a “stabilizer” of global oil and gas supply, the Middle East continued to play an important role in filling the gap in Russia’s export share by increasing oil and gas production. Therefore, North America, Latin America and the Middle East are the three major regions experiencing increases in oil and gas production. Oil and gas production in these three regions in 2023 was 3.55×10⁸ toe more than that in 2019 (Fig. 3b ).
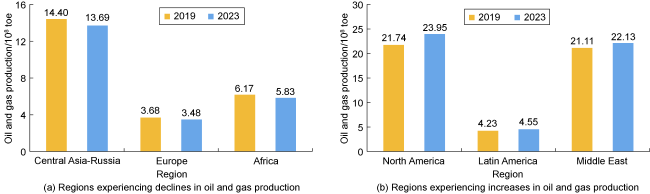
Fig. 3. Comparison of changes in oil and gas production in major regions [10]. |
2.2. Oil and gas oversupply coupled with geopolitical conflicts became the major cause of fluctuations in global oil and gas prices.
Currently, the global energy market is experiencing significant supply and demand adjustments and price fluctuations. In the global oil market, the supply pattern involving both production cuts and increases continued to affect market trends. OPEC+ members persisted in implementing production cuts to stabilize oil prices, while non-OPEC countries increased oil production to fill gaps in the global oil market. However, the GDP (gross domestic product) growth of major economies generally slowed down in 2023, and consequently, global oil demand did not grow to the expected level. Despite the decline in oil prices, the average spot price for Brent crude oil remained at medium to high levels of about USD 82.5/bbl (1 bbl=0.159 m3) throughout 2023, representing a YoY decline of 18% (Fig. 4 ).
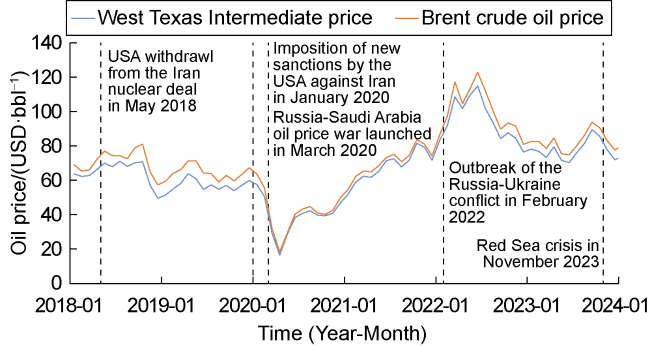
Fig. 4. Crude oil price fluctuation and major geopolitical events during 2018 to 2023 [12]. |
In the global gas market, due to factors such as sufficient supply, relatively stable demand and high inventory, global gas prices fell back to the levels before the outbreak of the Russia-Ukraine conflict. U.S. natural gas production hit a record high, the warm weather in winter resulted in reduced gas demand, the slow process of industrial recovery and the wide use of renewable energy further weakened the demand for traditional energy. Due to these reasons, the relationship between gas supply and demand generally remained loose, and gas prices declined significantly. The average Henry Hub natural gas price in the USA throughout 2023 was only USD 2.53/106 btu (1 btu = 1.055×10³ J), representing a YoY decline of 61%, and the average annual price of natural gas at the Title Transfer Facility (TTF) in the Netherlands is USD 13.33/mmbtu, representing a YoY decline of 64% (Fig. 5 ).
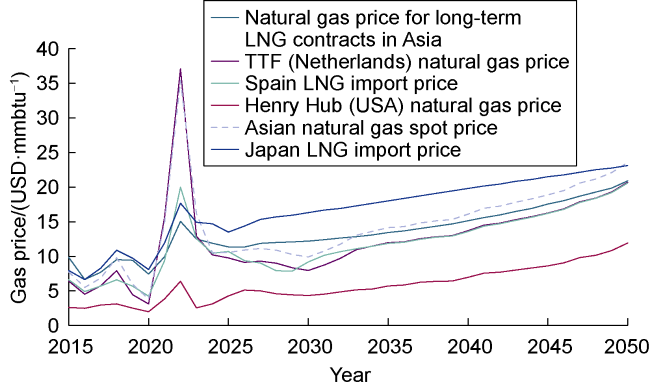
Fig. 5. Global gas prices and forecasts by region from 2015 to 2050 [13]. |
2.3. Global investment in oil and gas development increased steadily, and both the total production cost and operating cost decreased
Global oil and gas investment increased steadily in three consecutive years and reached USD 489 billion in 2023, representing a slight increase over the previous year (Fig. 6a ). Due to the cost advantages arising from currency depreciation in some African countries and Russia and the downward trend amid global oil price fluctuations, the total production cost per barrel of oil decreased to USD 16.11 in 2023, representing a decrease of 5% over the previous year, and specifically, the total production cost per barrel of oil in Central Asia-Russia decreased from USD 15 in 2022 to USD 11 in 2023; the operating cost per barrel of oil decreased significantly to USD 8.06, representing a decrease of 5% over the previous year, and specifically, the operating cost per barrel of oil in Central Asia-Russia decreased from USD 9 in 2022 to USD 7 in 2023 (Fig. 6b ).
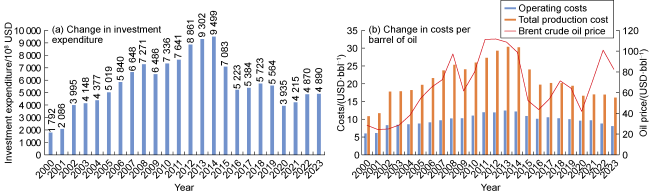
Fig. 6. Changes in global investment in oil and gas development and costs per barrel of oil [10]. |
2.4. Capital expenditures in deepwater oil and gas fields remain dominant, projects with final investment decisions are expected to have a lower break-even oil price
The number of final investment decisions (FIDs) and capital expenditures for deepwater oil and gas assets show a positive trend of YoY growth. It is expected that FIDs will be made for 31 upstream projects around the world in 2024, representing a YoY increase of 9, and capital expenditures for these projects are estimated to reach USD 125 billion by the end of 2024, representing a YoY increase of USD 3 billion, which include USD 60 billion for deepwater oil and gas projects, accounting for 48% [10]. It is expected that investments in deepwater oil and gas projects will remain dominant in the future.
Driven by the increasing proportion of crude oil and condensate in global oil and gas production and the steady rise in long-term oil prices, the economic returns of oil and gas projects will increase significantly. The weighted average internal rate of return of the projects with FIDs to be made in 2024 is estimated to be 23%, and the estimated break-even point for these projects is USD 47/bbl, which is slightly lower than the level of USD 49/bbl in 2023 [10].
2.5. Oil and gas reserves and production changed in the same direction while the reserves-to-production ratio remained high, and oil and gas recovery rates increased in three consecutive years
The remaining technically recoverable reserves and production of oil and gas continued to increase, but the reserves-to-production (R/P) ratio decreased in three consecutive years due to the rapid increase in oil and gas production. Despite such continuous decrease, the R/P ratio remained at high levels above 54 (Fig. 7a ). As of the end of 2023, the recovery rate of the remaining technically recoverable reserves of oil and gas around the world is 1.89%, among which the recovery rate of oil reserves is 1.97%, and the gas recovery rate is 1.79%; the recovery rate of recoverable oil and gas reserves is 1.11%, the recovery rate of recoverable oil reserves is 1.07%, and that of gas reserves is 1.17% (Fig. 7b ).
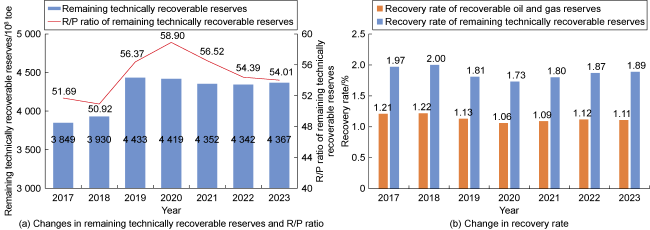
Fig. 7. Changes in the remaining technically recoverable reserves of oil and gas, R/P ratio and recovery rate from 2017 to 2023 [10]. |
2.6. Technological innovation/business model optimization facilitated global oil and gas development, and unconventional resources continued to play a leading role in contributing to high growth in oil and gas production
The huff and puff process using CO2 or natural gas as the displacing fluid has become one of the most efficient processes for enhanced oil recovery (EOR) from tight oil reservoirs. Through multiple huff and puff cycles, this EOR method injects CO2 or natural gas into natural and hydraulic fractures to replenish reservoir energy and thereby increase oil mobility and production. For example, EOG Resources Company conducted a huff and puff pilot test in the Eagle Ford Shale in 2012; after gas injection, the maximum daily oil production from a single well increased by 2-7 times, and the cumulative oil production was estimated to increase by 30%-50% [14]. In addition, waterflooding has become the key EOR method used in field tests in the Bakken Formation in Canada to further enhance oil recovery from tight oil reservoirs. The Bakken oil field in the Viewfield area is one of the largest unconventional oil fields under waterflooding in North America, where siltstone reservoirs have higher permeability compared with most tight oil reservoirs. Crescent Point conducted waterflooding tests on six units with inflow control devices (ICDs). The test results showed that waterflooding increased the oil recovery factor from 15% to 50% [15].
In addition to technical factors, independent oil companies leveraged special technical advantages and keen insights to develop domestic oil and gas resources and explore new ways for the development of unconventional oil and gas resources. Large oil companies actively participated in the exploration and development of tight/shale oil and gas resources and leveraged financial advantages to promote the large-scale development of shale gas resources by acquiring gas assets and establishing joint ventures for cooperation purposes. Technology service companies improved the operational efficiency and investment efficiency and promoted the coordinated development of shale oil and gas resources relying on their highly specialized expertise and technological succession. In addition, the governments took active steps to create positive policy environments by formulating and implementing long-term strategic plans for providing financial support and tax concessions, relaxing price controls, establishing and improving market supervision mechanisms.
The aforementioned efforts in technological innovation and business model optimization have enabled tight/shale oil and gas resources to play a leading role in driving significant growth in global oil and gas production. In 2023, the YoY growth in global oil and gas production is 1.05×10⁸ toe. Specifically, the YoY growth in tight/shale oil and gas production is 9 225×104 toe, the YoY growth in conventional oil and gas production in deepwater areas is 2 922×104 toe, the YoY growth in heavy oil/oil sand/CBM production is 1 220×104 toe, the YoY growth in onshore conventional oil production is 1 164×104 toe, the YoY decline in shallow-water conventional oil and gas production is 450×104 toe, and the YoY decline in onshore conventional gas production is 3 690×104 toe [10]. It is obvious that tight/shale oil and gas resources have become a critical force driving continued growth in global oil and gas production.
2.7. Oil companies have carried out strategic planning in advance for the exploration and development of associated strategic resources and rapidly gained access to new industries relying on technological accumulation
International oil companies have proactively adjusted their development strategies, successively entered the field of associated resources (Fig. 8 ), and secured various associated resources projects through investment, acquisition and cooperation in preparation for dealing with changes in the energy market in the future. On June 4, 2024, Warren Buffett, an American investor, joined hands with Occidental Petroleum Company and officially entered the lithium mining industry in the Imperial Valley of Southern California [16]. On September 4, 2024, ADNOC and ExxonMobil signed an agreement for cooperation in building the largest low-carbon hydrogen production plant in the world [17]. Focusing on associated resources not only demonstrates the efforts of energy giants in forward-looking strategic planning for the new energy sector, but it also indicates that the global energy sector is being transformed into a comprehensive, low-carbon and green alternative at an accelerating pace. As more similar projects are executed, the global energy landscape may evolve into a more diversified and sustainable development pattern.
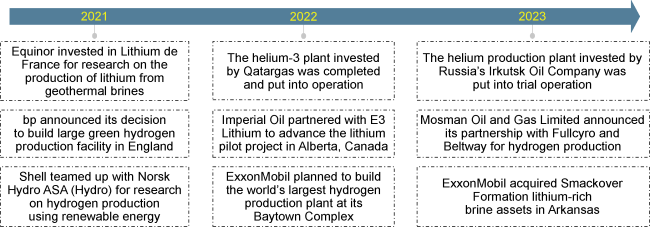
Fig. 8. Overview of associated resources projects deployed by international oil companies during 2021 to 2023. |
3. Insights and implications
Currently, oil and gas resources around the world still have huge development potential, and there is broad prospect for Chinese oil companies to improve profitability and become more competitive by implementing internationalization strategies. While adapting to the changes arising during global energy transition, Chinese oil companies should focus on their core businesses, take active steps to promote the development of tight/shale oil and gas resources in China and provide strong support to ensure national energy security; gain a deep understanding of the new energy security strategy, endeavor to promote all-round and in-depth international cooperation in the energy sector, develop new growth drivers in strategic emerging industries; continuously improve core competitiveness and enhance core functions to support the implementation of the Going Global Strategy, implement the essential requirements of high-quality development and new quality productivity, and contribute to building an integrated new energy system that ensures smooth succession, coordinated development, secure and sufficient energy supply to meet the domestic energy demand.
3.1. Identify development trends and focus on core businesses considering the fact that the global oil and gas industry is undergoing profound adjustments
The global economy is currently at the turning point between the end of the depression phase and the beginning of the recovery phase of the fifth Kondratieff cycle [18]. With the gradual elimination of excess capacity in global oil and gas industry and the recovery of production capacity in emerging fields driven by technological innovations and supporting policies, the expectations for global economic recovery are becoming increasingly strong, which may drive the global oil and gas demand to grow while fluctuating occasionally.
Despite the acceleration of the energy transition process driven by the global consensus on carbon neutrality, the role of oil and gas as a core part of the primary energy structure will remain unchanged in the short term. The goal of peak carbon dioxide emissions indicates that the expansion of fossil energy production capacity will be subject to more stringent restrictions in the medium to long term. However, oil and natural gas will still be the most important types of primary energy supporting global economic activities before 2040. The proportion of oil and gas in the primary energy structure is estimated to remain above 40%, indicating that oil and gas will play a bridging role in the energy transition process [19-20].
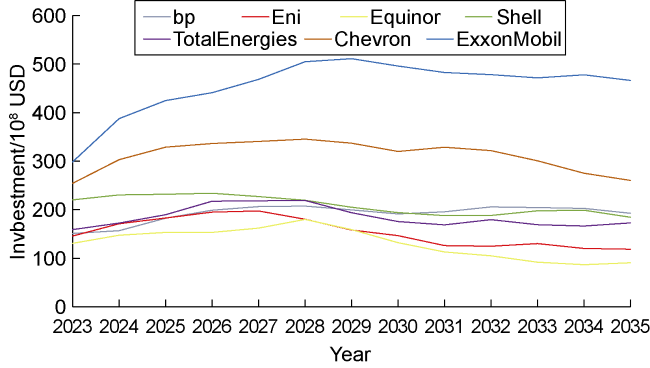
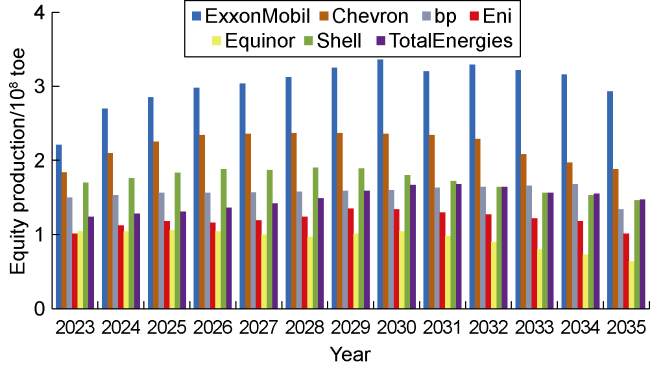
As the global economy gradually recovers from the recession induced by the COVID-19 pandemic, international oil companies (IOCs) have demonstrated high strategic flexibility and foresight and proactively adjusted the global oil and gas landscape. It is expected that IOCs will soon increase investment in the upstream sector, and their total investment in existing oil and gas projects will reach a peak of USD 1 856×108 by 2028 (Fig. 9 ), causing oil and gas production to increase steadily, and the total oil and gas production of existing projects will reach 13.17×108 toe by 2030 (Fig. 10 ). The actions taken by IOCs show their firm confidence in the long-term development of the oil and gas industry and mark their strong return to core businesses in the oil and gas market.
As suggested by an in-depth analysis of the background and reasons for the strategic adjustments made by IOCs, Chinese oil companies need to draw on the practices of ICOs, focus on upstream business, enhance oil and gas exploration and development, consolidate the role of old oil fields as the “ballast stone” for stable production, and accelerate large-scale development of oil and gas resources in onshore deep to ultra-deep formations, deepwater formations, and shale formations, increase the reserves and production, and implement the new energy security strategy in an all-round way.
3.2. Venture into emerging fields to support continued growth considering the huge development potential in the upstream sector of the oil and gas industry
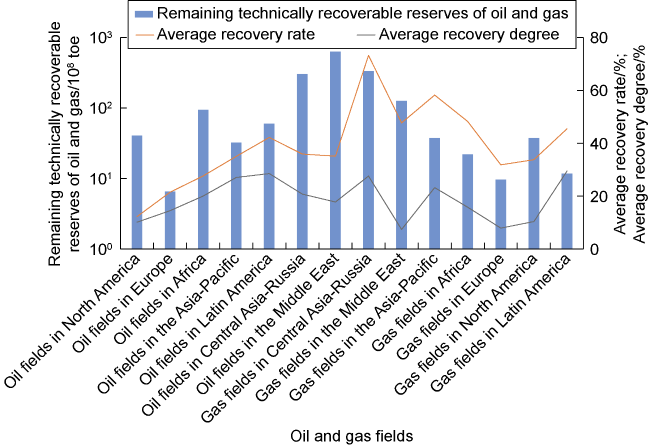
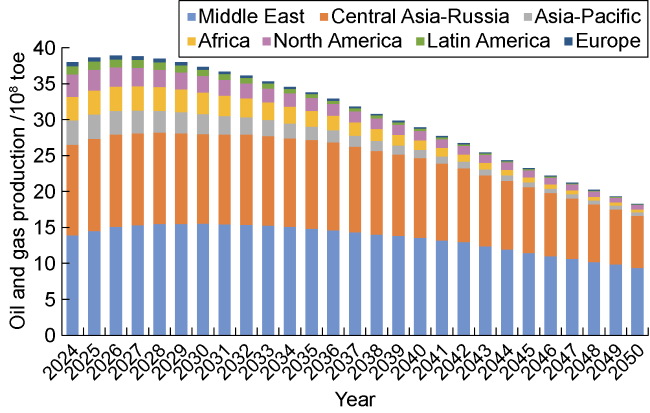
Onshore conventional oil and gas resources have broad prospects and huge potential for development. For onshore conventional oil fields around the world, the calibrated recovery rate is 34.21%, and the actual recovery degree is 19.29% [10]; for onshore conventional gas fields around the world, the calibrated recovery rate is 61.89%, and the current recovery degree is 21.05% [10]. These results show that onshore conventional oil and gas resources will play an important role in contributing to energy supply and increasing oil and gas production in the future (Fig. 11 ). Onshore conventional oil and gas production is expected to a peak of more than 38.78×10⁸ toe around 2027. As hotspots for oil and gas production, the Middle East and Central Asia-Russia will continue to play a key role in the future. The proportion of the total oil and gas production of these two regions in global oil and gas production is expected to increase significantly from 70% in 2024 to 91.04% in 2050, and will become the main driver of growth in the world’s onshore conventional oil and gas production (Fig. 12 ).
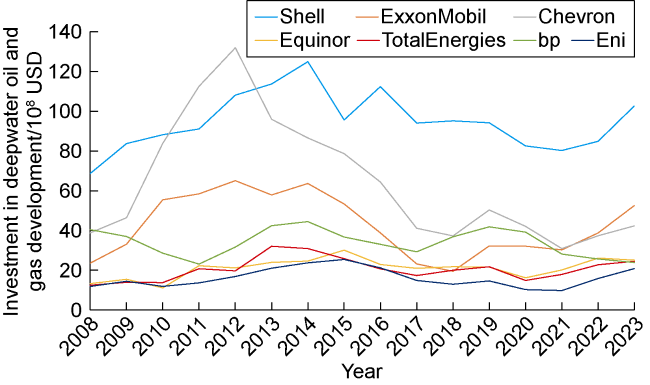
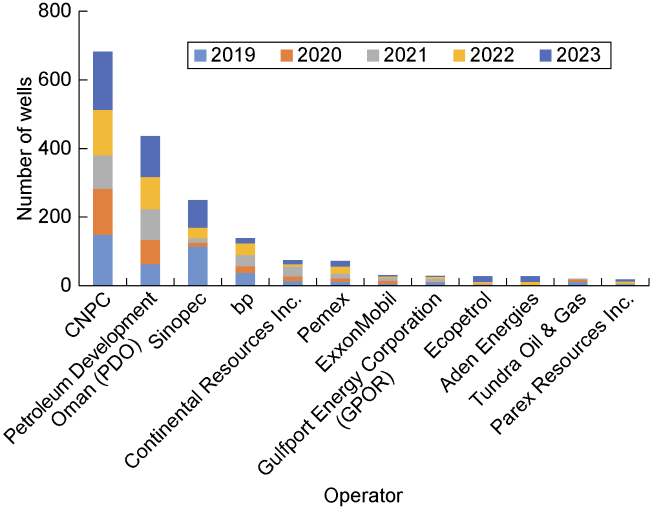
Due to high rates of return on investment in deepwater oil and gas assets, the seven major IOCs have shown a growing interest in investing in such assets since the end of the COVID-19 pandemic (Fig. 13 ), deepwater fields have become important areas for oil and gas production, and global deepwater oil and gas production has been rising continuously and is expected to reach a peak of 8.2×108 toe by 2032 [10]. The percentage of global proven oil and gas resources in deep to ultra-deep formations is low; the percentage of proven oil resources in deep to ultra-deep formations in China is 11%, and percentage of proven gas resources in deep to ultra-deep formations in China is 13%, indicating huge potential for exploration and development. For the period from 2019 to 2023, the average number of deep wells completed per year around the world is 406, including 137 ultra-deep wells; and the number of deep wells completed per year in China is 187, including 123 ultra-deep wells. Obviously, China is the country where deep wells, especially ultra-deep wells, are concentrated (Fig. 14 ).
Chinese oil companies should strengthen efforts in the exploration and development of oil and gas resources in onshore deep formations and deepwater areas because the exploration of deepwater areas can effectively compensate for their shortcomings, while the scientific exploration of deep formations can provide strong support for the extraction of deep oil and gas resources. Onshore deep formations and deepwater areas are expected to become important emerging fields for additional oil and gas production. Therefore, it is recommended to continuously promote technological innovation and digital development for geological theories, exploration and development technologies, engineering technology and equipment for onshore deep formations and deepwater areas in order to foster new quality productivity.
3.3. Considering the promising prospects of tight/ shale oil and gas resources, explore new pathways to ensure national energy security
With the acceleration of the global energy transformation and the implementation of energy security strategies, the seven major IOCs are increasing investment in the development of tight/shale oil and gas resources at an unprecedented level of intensity. The total amount of such investment is expected to reach a peak of USD 297×108 by 2029 and account for a proportion close to 30% of global oil and gas development investment by 2035 (Fig. 15 ), indicating that tight/shale oil and gas resources play an important role in global oil and gas supply [22-23].
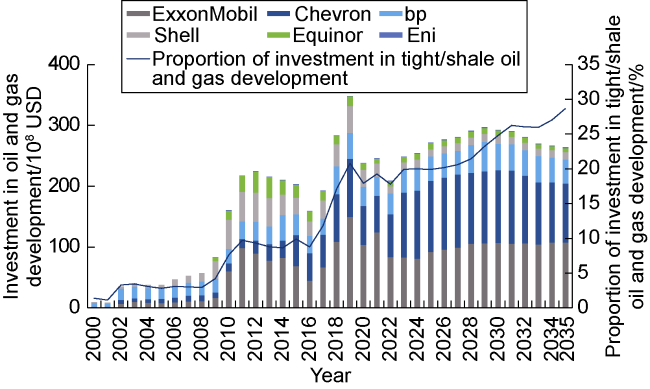
Fig. 15. Investment in the development of tight/shale oil and gas by the seven major IOCs over the years [10]. |
U.S. oil companies have adopted more proactive strategies for developing domestic oil and gas resources with a focus on the abundant tight/shale oil and gas resources in the USA. In addition to enhancing the economic and energy security of the USA, there are several other reasons as follows. (1) These strategies were implemented to fill the gap in EU energy supply created by the Ukraine crisis. Due to factors such as the imposition of sanctions on Russia energy exports and the Nord Stream pipeline attack, the EU was forced to turn to the United States for filling the gap in its energy supply, and the volume of the LNG (liquefied natural gas) exports to Europe increased of the USA significantly, which greatly stimulated the development of the domestic oil and gas industry of the USA [23]. (2) These strategies have enabled oil companies to quickly increase oil and gas reserves and production and reduce production costs. Oil and gas reserves and production are the “lifeline” for oil companies. Since 2020, the oil and gas production of some U.S. oil companies has declined to varying extents. Mergers and acquisitions can rapidly improve oil and gas production and reserves. Due to favorable resource endowment and technological progress, the cost of producing unconventional oil and gas in the USA is significantly lower than that in other regions such as Canada, Europe and Africa. The average production cost can be further reduced by merging and acquiring high- quality oil and gas assets. (3) These strategies can promote large-scale development. The centralized development of high-quality resources is favorable for oil companies to promote the application of new technologies, create synergies, optimize their organizational structures and operations, optimize oil and gas exploration and development plans from an overall perspective, and improve production efficiency [24]. Since the “Merger of the Century” in 2023, the tight/shale oil and gas production of the USA has increased significantly, and its proportion in the total domestic oil and gas production of the USA has increased, further consolidating the position of the USA as the largest oil and gas producer in the world [25-26]. Meanwhile, European oil companies have performed robustly in the development of tight/shale oil and gas resources, and their tight/shale oil and gas production remains at a relatively stable level, accounting for about 10% of global tight/shale oil and gas production (Fig. 16 ), which indicates their prudence in pursuing balance between energy diversification and environmental protection.
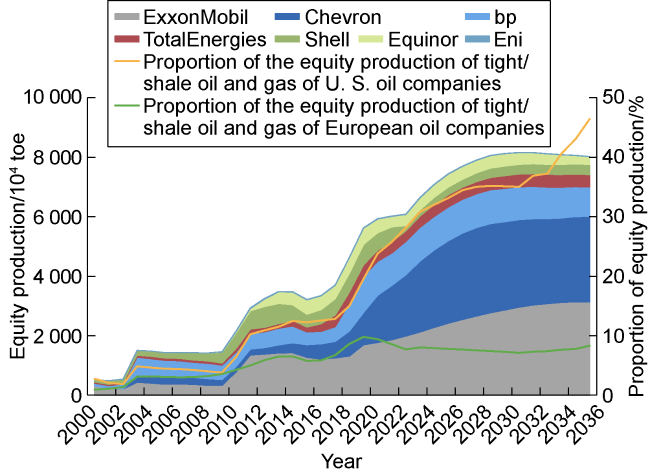
Fig. 16. Equity production of tight/shale oil and gas of the seven major IOCs from 2000 to 2036 [10]. |
In Latin America, Argentina drew on the experience of the USA in achieving energy independence through the shale revolution, enacted the Hydrocarbons Law in 2014, and launched a four-year subsidy program aimed at stimulating shale gas production in 2020 [27-28]. These are supporting policies demonstrating that Argentina attaches high importance to the development of shale oil and gas resources. In 2023, Argentina planned to invest USD (50-60)×108 per year, half of which was intended to be used directly for the development of shale oil and gas resources. The measures taken by Argentina have achieved remarkable results. For example, its tight/shale oil and gas production in 2023 was more than 3 969×104 toe (Fig. 17 ). These measures have not only improved Argentina’s energy self-sufficiency, but also significantly reduced Argentina’s dependence on gas imports from 23% in 2014 to 6% in 2023, injecting strong impetus into Argentina’s economic growth while ensuring its energy security.
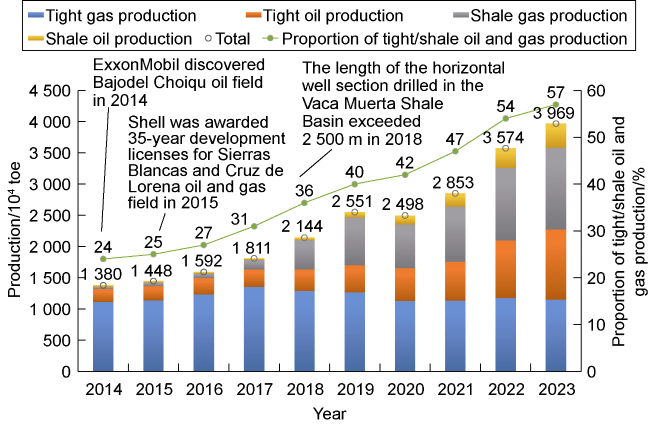
Fig. 17. History of tight/shale oil and gas production in Argentina [10]. |
In light of the trends in the development of tight/shale oil and gas resources around the world, Chinese oil companies are advised to consider the unique geological conditions related to shale oil and gas resources in China, fully understand the differences in resource endowments among different countries, strengthen technical communication and cooperation with international oil companies, deepen basic research on oil and gas development theories and methods, continuously optimize key engineering technologies, strive to find a pathway for the efficient development of shale oil and gas resources that suits the particular conditions in China, and provide support for their sustainable development and ensure China’s energy security.
3.4. Cutting-edge breakthroughs achieved in emerging industries of strategic importance in order to build an integrated energy supply system that ensures security of supply
With the progress of the energy transition and the widespread use of new energy products, the demand for lithium carbonate is rapidly growing. Global lithium demand is forecast to grow from the level of less than 100×104 t lithium carbonate equivalent (LCE) in 2023 to the level of more than 400×104 t LCE in 2040 (Fig. 18 ) at a compound annual growth rate of 9%.
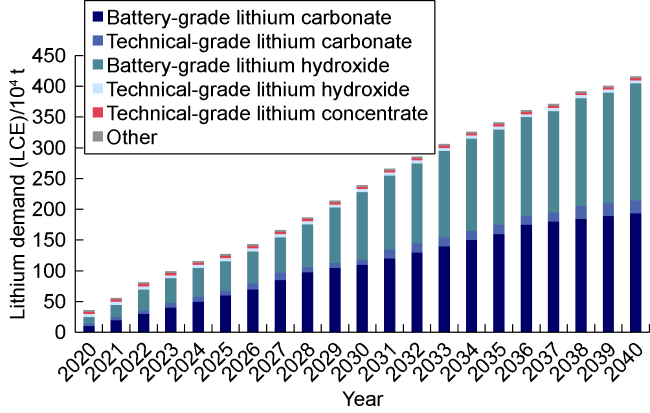
Fig. 18. Lithium demand by product type [29]. |
The helium supply of the USA in the global helium market is declining year over year, while Qatar and Russia are gradually filling up the gap in global helium supply. Qatar’s helium production has increased from 2 500×104 m3 in 2013 to 6 600×104 m3 in 2023. Russian helium production capacity building has been delayed due to the impact of the Russia-Ukraine conflict. The total helium production capacity of the Amur gas processing plant (Phase 1-Phase 3) is estimated to be 6 000× 104 m3 (Fig. 19 ).
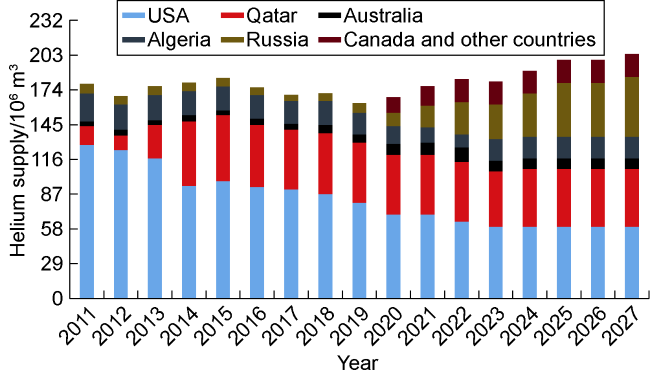
Fig. 19. Forecasts of helium supply in the global helium market [30]. |
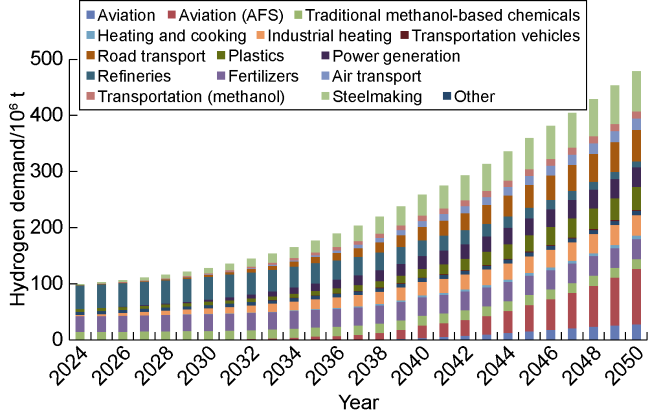
Gray hydrogen production is declining year over year, and green hydrogen production has entered the fast lane. It is estimated that global hydrogen demand will reach 4.79×108 t by 2050 (Fig. 20 ), while global hydrogen production will only reach 2.08×10⁸ t by then, resulting in a supply and demand gap of 2.71×10⁸ t. Specifically, global gray hydrogen production is expected to decline to 9 782× 104 t per year, with the proportion dropped to 47%, while global green hydrogen production is expected to increase rapidly to 8 460×104 t at a compound annual growth rate of 5.1%.
Fig. 20. Forecasts of hydrogen demand by different fields from 2024 to 2050 [31]. |
To deal with fluctuations in the global helium market, China needs to draw on the model employed by the USA with respect to strategic helium reserves and build a base for its strategic helium reserves. The Cliffside Storage Facility, enrichment plant, and pipeline system near Amarillo, Texas operated by the U.S. Bureau of Land Management can be used for crude helium storage by private companies to hedge against market price fluctuations caused by supply (inventory) and demand imbalances [32]. China can rely on the technological advantages accumulated in oil and gas exploration and development, take active steps to extend the oil and gas industry chain, and promote the building of an integrated energy supply system. The overseas projects of the Chinese oil companies are mainly distributed in salt-bearing basins in the Middle East, Kazakhstan and Brazil. These basins contain abundant brine resources, providing a solid foundation for lithium extraction. In addition, the presence of helium has been detected in mantle-derived gas fields in the Arctic Circle of the Russian Federation, Kazakhstan, and Turkmenistan, which have great potential for simultaneous development of oil, gas and associated resources.
4. Conclusions
This study presents an in-depth analysis of the distribution and production of oil and gas fields around the world, the distribution and changes of remaining recoverable reserves, the differences in oil and gas production between regions and countries, and the development potential of oil and gas fields unproduced and to be produced, conducts a comprehensive systematic review of the impact of post-pandemic era and geopolitical crises in reshaping the global oil and gas production, the changes in upstream capital expenditures and production costs, the exploration and development of oil and gas resources in onshore deep formations and deepwater areas, the strategies of the international oil companies for the development of unconventional oil and gas resources, and their advance strategic planning for the exploration and development of associated resources, and enlightenment and suggestions in four aspects are proposed. The purpose of this study is to, on the one hand, help Chinese oil companies to understand the general situation and major trends of global oil and gas development, fully leverage their advantages in terms of technology and resource, draw on successful experiences in oil and gas production, keep close track of the development trends in the oil and gas industry, and adjust their operating strategies in a timely manner. On the other hand, they can provide forward-looking strategic thoughts for the formulation of national energy strategies, energy development plans and oil and gas industry policies. In general, considering that the global oil and gas landscape is undergoing profound adjustments, Chinese oil companies should continue with the exploration and development of conventional oil and gas resources, continuously make technological breakthroughs for the exploitation of unconventional oil and gas resources and the deepwater oil and gas resources; conduct research on the distribution, development and utilization of oil and gas associated resources, draw on the common practices and management philosophies of international oil companies and the national oil companies of key host countries; prioritize the security of oil and gas supply, adapt to the context of the global low-carbon energy transition, continuously optimize upstream oil and gas assets, strive to complete the low-carbon energy transition smoothly; take ensuring national energy security as the core, fulfill responsibilities and obligations in respect of climate governance, develop core competencies for high-quality development, strengthen the ability to resist risks posed by global turbulence, and continuously improve the integrated energy supply system.