

Introduction
The technique of hydraulic fracturing assisted oil displacement (HFAD), a novel enhanced oil recovery method developed in recent years, integrates the technical advantages of hydraulic fracturing and chemical flooding. It shifts the traditional hydraulic fracturing approach from “promoting fracture extension” to “slowing fracture extension” and from “suppressing fracturing fluid filtration loss” to “promoting filtration loss” [1]. This adjustment effectively inhibits the premature breakthrough of the displacement phase front, which is typically caused by rapid fracture extension, thereby expanding the swept volume of the displacement phase and enhancing oil displacement efficiency [2]. Studies have shown that, under high-pressure injection conditions, HFAD can effectively supplement formation energy, improve reservoir porosity and permeability, expand the average pore throat radius, and reduce the adhesion work of crude oil on reservoir walls. This leads to a reduction in fluid seepage resistance and an increase in the fluid seepage velocity [3⇓-5]. Additionally, this technology can reduce the adsorption loss of the HFAD agent in the reservoir, thereby increasing the effective concentration of agent to achieve economical and efficient development [6-7].
Currently, HFAD technology is widely employed in the Daqing and Shengli oilfields, with pilot tests conducted in various continental sandstone oilfields, such as the Changqing, Tuha and Jiangsu oilfields, as well as in offshore low-permeability oilfields [8⇓⇓⇓-12]. In the Sazhong Development Zone of the Daqing Oilfield, for instance, potential tapping targets have progressively shifted from main oil layers to medium- and low-permeability reservoirs. Long-term waterflooding development has significantly depleted the formation energy, leading to challenges such as low utilization degree and difficulties in effective potential tapping with conventional methods. To address these issues, HFAD technology was implemented in 80 production wells in the area, and yielding positive outcomes. Taking the X well group as an example, the average daily oil production per well before the HFAD was 0.86 t, with an average water cut of 89.46%. Following the HFAD technology, the average daily oil production per well during the validity period increased to 5.74 t, while the average water cut decreased to 84.53%. The average effective production period per well was 253 d, resulting in an average cumulative oil increment of 1 452.22 t per well. These results demonstrate that HFAD technology can significantly reduce water cut while increasing oil output, thereby enhancing oil displacement efficiency [13⇓-15]. Despite these advancements, research on the theories of seepage of HFAD technology remains limited. The replenishment of formation energy by the high-pressure of HFAD technology effectively reduces agent adsorption loss, impacting the agent concentration field distribution and altering the fluid viscosity field. As a result, the conventional seepage model is no longer applicable. Consequently, fluid flow behavior after HFAD technology remains unclear, and theoretical guidance for engineering applications is insufficient, limiting the broader adoption of HFAD technology.
To address these issues, this study used medium- and low-permeability reservoirs in the Daqing Oilfield as a case, determining the relationship of dynamic adsorption capacity with permeability and pressure differential through inverse regression through dynamic adsorption experiments. Based on Darcy’s law, a HFAD nonlinear seepage model coupled with multiple factors was then developed by incorporating the adsorption loss of the HFAD agent during the process and introducing a viscosity-concentration variation equation. Finally, a sensitivity analysis of the model was conducted to clarify the influence of each parameter on fluid flow behavior within the matrix following HFAD.
1. Experimental study on the adsorption behavior of HFAD agents
1.1. Materials
The experimental reagents included the HFAD agent (petroleum sulfonate with an effective content of 70%, with its viscosity-concentration relationship curve shown in Fig. 1 ), Hyamine 1622 solution (0.004 mol/L), methylene blue solution (0.036 g/L), thymol blue solution (0.07 g/L), dilute sulfuric acid (10%) and chloroform.
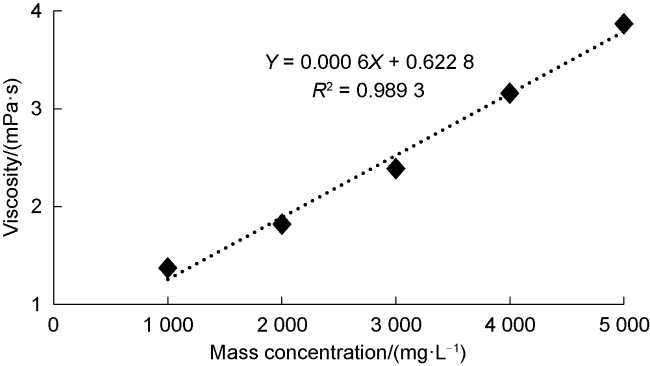
Fig. 1. Viscosity-mass concentration relationship of HFAD agent. |
The experimental water was re-injected water from the Sazhong Development Zone of the Daqing Oilfield, with a salinity of 3 681 mg/L.
The experimental core samples used in this study were artificial cores. Six natural cores were taken from the X well group in the Sazhong Development Zone, and the results of their mineral composition analysis are presented in Table 1 .Table 1 to ensure consistency across the dynamic adsorption experiments. The permeability of the artificial cores is (50-90)×10-3 μm2, with a total of 12 samples. The basic parameters of these core samples are provided in Table 2 .
Table 1. Mineral composition of the natural cores from the X well group in the Sazhong Development Zone |
| Sample No. | Quartz/% | Potassium feldspar/% | Plagioclase/% | Lithic/% | Clay minerals/% | Calcite/% | Dolomite/% |
|---|---|---|---|---|---|---|---|
| 1 | 47.50 | 7.80 | 27.90 | 4.50 | 11.38 | 0.80 | 0.12 |
| 2 | 47.90 | 7.70 | 29.30 | 4.30 | 10.34 | 0.40 | 0.06 |
| 3 | 48.10 | 7.90 | 28.85 | 4.20 | 10.30 | 0.60 | 0.05 |
| 4 | 49.20 | 7.63 | 27.90 | 4.30 | 10.35 | 0.55 | 0.07 |
| 5 | 49.00 | 7.60 | 27.80 | 4.30 | 10.70 | 0.50 | 0.10 |
| 6 | 48.80 | 7.70 | 28.30 | 4.20 | 10.40 | 0.52 | 0.08 |
| Mean | 48.42 | 7.72 | 28.34 | 4.30 | 10.58 | 0.56 | 0.08 |
Table 2. Fundamental parameters of dynamic adsorption experiments |
| Core No. | Core length/m | Diameter/ m | Permeability level/10−3 μm2 | Permeability/ 10−3 μm2 | Porosity/ % | Displacement pressure difference/MPa | Confining pressure/MPa |
|---|---|---|---|---|---|---|---|
| 1-1 | 0.1 | 0.025 | 50 | 50.34 | 17.42 | 0.1 | 3 |
| 1-2 | 0.1 | 0.025 | 49.96 | 17.13 | 0.5 | 3 | |
| 1-3 | 0.1 | 0.025 | 49.18 | 16.98 | 1.0 | 3 | |
| 1-4 | 0.1 | 0.225 | 50.27 | 17.38 | 1.5 | 3 | |
| 2-1 | 0.1 | 0.025 | 70 | 70.68 | 18.64 | 0.1 | 3 |
| 2-2 | 0.1 | 0.025 | 69.14 | 18.13 | 0.5 | 3 | |
| 2-3 | 0.1 | 0.025 | 69.43 | 18.28 | 1.0 | 3 | |
| 2-4 | 0.1 | 0.225 | 70.85 | 18.72 | 1.5 | 3 | |
| 3-1 | 0.1 | 0.025 | 90 | 90.46 | 19.76 | 0.1 | 3 |
| 3-2 | 0.1 | 0.025 | 89.13 | 19.43 | 0.5 | 3 | |
| 3-3 | 0.1 | 0.025 | 90.96 | 19.91 | 1.0 | 3 | |
| 3-4 | 0.1 | 0.025 | 89.81 | 19.62 | 1.5 | 3 |
1.2. Equipment
The primary equipment is the HBYQ-2 high-temperature and high-pressure core flow experimental apparatus (Fig. 2 ), which comprises a dual-cylinder constant-speed and constant-pressure pump, a piston container, pressure sensors, core holders, a thermostat chamber and various measuring instruments. Auxiliary equipments include hand pumps, vacuum pumps, timers, stirrers, electronic balances, graduated measuring cylinders with stoppers, micro-burettes and measuring test tubes.
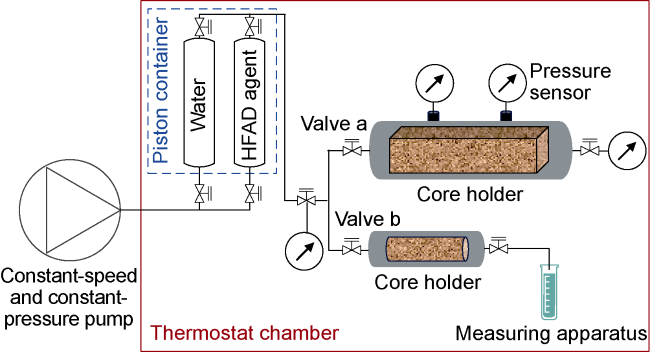
Fig. 2. The experimental setup. |
1.3. Design
The experimental steps are as follows: (1) Connect the apparatus as shown in Fig. 2 , ensuring valve b is opened and valve a is closed. Place the core in the core holder and evacuate it to saturate with water. (2) Open the valve on the top of the HFAD agent piston container, as well as the valves on both ends of the core holder. Start the constant-speed, constant-pressure pump to inject the HFAD agent at a constant pressure, as specified in the experimental setup in Table 2 .Table 2 are completed.
$ C=\frac{A^{\prime} V_{1} c_{\mathrm{h}} M}{1000 V} \times 100 \%$
$ \Gamma=\frac{\mathcal{C}_{0} V_{0}-\sum C_{i} V_{i}}{m}$
The principle for determining the concentration of the HFAD agent is as follows [7]: First, a 10% dilute sulfuric acid solution creates an acidic environment, chloroform serves as an extractant, methylene blue (a cationic dye) and thymol blue (an anionic dye) are used as indicators, and Hyamine 1622 solution (a cationic surfactant) is used to titrate the HFAD agent (petroleum sulfonate, an anionic surfactant). Before titration, the HFAD agent forms a blue complex with methylene blue. When mixed with thymol blue, this complex renders the lower organic phase a light purple-gray color, while the upper phase appears purple after interaction with the indicator. During titration, the Hyamine 1622 solution reacts with the HFAD agent, gradually lightening the purple color in the upper phase. Finally, the excess Hyamine 1622 solution reacts with thymol blue to form a yellow complex that is soluble in chloroform. Mixing this complex with methylene blue generates a yellowish-green color to the lower organic phase, marking the titration endpoint.
1.4. Results
The relationship curve between the dynamic saturation adsorption capacity of the HFAD agent within the core under various permeability conditions and the displacement pressure differential is shown in Fig. 3. It can be observed that the dynamic saturation adsorption capacity of the HFAD agent is negatively correlated with both permeability and pressure differential. Additionally, the trend in the change of dynamic saturation adsorption capacity with pressure differential remains consistent across different permeability conditions. The decline in dynamic saturation adsorption capacity slows after the pressure differential reaches a certain threshold. Lower core permeability, indicating poorer pore-throat connectivity, enhances the effect of high-pressure increased energy by HFAD in improving pore-throat connectivity, thereby significantly reducing adsorption. However, as permeability increases to a certain value, the impact of high-pressure increased energy by HFAD on pore-throat connectivity diminishes, weakening its effect on adsorption reduction.
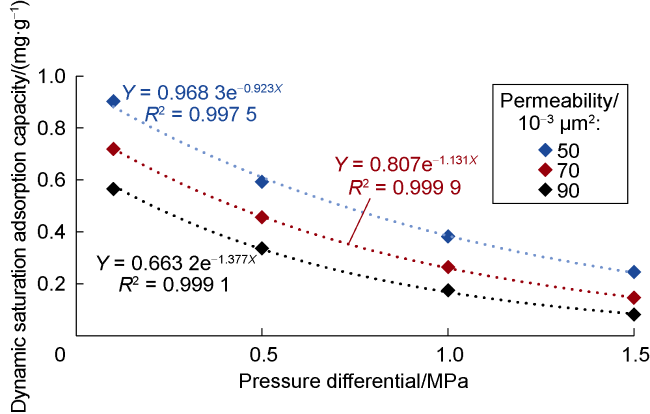
Fig. 3. Relationship between the dynamic saturation adsorption capacity of the HFAD agent under different permeability conditions and the displacement pressure differential. |
Analysis of the three curves in Fig. 3 reveals that, under different permeability conditions, the relationship between the dynamic saturation adsorption capacity of the HFAD agent within the core and the pressure differential follows an exponential trend. Based on this observation, a method is proposed to characterize the variations in the dynamic saturation adsorption capacity of the HFAD agent with respect to pressure differential and permeability. By regressing the variation results of dynamic adsorption capacity of HFAD agent with pressure differential under various permeability conditions, a relationship is established for the dynamic saturation adsorption capacity of the HFAD agent as a function of pressure differential and permeability:
$ \Gamma=a \mathrm{e}^{-b \Delta p}$
where coefficients a and b are related to matrix permeability. Fig. 4 illustrates the relationship for coefficients a and b as they vary with core permeability. The relationship between coefficients a and b as functions of core permeability is determined using inversion methods, and an equation is derived as follows:
$ \left\{\begin{array}{l} a=-0.517 \mathrm{~h} K_{\mathrm{m}}+2.9942 \\ b=0.7665 \mathrm{~h} K_{\mathrm{m}}-2.0859 \end{array}\right.$
Substituting Eq. (4) into Eq. (3) yields a relationship equation for the dynamic saturation adsorption capacity of the HFAD agent within the core and both displacement pressure differential and permeability:
$ \Gamma=\left(-0.517 \mathrm{~h} K_{\mathrm{m}}+2.9942\right) \mathrm{e}^{-\left(0.7665 \mathrm{~h} K_{v}-2.0859\right) \Delta p}$
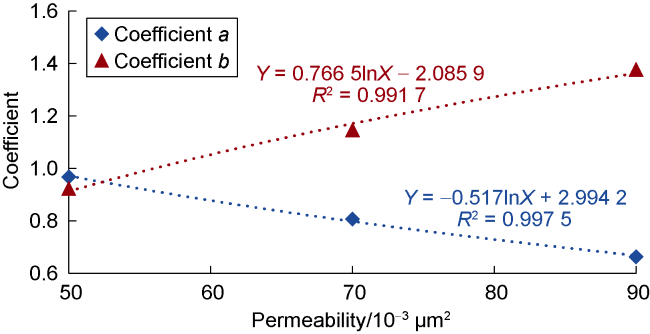
Fig. 4. Relationship of coefficients a and b with core permeability. |
2. Seepage model
2.1. Model assumptions
The HFAD technique employs hydraulic fracturing to inject the HFAD agent into the reservoir at high velocities, thereby opening fractures (assumed to be horizontal fractures, with the fracture expansion process not considered). As the fractures extend, the HFAD agent seeps into the upper and lower reservoir layers along the fracture path (ignoring the flow of HFAD agent from fracture tips into matrix), while fluids flow from the fracture into the matrix pores (Fig. 5 ).

Fig. 5. Schematic of the HFAD. |
The model assumptions are as follows: Fluid flow within the matrix conforms to Darcy’s law, with pressure changes in the fracture disregarded. The flow rates of injected fluid into the matrix above and below the fracture are assumed to be identical, and taking the upper half of the model for calculations. The matrix is considered homogeneous and isotropic, with single-phase, isothermal, planar, unidirectional flow occurring within it. The pressure distribution in the matrix, pm(x, r), is correlated to the fracture half-length (r) and seepage distance (x). Accounting for the adsorption loss of the HFAD agent within the matrix, the HFAD agent reaches dynamic saturation adsorption in the matrix within the swept range. Gravity effects are ignored, and both rocks and fluids are considered incompressible.
2.2. Development of the HFAD nonlinear seepage model coupled with multiple factors
The HFAD agent seeps from the fracture into the matrix (in the x-direction) under a differential pressure, with the fracture acting as the supply boundary at a supply pressure pf. The furthest distance that the HFAD agent flows in the reservoir is xe/2, with the boundary pressure at this location designated as pme. According to the law of conservation of mass, the total mass difference between the inflow and outflow of fluid within a flow cell per unit of time is numerically equal to the rate of change in the fluid mass within that cell. This implies that steady seepage occurs in the cell, where the fluid mass flowing in and out are equal, yielding the continuity equation [16]:
$ \frac{\partial\left(\rho_{w} V_{\mathrm{m}}\right)}{\partial X}=0$
The motion equation [17] is defined as follows:
$ V_{\mathrm{m}}=-10^{6} \frac{K_{\mathrm{m}}}{\mu_{\mathrm{m}}} \frac{\partial p_{\mathrm{m}}}{\partial X}$
Substituting Eq. (7) into Eq. (6) yields:
$ \frac{\partial\left(\frac{\rho_{\mathrm{m}} K_{\mathrm{m}}}{\mu_{\mathrm{m}}} \frac{\partial p_{\mathrm{m}}}{\partial X}\right)}{\partial X}=0$
Integrating Eq. (8) yields:
$ \frac{\partial p_{\mathrm{m}}}{\partial S}=C_{1} \mu_{\mathrm{m}}$
The viscosity-concentration relationship of the HFAD agent is determined by fitting the curve shown in Fig. 1 , leading to the viscosity variation equation:
$ \mu_{\text {m }}=0.0006 c+0.6228$
Considering the adsorption loss of the HFAD agent within the matrix, and assuming that the HFAD agent has reached dynamic saturation adsorption in the matrix rocks within the swept range, the mass of matrix rocks within the swept range is expressed as:
$ M_{\mathrm{m}}=10^{-6} \rho_{\mathrm{r}} X Z W$
The dynamic saturation adsorption of the HFAD agent within matrix rock is given by:
$ c_{1}=M_{\mathrm{m}} a e^{-b \Delta p}$
Thus, the relationship between the mass concentration of the HFAD agent in the matrix and the pressure differential is represented as:
$ c=c_{0}-\frac{10^{-3} \rho_{\mathrm{r}} A Y W a e^{-b \Delta g}}{g^{t / 2}}$
where qt represents the injection amount of the HFAD agent. The displacement pressure differential at position x in the matrix can be expressed as:
$ \Delta p=p_{\mathrm{f}}-p_{\mathrm{m}}$
Substituting Eq. (14) into Eq. (13) yields:
$ c=c_{0}-\frac{10^{-3} \rho_{\mathrm{r}} x Y W a \mathrm{e}^{-b\left(p_{r}-p_{1}\right)}}{q t / 2}$
Substituting Eq. (15) into Eq. (10) yields:
$ \mu_{\mathrm{m}}=0.0006 c_{0}-\frac{0.0006 \times 10^{-3} \rho_{\mathrm{r}} x Y W a e^{-b\left(p_{t}-D_{\mathrm{x}}\right)}}{g t / 2}+0.6228$
Substituting Eq. (16) into Eq. (9) yields:
$ \frac{\partial p_{\mathrm{m}}}{\partial X}=A-B X e^{b p_{\mathrm{m}}}$
where
$ \left\{\begin{array}{l}A=\left(0.0006 C_{0}+0.6228\right) \mathcal{C}_{\mathrm{I}} \\B=\frac{0.0006 \times 10^{-3} \rho_{\mathrm{r}} r W \mathcal{C}_{\mathrm{r}} a \mathrm{e}^{-b p_{r}}}{q t / 2}\end{array}\right.$
Using the method of variation of constants, the pressure distribution in the matrix is obtained as follows:
$ p_{\mathrm{II}}=\frac{-\mathrm{n}\left(\frac{B}{A} x-\frac{B}{b A^{2}}+C_{\mathrm{I}} \mathrm{e}^{-b A x}\right)}{b}$
Differentiating Eq. (19) yields:
$ \frac{\partial p_{\mathrm{m}}}{\partial x}=-\frac{1}{b} \frac{\frac{B}{A}-b A C_{\mathrm{I}} \mathrm{e}^{-b A x}}{\frac{B}{A} x-\frac{B}{b A^{2}}+C_{\mathrm{I}} \mathrm{e}^{-b A x}}$
Substituting Eq. (20) into Eq. (7) yields:
$ V_{\mathrm{m}}=10^{6} \frac{K_{\mathrm{m}}}{\mu_{\mathrm{m}}} \frac{B A-b A^{3} C_{\mathrm{I}} \mathrm{e}^{-b A x}}{B A b x-B+C_{\mathrm{Ir}} A^{2} b \mathrm{e}^{-b A x}}$
2.3. Model solution
The initial conditions of the model are given by:
$ \left\{\begin{array}{l} t=t_{\mathrm{n}} r=r, X=0, p_{\mathrm{m}}=p_{\mathrm{f}} \\ t=t_{\mathrm{m}} r=r, X=\frac{X_{\mathrm{e}}}{2}, p_{\mathrm{m}}=p_{\mathrm{me}} \end{array}\right.$
Since the pressure within the fracture varies under different injection displacement rate conditions, a relationship curve between the surface injection rate and fracture pressure was plotted with the field monitoring data from the Sazhong Development Zone of the Daqing Oilfield as the example to ensure model accuracy, as shown in Fig. 6. The fracture pressure rises rapidly and then stabilizes as the injection rate increases. Based on Fig. 6 , the relationship between fracture pressure and pumping rate is fitted as follows:
$ D_{\mathrm{f}}=-0.0737 q^{2}+1.1374 q+18.152$
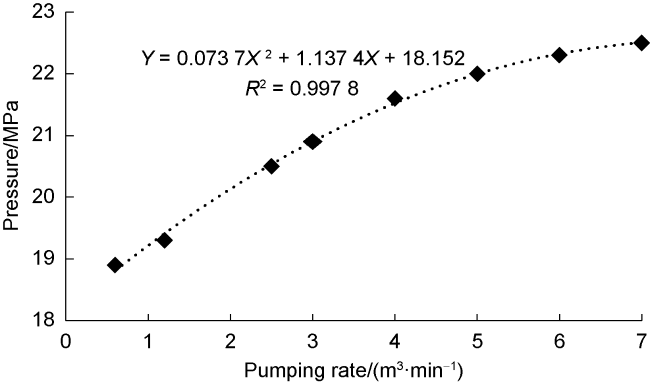
Fig. 6. Variation of pressure within the fracture under different injection conditions. |
2.4. Model validation
To validate the model, a HFAD experiment was conducted to simulate the flow process of the HFAD agent from the fracture toward the far end of the matrix. With the inlet face of the core as the fracture face, the HFAD agent flowing from the inlet toward the far end of the core represented the agent flowing into the upper and lower matrix of the reservoir along the fracture. The artificial core used in the experiment, as described in the previous section, has a size of 4.5 cm × 4.5 cm × 30.0 cm. Pressure measurement points were placed every 10 cm along the core holder to monitor pressure at different positions after the HFAD. The experimental setup shown in Fig. 2 was employed for the simulation, with valve an opened and valve b closed. After placing the core in the holder, it was evacuated and saturated with water, assuming an initial pressure of 0.1 MPa within the core (i.e., pme=0.1 MPa). No outlet was set in this experiment, focusing solely on simulating the injection process of the HFAD agent. The injection rate of the agent was set to 5 cm3/min, with a total injection volume of 20 cm3. At the end of HFAD, the pressure data from the four measurement points were recorded, and a pressure distribution along the core was plotted, as shown in Fig. 7. The pressure at the inlet end was 16.38 MPa, i.e., pf = 16.38 MPa, when using the model to calculate the pressure distribution within the core.
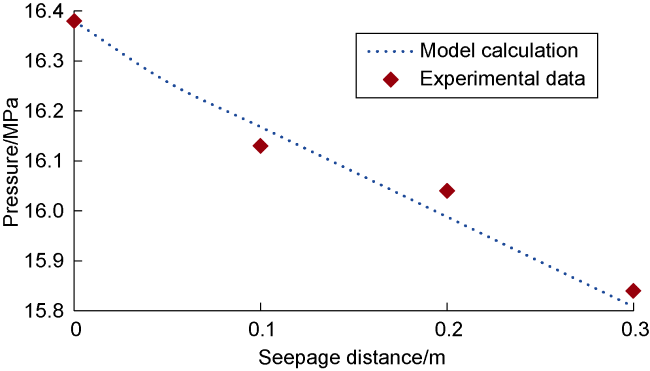
Fig. 7. Comparison between model calculations and experimental data of pressure. |
Based on the fundamental data presented in Table 3 , the theoretical model was used to calculate pressures at different positions within the core, and the results were compared with the experimental data (Fig. 7 ). As shown, the pressure distribution curves calculated by the theoretical model established in this study align well with the experimental results, indicating that the model can effectively simulate the HFAD process. However, the model does not account for gravity effects or the compressibility of rock and fluid, resulting in slight deviations between the simulation results and the experimental data.
Table 3. Fundamental parameters used for model validation |
| Parameters | Value | Parameters | Value |
|---|---|---|---|
| ρr | 1.963 g/cm3 | w | 4.5 cm |
| xe | 0.3 m | q | 5 cm3/min |
| c | 3 000 mg/L | t | 4 min |
| r | 4.5 cm | Km | 76.4×10⁻³ μm2 |
3. Analysis of influencing factors
To simplify calculations, the variable t was taken as the completion time, and the injection volume of the HFAD agent was set to 2 000 m3. The basic parameters are listed in Table 4 .
Table 4. Fundamental parameters for analysis of influencing factors |
| Parameter | Value | Parameter | Value |
|---|---|---|---|
| ρr | 1.963 g/cm3 | w | 20 m |
| xe | 2 m | q | 5 m3/min |
| c | 3 000 mg/L | t | 400 min |
| r | 70 m | Km | 70×10−3 μm2 |
By calculating the pressure, seepage velocity and HFAD agent mass concentration within the matrix during HFAD process, this study focused on analyzing the effects of matrix permeability, initial mass concentration of the HFAD agent, injection volume of the HFAD agent, pumping rate, and fracture length on the flow behavior of fluids in the matrix after HFAD. During the analysis of each parameter, only that parameter’s values were varied, while all other parameters were kept constant as specified in Table 4.
3.1. Matrix permeability
The relationships of pressure, seepage velocity, and HFAD agent mass concentration within the matrix with seepage distance under different matrix permeability conditions are shown in Fig. 8. As illustrated, pressure within the matrix, seepage velocity, and HFAD agent mass concentration are all positively correlated with matrix permeability. Compared with a matrix permeability of 50×10-3 μm2, at permeabilities of 60×10-3, 70×10-3, 80× 10-3, 90×10-3 and 100×10-3 μm2, the fluid seepage velocity at the far end of the matrix (at a seepage distance of 1 m) increased by 1.06%, 1.80%, 2.36%, 2.79% and 3.15%, respectively. The pressure rose by 4.40%, 7.68%, 10.22%, 12.24% and 13.89%, respectively, while the HFAD agent mass concentration increased by 0.22, 0.41, 0.56, 0.70 and 0.82 times, respectively. Matrix permeability is a critical factor that significantly influences pressure and HFAD agent mass concentration within the matrix after HFAD but has a relatively minor effect on seepage velocity. Greater matrix permeability results in higher pressure and agent concentration within the matrix after HFAD, leading to enhanced energy supplementation and improved oil washing efficiency.
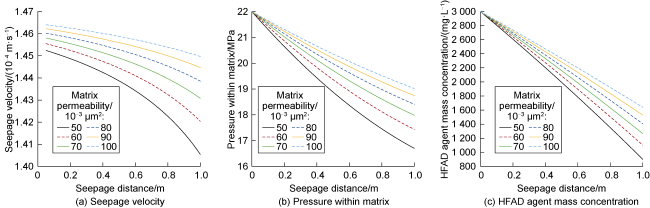
Fig. 8. Relationship curves of pressure, seepage velocity, and HFAD agent mass concentration within the matrix with seepage distance under different matrix permeability conditions. |
3.2. Initial mass concentration of HFAD agent
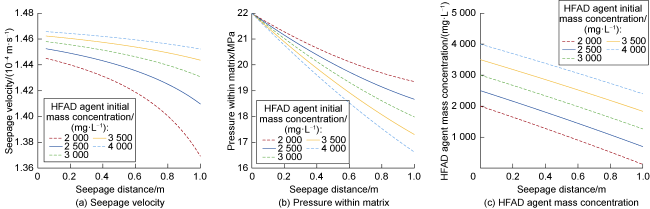
Fig. 9. Relationship curves of pressure, seepage velocity, and mass concentration of the HFAD agent within the matrix with seepage distance under different initial mass concentration conditions. |
3.3. Injection volume of HFAD agent
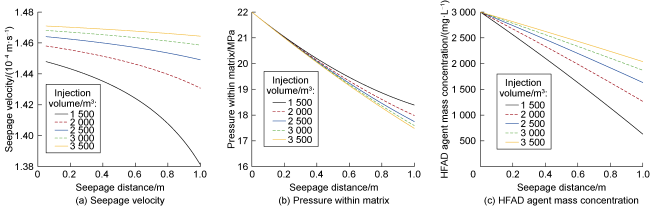
Fig. 10. Relationship curves of pressure, seepage velocity, and mass concentration of the HFAD agent within the matrix with seepage distance under different injection volume conditions. |
3.4. Pumping rate
The relationships of pressure, seepage velocity, and mass concentration of the HFAD agent within the matrix with seepage distance under varying pumping rate conditions are shown in Fig. 11. As illustrated, both the seepage velocity and agent concentration positively correlate with the pumping rate. Matrix pressure also shows a positive correlation with the injection rate at short seepage distances; however, beyond a certain distance, this relationship becomes negative. Compared with a pumping rate of 4 m3/min, increasing the rate to 4.5, 5.0, 5.5 and 6.0 m3/min resulted in seepage velocity increases at the far end of the matrix by 12.68%, 25.39%, 38.14% and 50.91%, respectively. Meanwhile, pressure decreased by 0.91%, 2.06%, 3.43% and 5.04%, respectively, and agent mass concentration increased by 0.04, 0.08, 0.11 and 0.15 times, respectively. These results indicate that the pumping rate directly affects seepage velocity within the matrix after HFAD, though it has a relatively minor effect on matrix pressure and agent concentration. Excessively high pumping rate may result in overly rapid seepage velocity and a premature breakthrough of the displacement phase front, ultimately reducing the swept area of the HFAD.
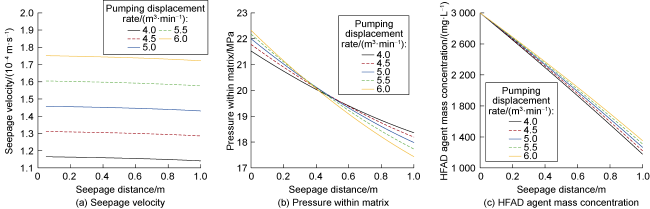
Fig. 11. Relationship curves of pressure, seepage velocity, and mass concentration of the HFAD agent within the matrix with seepage distance under different pumping rate conditions. |
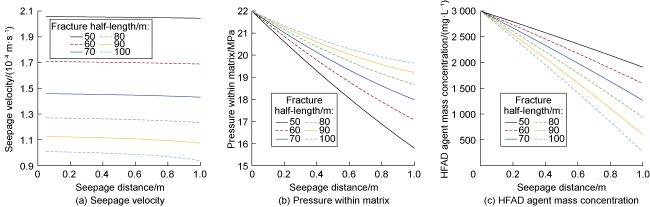
3.5. Fracture length
The relationships of pressure, seepage velocity, and mass concentration of the HFAD agent within the matrix with seepage distance under varying fracture length conditions are shown in Fig. 12. It is evident that both the seepage velocity and agent concentration negatively correlate with fracture half-length, whereas matrix pressure shows a positive correlation. Compared with a fracture half-length of 50 m, increasing the length to 60, 70, 80, 90 and 100 m resulted in seepage velocity decreases at the far end of the matrix by 17.39%, 29.98%, 39.65%, 47.46% and 54.15%, respectively. Meanwhile, pressure increased by 8.10%, 13.90%, 18.27%, 21.68% and 24.41%, respectively, and agent mass concentration decreased by 16.73%, 33.77%, 51.02%, 68.42% and 85.92%, respectively. These results indicate that fracture length directly affects seepage velocity after HFAD, playing a crucial role in influencing pressure and agent mass concentration within the matrix. Longer fractures result in lower seepage velocities and agent mass concentrations but higher pressure within the matrix after HFAD, thereby enhancing energy supplementation and expanding the swept area, while reducing oil washing efficiency.
Fig. 12. Relationship curves of pressure, seepage velocity, and mass concentration of the HFAD agent within the matrix with seepage distance under different fracture length conditions. |
5. Conclusions
Matrix permeability, fracture length, and the initial concentration of the HFAD agent are key parameters that influence the effect of HFAD technology on energy supplementation. Among these, matrix permeability and fracture length positively impact energy supplementation. The oil washing efficiency of HFAD technology is primarily affected by the initial concentration of HFAD agent, injection volume, and fracture length. Higher initial mass concentration and injection volume increase the HFAD agent mass concentration within the matrix after HFAD, thereby enhancing oil washing efficiency. Additionally, fracture length and pumping rate directly impact the seepage velocity within the matrix after HFAD. These factors can control the position of the displacement phase front, therefore influencing the swept area.
In the field practical applications of HFAD technology, reservoirs with relatively favorable porosity and permeability should be prioritized. Furthermore, the initial concentration, injection volume, pumping rate of the HFAD agent, and the fracture length should be selected based on specific reservoir conditions and production requirements, so as to ensure that HFAD technology can effectively supplement formation energy, expand the swept volume of displacement phase, and maintain an adequate HFAD agent concentration at the far end of matrix, ultimately enhancing oil recovery efficiency.
Nomenclature
a, b—coefficients in the fitting relationship equation, dimensionless;
A’—correction coefficient, dimensionless;
c—mass concentration of the HFAD agent in the matrix, mg/L;
ch—concentration of Hyamine solution, mol/L;
c0—initial mass concentration of the HFAD agent, mg/L;
c1—dynamic saturation adsorption capacity of the HFAD agent in the matrix, g;
C—mass concentration of the HFAD agent, mg/L;
CI, CII—constants, dimensionless;
Ci—mass concentration of the HFAD agent in the i-th produced fluid, mg/L;
i—produced fluid number;
Km—matrix permeability, 10ー3 μm2;
m—core mass, mg;
M—average equivalent mass of petroleum sulfonate, g/mol;
Mm—mass of matrix rock within the swept range, g;
pf—pressure in the fracture, MPa;
pm—pressure in the matrix, MPa;
pme—matrix boundary pressure, MPa;
Δp—displacement pressure differential, MPa;
q—pumping rate, m3/min;
r—fracture half-length, m;
t—injection time, min;
vm—seepage velocity, m/s;
V—produced fluid volume, mL;
V0—injected volume of HFAD agent, mL;
V1—volume of Hyamine solution used in titration, mL;
Vi—volume of the i-th produced fluid, mL;
w—fracture width, m;
x—seepage distance, m;
xe—matrix thickness, m;
Γ—dynamic saturation adsorption capacity of the HFAD agent, mg/g;
µm—viscosity of the HFAD agent, mPa·s;
ρr—matrix rock density, g/cm3;
ρw—displacement phase density, g/cm3.