

Introduction
The global energy strategy and supply-demand pattern are undergoing a profound transformation, marked by significant shifts. This period is characterized by green “new energy revolution” in China, driven by wind-solar-hydrogen-energy storage technologies, and the black “shale oil and gas revolution” in the United States [1], both of which are accelerating the global energy transition. “Wind and solar energy” have officially entered the “wind and solar era” under the action of new quality productive forces, and the new energy era is progressing ahead of schedule, ushering in a new chapter in the energy revolution.
Energy security is a global and strategic issue critical to a country’s economic and social development. It plays a pivotal role in national prosperity, improving people’s lives, and ensuring long-term social stability. The energy system can be categorized into single-energy, multi- energy and super-energy systems. China has introduced a new energy security strategy—“four revolutions and one cooperation” [2]—which outlines the path for high-quality energy development in the new era. New quality productive forces are green productive forces, China is accelerating the establishment of a clean, low-carbon, safe and efficient new energy system. Significant transformations are occurring in energy production and utilization, with notable progress in high-quality energy development.
When examining global primary energy consumption, production, import and export volumes, as well as per capita consumption in 2023, China stands as the world’s largest producer, consumer and importer of energy. It produced 33.86×10⁸ tons of oil equivalent (toe), consumed 40.78×10⁸ toe, and imported 6.92×10⁸ toe [3]. Russia is the largest energy exporter, with exports totaling 6.13×10⁸ toe [3]. Japan, with the highest dependence on imported energy globally, produced 0.69×10⁸ toe, consumed 4.16×10⁸ toe, and imported 3.47×10⁸ toe, resulting in an imported energy dependency of 83% [3]. Qatar leads the world in per capita energy consumption, with 19.51 toe per person—10.6 times the global average of 1.84 toe [3].
The current energy mix of China is characterized by what is referred to as “three highs and one low”: high carbon content, high carbon emissions from energy use, high dependence on imported oil and gas, and low production and utilization of new energy. The main cause of China’s insecurity today of China is its heavy reliance on foreign oil and gas imports. To address this, China needs to develop oil and gas from underground coal rocks and start revolution of the production of shale oil and gas. Looking ahead, future energy insecurity will primarily stem from the high dependence on imported key minerals required for new energy technologies. Therefore, there is a pressing need to enhance the development and supply of these critical minerals. To ensure both current and future energy security, China must take a comprehensive approach based on “four systems”: the whole coal system (both above and below ground), the whole petroleum system (including both conventional and unconventional sources), the whole energy system (fossil fuels and new energy), and the whole carbon cycle system (encompassing carbon emissions, utilization, and storage). This holistic approach will guide the clean use of coal, the efficient development of unconventional oil and gas, the accelerated development of new energy, and the steady progression toward carbon neutrality. The development path of China is centered on a “multi-energy superposition system”. This system integrates both underground fossil energy and above-ground wind and solar new energy sources, with an ordered distribution of fossil energy and the sustainable generation of wind and solar energy. It emphasizes the intelligent integration of various energy forms. Furthermore, the potential for carbon capture, utilization and storage (CCUS), or carbon capture and storage (CCS), is significant and should be thoroughly explored. For the energy security of China, both now and in the future, it is critical to adhere to “three key red lines”: limiting the overall dependence on imported energy to less than 20%, restricting the dependence on imported gas to less than 50%, and ensuring the domestic oil production above 2×10⁸ t annually. To navigate the multiple challenges posed by climate change, energy security and supply, China must break through three major barriers: the limit of unconventional recovery, the scale of CCUS/CCS, and the economic limits of new energy technologies. The new energy revolution of China will make significant contributions to the global fight against climate change, help achieve the goal of carbon neutrality, and facilitate the green transformation of the energy sector [4].
Global human development faces four major security challenges: food security, energy security, homeland security and climate security. To address these challenges, the health of the Earth, food, energy, economy and climate are essential. In the context of carbon neutrality, new energy has been repositioned as a resource that combines the properties of conventional energy with the carbon-neutral characteristics of green development. It now carries the critical mission of “energy transition + energy security + energy power + energy independence”. From the perspective of the new quality productive forces, this paper explores the energy industrial revolution, carbon emissions, and the global shift to green energy under the goal of carbon neutrality. It also reviews the achievements and significance of the green new energy revolution of China with respect to wind, solar, hydrogen and energy storage. Furthermore, it introduces the innovative “Energy Triangle” theory, which moves from “impossible” to “achievable” to “sustainable”, and argues that “energy independence” can be realized through the “technological independence” of new energy. The new energy revolution will undoubtedly inject vital green energy into the modernization process of China [5].
1. Global transition to green energy under the goal of carbon neutrality
1.1. Accelerating global green energy transition
“Green Energy Transition” refers to the shift towards a clean and low-carbon energy mix through innovations in green energy technology, safe and efficient energy production and consumption, intelligent integration of multiple energy sources, significant reductions in carbon emissions, and advancements in carbon utilization and storage. This transformation supports the achievement of carbon neutrality, energy independence and sustainable green development.
The global energy system has evolved from the firewood era to the coal era, and then to the oil and gas era. It is now rapidly transitioning into the third transition stage of the new energy era (Fig. 1 ). Within this context, the global oil and gas industry has exhibited a new trend characterized by unconventional oil and gas, old oil and gas fields, deep-layer and deep-water oil and gas exploration, and “three integrations” comprising CCUS/CCS integration, zero-carbon new energy integration and data intelligence integration. The rapid development of the oil and gas industry has been driven by six breakthroughs: (1) the industrial exploitation of shale and coal rock oil/gas overrides the traditional insight that shale or coal can only serve as source rock, but not reservoir rock; (2) the discovery of micro- and nano-sized pore throat reservoir systems breaks the “lower limit of migration and accumulation” of oil and gas within macroscopic pores in conventional reservoirs; (3) the identification of “continuous” sweet spots challenges the conventional hydrocarbon accumulation model in “single-sandbody” trap; (4) platform-based multi-horizontal well volumetric fracturing transcends the core technology of conventional vertical well drilling for depletion extraction; (5) the integration of geology and engineering, in conjunction with low-cost development, goes beyond the traditional siloed management thinking; and (6) the concept of total energy potential in carbon-neutral super basins challenges the traditional strategic view that exploration is confined solely to oil and gas resources.
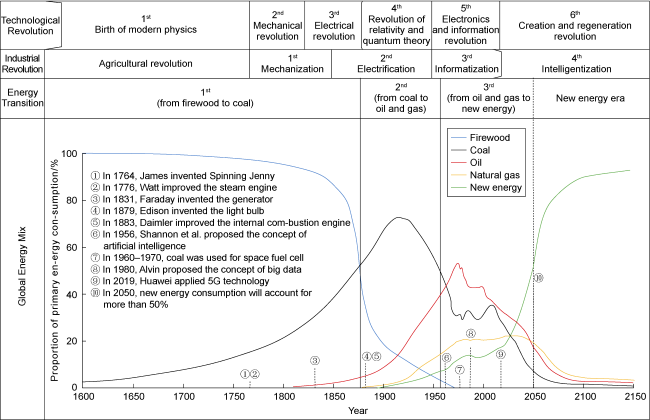
Fig. 1. History of the global energy utilization and development (the data prior to 2023 are sourced from Reference [3], while the subsequent data consist of comprehensive prediction results). |
Energy resources exhibit three key characteristics: coal is limited in resources and high in carbon emissions, oil and gas are finite and non-renewable, and new energy sources are unlimited and environmentally friendly. In the global energy landscape, coal has entered a transition period, oil is in a stabilization period, natural gas is reaching its peak period, and new energy is in its “golden” period. At the same time, there is a simultaneous acceleration in the development of low- carbon fossil energy, large-scale deployment of new energy, and the advancement of intelligent energy management systems. These efforts are driving the global energy sector toward a high-quality, green and low-carbon transformation [6]. Based on the evolving energy consumption patterns in both world and China, as well as the rapid development of new energy technologies, we are entering a phase of accelerated growth for new energy. The convergence of the sixth scientific and technological revolution, the fourth industrial revolution, and the third energy revolution is expected to hasten the onset of the new energy era (Fig. 1 ) [3]. By 2050, it is projected that new energy will account for more than 50% of the global primary energy consumption.
In 2023, the global clean energy consumption continued to rise, with the combined share of natural gas and new energy sources up to 41.83% [3]. The global primary energy consumption in 2023 reached 148×108 toe, with coal corresponding to 26.47%, oil 31.70%, natural gas 23.30% and new energy, including nuclear, hydropower and renewables, contributing 18.53%. In China, the primary energy consumption was 40.78×10⁸ toe, with coal accounting for 53.85%, oil 19.18%, natural gas 8.53% and new energy 18.44% (Table 1 ). From 2014 to 2023, the share of global non-fossil energy consumption grew from 13.6% to 18.5%, with China contributing 45.2% of the global increase of 4.9 percentage points [7].
Table 1. Composition of primary energy production and consumption in China, United States and around the world in 2023 |
| Energy source | World | United States | China | |||||||||
|---|---|---|---|---|---|---|---|---|---|---|---|---|
| Production/108 t | Proportion/% | Consumption/108 t | Proportion/% | Production/108 t | Proportion/% | Consumption/108 t | Proportion/% | Production/108 t | Proportion/% | Consumption/108 t | Proportion/% | |
| Oil | 45.14 | 30.04 | 46.92 | 31.70 | 8.27 | 33.93 | 8.56 | 38.01 | 2.09 | 6.17 | 7.82 | 19.18 |
| Natural gas | 34.90 | 23.22 | 34.48 | 23.30 | 8.90 | 36.52 | 7.62 | 33.84 | 2.01 | 5.95 | 3.48 | 8.53 |
| Coal | 42.81 | 28.49 | 39.18 | 26.47 | 2.83 | 11.60 | 1.96 | 8.70 | 22.24 | 65.66 | 21.96 | 53.85 |
| Nuclear power | 5.87 | 3.91 | 5.87 | 3.97 | 1.75 | 7.18 | 1.75 | 7.77 | 0.93 | 2.75 | 0.93 | 2.28 |
| Hydropower | 9.47 | 6.30 | 9.47 | 6.40 | 0.53 | 2.17 | 0.53 | 2.35 | 2.74 | 8.09 | 2.74 | 6.72 |
| Renewable | 12.08 | 8.04 | 12.08 | 8.16 | 2.10 | 8.60 | 2.10 | 9.33 | 3.85 | 11.38 | 3.85 | 9.44 |
| Total | 150.27 | 100 | 148.00 | 100 | 24.38 | 100 | 22.52 | 100 | 33.86 | 100 | 40.78 | 100 |
Note: Both production and consumption data are in oil equivalent. |
In 2023, the top 10 countries in the world by primary energy consumption accounted for a total of 99.67×10⁸ toe (Table 2 ), accounting for 67.3% of the global energy consumption. These countries collectively produced 98.98×10⁸ toe (Table 3 ), which made up 65.9% of the global energy production. Among them, China, India, Japan, and South Korea had energy production lower than their consumption, with Japan and South Korea having particularly low production-to-consumption ratios (smaller than 0.2). This highlights the high level of energy dependence in the Asia-Pacific region on foreign sources.
Table 2. Energy consumption of Top 10 countries in 2023 [3] |
| Country | Oil | Natural gas | Coal | Nuclear power | Hydropower | Renewable | Total/108 t | Per capita consumption/t | Per capita consumption ranking | ||||||
|---|---|---|---|---|---|---|---|---|---|---|---|---|---|---|---|
| Consumption/ 108 t | Proportion/% | Consumption/ 108 t | Proportion/% | Consumption/ 108 t | Proportion/% | Consumption/ 108 t | Proportion/% | Consumption/ 108 t | Proportion/% | Consumption/ 108 t | Proportion/% | ||||
| China | 7.82 | 19.17 | 3.48 | 8.54 | 21.959 | 53.85 | 0.93 | 2.28 | 2.74 | 6.71 | 3.854 | 9.45 | 40.78 | 2.86 | 37 |
| United States | 8.56 | 38.03 | 7.62 | 33.85 | 1.958 | 8.69 | 1.75 | 7.77 | 0.53 | 2.34 | 2.097 | 9.31 | 22.52 | 6.62 | 11 |
| India | 2.53 | 27.10 | 0.54 | 5.78 | 5.250 | 56.34 | 0.10 | 1.11 | 0.33 | 3.58 | 0.569 | 6.10 | 9.32 | 0.65 | 81 |
| Russia | 1.72 | 23.05 | 3.90 | 52.16 | 0.916 | 12.25 | 0.47 | 6.23 | 0.45 | 6.00 | 0.023 | 0.30 | 7.47 | 5.17 | 15 |
| Japan | 1.59 | 38.24 | 0.79 | 19.12 | 1.084 | 26.07 | 0.17 | 3.99 | 0.17 | 4.00 | 0.357 | 8.58 | 4.16 | 3.37 | 28 |
| Canada | 1.04 | 31.20 | 1.04 | 31.16 | 0.089 | 2.66 | 0.19 | 5.73 | 0.81 | 24.42 | 0.162 | 4.85 | 3.33 | 8.59 | 8 |
| Brazil | 1.22 | 36.82 | 0.26 | 7.78 | 0.137 | 4.13 | 0.03 | 0.94 | 0.96 | 28.89 | 0.710 | 21.44 | 3.31 | 1.53 | 65 |
| Iran | 0.84 | 27.55 | 2.11 | 69.54 | 0.019 | 0.62 | 0.01 | 0.47 | 0.05 | 1.67 | 0.005 | 0.16 | 3.04 | 3.40 | 27 |
| South Korea | 1.28 | 43.14 | 0.52 | 17.39 | 0.643 | 21.67 | 0.39 | 13.03 | 0.01 | 0.28 | 0.134 | 4.50 | 2.97 | 5.73 | 13 |
| Saudi Arabia | 1.77 | 64.07 | 0.98 | 35.42 | 0.001 | 0.04 | 0 | 0 | 0 | 0 | 0.013 | 0.47 | 2.77 | 7.50 | 10 |
| World | 46.92 | 31.70 | 34.48 | 23.30 | 39.179 | 26.47 | 5.87 | 3.97 | 9.47 | 6.40 | 12.081 | 8.16 | 148.00 | 1.84 | |
Note: The consumption data is in oil equivalent. |
Table 3. Energy production of the Top 10 countries by energy consumption in 2023 [3] |
| Country | Oil | Natural gas | Coal | Nuclear power | Hydropower | Renewable | Total/ 108 t | ||||||
|---|---|---|---|---|---|---|---|---|---|---|---|---|---|
| Consumption/ 108 t | Proportion/% | Consumption/ 108 t | Proportion/% | Consumption/ 108 t | Proportion/% | Consumption/ 108 t | Proportion/% | Consumption/ 108 t | Proportion/% | Consumption/ 108 t | Proportion/% | ||
| China | 2.09 | 6.17 | 2.01 | 5.95 | 22.237 | 65.66 | 0.93 | 2.75 | 2.74 | 8.08 | 3.853 | 11.38 | 33.86 |
| United States | 8.27 | 33.93 | 8.90 | 36.52 | 2.828 | 11.60 | 1.75 | 7.17 | 0.53 | 2.17 | 2.097 | 8.60 | 24.37 |
| India | 0.33 | 5.81 | 0.27 | 4.86 | 4.001 | 71.42 | 0.10 | 1.83 | 0.33 | 5.93 | 0.568 | 10.15 | 5.60 |
| Russia | 5.42 | 39.84 | 5.04 | 37.08 | 2.20 | 16.18 | 0.47 | 3.43 | 0.45 | 3.30 | 0.024 | 0.18 | 13.60 |
| Japan | 0 | 0 | 0 | 0 | 0.004 | 0.55 | 0.17 | 24.09 | 0.17 | 24.09 | 0.356 | 51.27 | 0.69 |
| Canada | 2.78 | 47.26 | 1.64 | 27.83 | 0.296 | 5.04 | 0.19 | 3.25 | 0.81 | 13.85 | 0.162 | 2.76 | 5.88 |
| Brazil | 1.84 | 48.86 | 0.20 | 5.34 | 0.024 | 0.64 | 0.03 | 0.83 | 0.96 | 25.48 | 0.709 | 18.87 | 3.76 |
| Iran | 2.14 | 48.97 | 2.16 | 49.45 | 0 | 0 | 0.01 | 0.33 | 0.05 | 1.15 | 0.005 | 0.11 | 4.38 |
| South Korea | 0 | 0 | 0 | 0 | 0.003 | 0.58 | 0.39 | 72.87 | 0.01 | 1.35 | 0.134 | 25.19 | 0.53 |
| Saudi Arabia | 5.32 | 84.25 | 0.98 | 15.56 | 0 | 0 | 0 | 0 | 0 | 0 | 0.012 | 0.19 | 6.31 |
| World | 45.14 | 30.04 | 34.90 | 23.23 | 42.811 | 28.49 | 5.87 | 3.91 | 9.47 | 6.30 | 12.081 | 8.04 | 150.27 |
Note: The production data is in oil equivalent. |
An analysis of changes in the global energy consumption from 1970 to 2023 (Fig. 2 ) reveals significant shifts in the energy mix. The share of oil and coal decreased from 47% and 30% to 32% and 26%, respectively. In contrast, the proportion of natural gas increased from 17% to 23%, and the share of non-fossil energy grew from 6% to 19% [3]. In 2022, the global natural gas consumption totaled 4.16×10¹² m3, with the breakdown of usage as follows: electricity (39.4%), industry (20.7%), residential (20.9%), transport (3.6%), and others (15.4%) [8]. The International Energy Agency (IEA) forecasted that natural gas production and demand will peak by 2030, each reaching 4.30×10¹² m3 [8]. In China, the changes in energy consumption from 1970 to 2023 indicate a faster pace of low-carbon transition compared to the global average. The proportion of coal consumption has dropped significantly, from 82% to 54%, while the shares of oil and natural gas consumptions have risen from 14% and 1% to 19% and 9%, respectively. Additionally, the proportion of non-fossil energy consumption in China has increased from 3% to 18%.
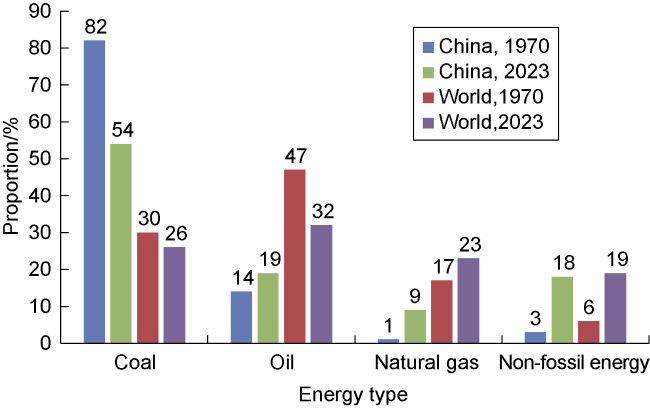
Fig. 2. Changes in the energy mix of the world and China, 1970-2023 [3]. |
The United Kingdom aims to become a new energy superpower. When the new Labour Government assumed power on July 5, 2024, its top priority was to take more ambitious action toward achieving net-zero emissions [9]. The government has unveiled a legislative plan for the creation of Great British Energy, which will receive £8.3 billion (approximately RMB 78.3 billion) in the new parliament to position the UK as a world leader in floating offshore wind, nuclear energy and hydrogen [9]. The Labour Government also plans to introduce a series of policies to support the energy transition and green economic growth, including the Energy Independence Act, with the goal of transforming the UK into a “clean energy superpower” [9].
Significant energy transformation has been underway globally, with varying degrees of progress across different regions [10]. In 2023, the new installed capacity of renewable energy was 510 GW [3], with nearly 50% more compared to 2022. It has kept rising at high rate. Over the past two decades, the decline in the costs of photovoltaic (PV) and wind power has spurred rapid growth in non-hydropower renewable energy sources. In 2023, the global solar power generation reached 1 641.6 TW•h, wind power generation totaled 2 325.3 TW•h, and geothermal, biomass, and other sources contributed 781.5 TW•h. Non-hydropower renewable energy generation in total reached 4 748.4 TW•h [3], marking a 12.9% year-on-year increase and a compound annual growth rate of 14.4% over the past decade. The global clean energy target of tripling installed capacity of renewable energy to 11 000 GW by 2030 is on track to be achieved.
The new energy industry of China has established a pioneering win-win model for global green and low-carbon transformation [11]. Currently, China is collaborating on green energy projects with more than 100 countries and regions [11]. Over the past decade, the global average cost per kW•h for wind and PV power generation dropped by over 60% and 80%, respectively [7], with a significant portion of this reduction attributable to China’s efforts. The new energy industry of China has driven global technological advancements, enhanced the efficiency of resource allocation, created new economic opportunities for the future, and played a key role in advancing the global energy transition and fostering economic growth [12].
1.2. “Two revolutions” in the global energy industry are rapidly accelerating
In the context of climate change and the “carbon peak and carbon neutrality” goals, the transition from carbon-based fossil fuels to zero-carbon new energy is both inevitable and essential. The breakthrough on energy technology revolution is driving two revolutions, the black “shale oil and gas revolution” in the United States and the green “new energy revolution” of wind-solar- hydrogen-energy storage in China. These “two revolutions” are accelerating the global energy transition.
1.2.1. Black shale oil and gas revolution in the United States
The black shale oil and gas revolution in the United States [1] is an extraordinary, low-probability event. In 2019, the U.S. energy consumption totaled 22.2×10⁸ toe, while production reached 22.6×10⁸ toe, marking the first time since 1957 that the U.S. energy production surpassed consumption (Fig. 3 ). This achievement has been a cornerstone in the push for “energy independence” in the U.S. and has catalyzed the rapid development of uncon-ventional oil and gas resources worldwide. By 2023, the U.S. oil and gas production reached 16.9×10⁸ toe [3], which includes 6.6×10⁸ t of crude oil and 12 922×108 m3 of natural gas [3]. Specifically, conventional crude oil production was 2.3×10⁸ t, while unconventional crude oil output was 4.3×10⁸ t; the natural gas production included conventional output of 4 609×108 m3 and 8 313×108 m3 from unconventional sources [3].
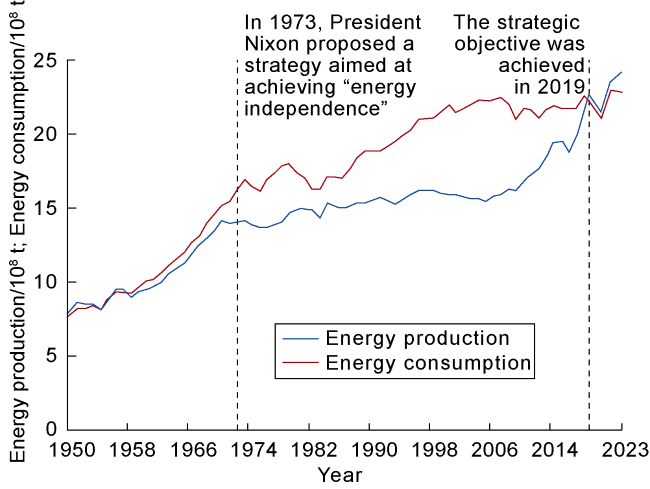
Fig. 3. Energy production and consumption in the United States, 1950-2023 [3]. |
1.2.2. Green new energy revolution in China
The green new energy revolution, encompassing wind, solar, hydrogen and energy storage in China [1], represents a significant yet often underappreciated event with a high probability. By the end of 2023, the cumulative installed capacities for hydropower, wind power and solar power reached 3.70×10⁸, 4.41×10⁸ and 6.09×10⁸ kW, respectively [13]. Together, these accounted for 50.4% of the country’s total installed capacity (Fig. 4 ), surpassing the 47.6% share of thermal power for the first time, which signals China’s entry into the new energy era. The total installed capacity of nuclear power plants under construction and in operation in China were 10 033×104 kW and 5 691×104 kW, which represented less than 2% of the country’s total installed power capacity but contributed nearly 5% to total electricity generation [7]. China’s “West- to-East Power Transmission” project has a transmission capacity of approximately 3×10⁸ kW, with 20 ultra-high- voltage DC transmission lines already in operation. In the global context, China leads the development of wind power and photovoltaics. By the end of 2023, the total installed capacities of China for wind and solar power reached 10.50×10⁸ kW, accounting for 43.2% of the global installed capacity in these sectors (which totaled 2 436 GW) [3]. The technical prowess, advantage of scale, and cost competitiveness of the wind, solar, and energy storage technologies of China are continuously improving. For instance, the conversion efficiency of mass-produced advanced crystalline silicon photovoltaic cells have exceeded 25%. Onshore wind turbines now have a maximum unit capacity exceeding 10 MW, and offshore wind turbines of up to 18 MW have been successfully produced. By the end of 2023, the installed capacity of China for pumped storage reached 5 094×104 kW, while new energy storage capacities totaled 3 139×104 kW/6 687×104 kW•h, with an average energy storage duration of 2.1 h [7]. The combination of low-cost wind, solar, and energy storage technologies will play a pivotal role in supporting the global transition to renewable energy.
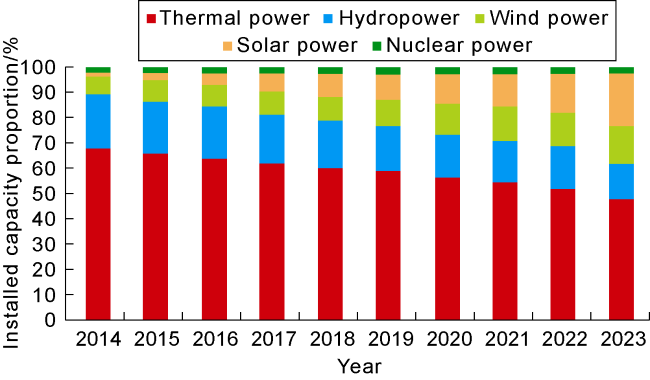
Fig. 4. China’s installed power capacity structure, 2014- 2023 [3]. |
Global wind power is growing rapidly, with China maintaining a leading position in the sector. By 2023, the global cumulative installed capacity for wind power reached 1 017 GW, with China accounting for 442 GW or 43.4% (Fig. 5 ) [3]. In 2023, China added 75.931 GW of wind power, reflecting an annual growth rate of 20.7%, and an average annual growth rate of 19.1% from 2013 to 2023 [3]. Looking ahead, the Chinese government plans that by 2030, the total installed capacity of wind and solar power generation in desert, gobi, and desert regions will reach approximately 455 GW. During the China National 14th Five-Year Plan Period, the country aims to exceed 100 GW of installed offshore wind power capacity [7].
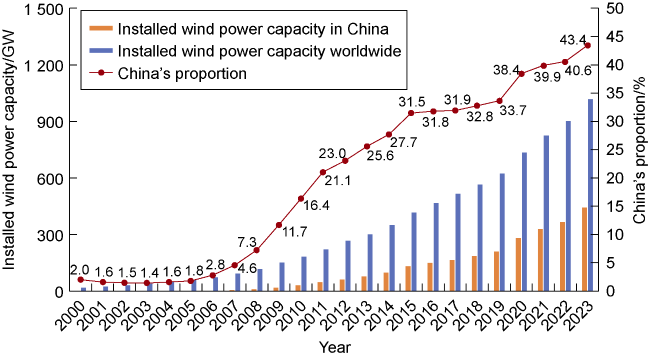
Fig. 5. Comparison of installed wind power capacity in China and worldwide, 2000-2023. |
China is at the forefront of the solar energy industry, driving a rapid growth in the global PV capacity. By 2023, the global cumulative installed capacity of solar power reached 1 419 GW, with China contributing 610 GW or 43.0% (Fig. 6 ) and surpassing the sum of Europe and the Americas, which was 509 GW [3]. In 2023, China added 216.889 GW of solar power capacity, reflecting an impressive annual growth rate of 55.2%, and an average annual growth rate of 42.4% from 2013 to 2023.
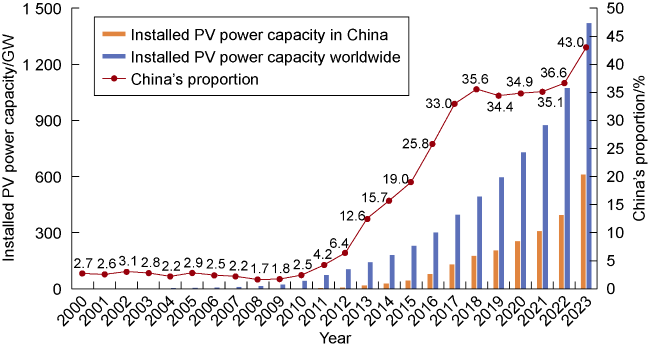
Fig. 6. Comparison of installed solar power capacity in China and worldwide, 2000-2023. |
In the context of growing global consensus on carbon neutrality and escalating regional conflicts, countries have increasingly prioritized energy transition and energy security. This has led to accelerated promotion in new energy technologies, significantly lowering costs and creating competitive advantages. As a result, the new energy technology revolution is progressing faster than expected. The scientific and technological transformation is driving the new energy industry, which is characterized by high technology, efficiency and quality. Building a new energy system characterized by “four news” (new energy, new energy storage, new smart technology and new policies) is a crucial pathway for achieving high-quality energy development. The share of new energy, driven by the complementary integration of wind, solar, gas, heat, hydrogen, storage and intelligence, continues to grow. This integration fosters the high-quality development of energy in a green, economic, technological and intelligent direction. It has made significant contributions to the global response to climate change, the achievement of “carbon neutrality” goal, the green transformation of energy, and the enhancement of energy security.
1.3. Contribution acceleration of China to the carbon reduction in the context of climate change
The climate crisis is undeniably one of the most urgent challenges facing humanity. According to the State of the Global Climate 2023 report from the World Meteorological Organization (WMO), 2023 was the warmest year on record, with the average global near-surface temperature being (1.45±0.12) °C higher than the pre-industrial (1850- 1900) baseline [14]. This temperature is now dangerously close to the 1.5 °C lower limit set by the Paris Agreement on Climate Change [15-16]. It surpasses the previous record for the warmest year, which was (1.29±0.12) °C above the pre-industrial average in 2016 and (1.27±0.13) °C above in 2020. The global average temperature from 2014 to 2023 was (1.20±0.12) °C above the pre-industrial baseline, with the effects of climate change increasingly felt across all continents [17-18]. In response to this escalating crisis, China has proposed a global initiative to deepen practical cooperation in energy transition, ensure the stability and smooth functioning of the global energy industrial and supply chains, improve the global energy access, and address the challenges of climate change adaptation [6]. However, the global climate change encompasses much more than just rising temperatures [19-20]. In recent years, the combined influence of global warming and phenomena such as El Niño and La Niña has led to a significant increase in extreme weather events, with meteorological disasters becoming more frequent and severe.
Despite the widespread adoption of renewable energy technologies, which are now well-established, mature, and competitively priced compared to fossil fuels, the global CO2 emissions continue to rise, with the exception of a temporary decline during the COVID-19 pandemic in 2020. In 2023, the global carbon dioxide equivalent emissions from fossil fuel combustion, industrial processes, methane emissions, and exhaust gases reached 404×108 t, surpassing 400×108 t for the first time [3]. This marks a new record high for CO2 emissions. While emissions in the developed economies of Europe and the United States have begun to decline, emissions in Asia continue to increase.
Achieving “carbon peak and carbon neutrality” represents a profound and transformative societal shift [21], reflecting the development of new-quality productive forces. To attain carbon neutrality, a fundamental transformation in energy systems is essential. These goals are primarily centered on energy, which is at the heart of the issue and represents a complex, systemic challenge. Fossil fuel combustion remains by far the largest source of greenhouse gas emissions, with carbon dioxide equivalent emissions reaching 351.298×10⁸ t in 2023, accounting for 87.7% of the global emissions [3]. In particular, carbon dioxide emissions from fossil fuel combustion in China and the United States were 112.184×10⁸ t and 46.397×10⁸ t, respectively, making up approximately 89.0% and 90.4% of each country’s total emissions [3].
China has made significant contributions to carbon reduction through the development of new energy sources. The continued expansion of China’s new energy sector plays a crucial role in stabilizing the industrial and supply chains for the green transformation of industries worldwide [22]. Actively promoting zero-carbon energy is a key strategy for addressing climate change and achieving carbon neutrality [17]. In 2021, China committed to halting the construction of new coal power projects abroad. In 2022, new energy generation helped reduce carbon emissions by approximately 22.6×10⁸ t, while its exports of wind and PV products contributed to a reduction of around 5.7×10⁸ t in carbon emissions for other countries, accounting for about 41% of the global carbon reduction from renewable energy during that period [11]. In 2023, China accounted for more than half of the global renewable energy installed capacity, which reached 5.1×10⁸ kW.
2. Achievements and significance of the “green energy transition” revolution in China
2.1. Achievements of the energy revolution of China
The black “shale oil and gas revolution” in United States has significantly boosted its influence in the global energy system, making it the world’s leading oil and gas producer as well as a major exporter. The primary driver of the current energy transition is climate change—or “climate politics”—along with the growing role of renewable energy in the global energy mix. The recognized “zero-carbon” renewables include wind, solar, hydropower and nuclear power. In the fields of PV material manufacturing and wind power production, China has taken a leading position, gaining a competitive edge in the development of new energy technologies.
Fossil energy has played a key role in China’s transformation from a “small energy country” to a “large energy country”. By 2023, the energy production in China had increased by hundreds to thousands of times compared to 1949. In 1949, its total energy output was 0.2×10⁸ t of standard coal, which included 0.3×10⁸ t of raw coal, 12×104 t of crude oil, 0.1×10⁸ m3 of natural gas, and 43×108 kW•h of electricity. By 2023, the total energy production had reached 48.3×10⁸ t of standard coal, a 241-fold increase. This includes 47.1×10⁸ t of raw coal (a 156-fold increase), 2.09×10⁸ t of crude oil (a 1 741-fold increase), 2 324×108 m3 of natural gas (a 23 242-fold increase), and 9.46×10¹² kW•h of electricity (a 2 198-fold increase).
The transition from fossil energy to an integrated system of “fossil energy + new energy”, and now to a combination of wind + solar + hydrogen + energy storage + smart technologies, marks a significant shift. Non-renewable, limited “carbon-based” energy sources are steadily declining, while renewable, virtually unlimited “zero-carbon” energy is becoming increasingly prevalent. In 2023, China’s new energy output reached 7.52×10⁸ toe, accounting for 22.2% of the total energy output (33.86×10⁸ toe). This reflects the continued growth and development of China’s emerging new energy industries [23].
The future energy demand of China is expected to continue rising. In 2023, the country’s per capita primary energy consumption was 2.86 toe [3], ranking the 37th among 93 countries and regions worldwide. This is significantly lower than that of developed nations, approximately 2/5 of the per capita energy consumption in United States. Over the next few years, the total energy consumption in China is projected to grow at an annual rate of about 2%, equating to roughly 1.2×10⁸ t of standard coal. If half of this demand is met by wind and PV power, China will need to install approximately 1.5×10⁸ kW of wind and solar capacity additionally each year. From the perspective of promoting a green and low-carbon transformation, energy consumption in the secondary industry accounts of China for around 70% of the total energy consumption of the country, while carbon dioxide emissions from this sector make up about 80% of the total emissions of the country. As a result, transforming the traditional energy mix is a complex and challenging task [24].
The achievements of China’s new energy revolution have been hard-earned, and it is essential to continuously strengthen and expand its leadership in the global new energy development. This will require vigorous efforts to advance new energy technologies and meet the demands of new-quality productive forces. On May 23, 2024, the State Council issued the 2024-2025 Energy Conservation and Carbon Reduction Action Plan [25], which outlines measures to control coal consumption in a strict yet reasonable manner, regulate oil consumption sensibly, and guide natural gas consumption in an orderly fashion. The plan also sets a target for non-fossil energy consumption to reach about 20% of the total energy consumption by 2025. The plan calls for substantial efforts in the development of non-fossil energy sources [25]. For example, the construction of large-scale wind and photovoltaic power bases, particularly in deserts and Gobi regions, will be accelerated. Develop the offshore wind power in a rational and orderly way to expand the large-scale development and utilization of ocean energy, and the development and utilization of distributed new energy sources will be promoted. Additionally, build large hydropower bases orderly and develop nuclear power safely and actively, biomass energy will be promoted according to local conditions, and the development of hydrogen energy will be advanced in a coordinated manner. By the end of 2025, the share of non-fossil energy in the total power generation is expected to reach approximately 39%.
Currently, more than half of the world’s green and low-carbon technologies remain underdeveloped, highlighting a significant gap between the enormous demand for low-carbon solutions and the shortage of affordable green technologies. The new energy sector of China has experienced continuous technological advancements, a profound shift in its factor endowment structure, and a successful integration of digitalization with green transformation. These efforts have led to substantial reductions in the cost of new energy products through extensive application, paving the way for the high-quality development of the new energy industry [11]. Wind and PV power continue to be the backbone of the new energy development of China. While expanding the scales of wind and PV installations, major economies are prioritizing technological research to reduce costs and improve efficiency.
2.2. Progress in the new energy revolution of China
New energy refers to zero-carbon, renewable energy sources developed and harnessed through advanced technologies. Key types of new energy include wind, solar, hydro, hydrogen, thermal, nuclear, ocean energy and controlled nuclear fusion, among others. Unlike traditional energy sources, new energy is characterized by its lack of carbon emissions, renewable nature, and reliance on cutting-edge technology.
China has made historic achievements in the development of its new energy industry, securing competitive advantages through open competition and mutually beneficial cooperation. These achievements reflect the advanced production capacity and commitment of the country to green development, which enrich the global supply and play a pivotal role in addressing climate change, driving the green transformation and global economic growth. China now accounts for 60% of the world’s wind power equipment and more than 70% of PV modules [26], marking a significant global contribution and positioning the country as a leader in the global new energy revolution.
China is abundant in wind and solar energy resources. Through years of research, consistent effort, and scientific guidance grounded in the principles of green development, China has built an industrial and supply chain system. With continuous technological innovation, product optimization and industrial upgrading, the new energy sector of the country has experienced a rapid growth, positioning it at the forefront of the global manufacturing in new energy technologies and equipment. As a result, China has established the world’s largest clean power supply system. Over the past decade, the share of clean energy consumption in China has increased by 10.9 percentage points, the share of coal consumption has dropped by 12.1 percentage points, the share of clean energy generation has risen by approximately 15 percentage points, and the energy consumption per unit of gross domestic product (GDP) has decreased by over 26%[9]. In terms of foreign trade, the “new three” of China — new energy vehicles, lithium batteries, and PV products — have gained strong competitiveness in the global market. In 2023, exports of these products grew by nearly 30%, surpassing the one-trillion-yuan mark [11], providing the international community with high-quality, efficient new energy equipment and products [27]. Looking ahead, China is set to further develop its “three major items” — green electricity, green hydrogen and green storage industries. The emergence of “green hydrogen production” will play a key role in the energy transition of the country, positioning green hydrogen as an essential and inevitable choice for the ongoing development of the oil and natural gas industries.
China has ranked the first in the world for new energy installed capacity for many consecutive years, accounting for approximately 40% of the global total. By the end of June 2024, the country’s cumulative installed power generation capacity had reached about 30.7×10⁸ kW, reflecting a year-on-year growth of 14.1% [28]. This includes capacities from solar power at 71 350×104 kW, wind power at 46 671×104 kW, hydropower at 42 715×104, and nuclear power at 5 808×104 kW. The total installed capacity for new energy power generation reached 16.65×10⁸ kW, which now constitutes 54.2% of the country’s total installed power generation capacity, surpassing both the 50% threshold and the installed capacity of thermal power.
New energy has become the dominant source of the newly installed power capacity of China. Since 2012, the wind power capacity of the country has increased sixfold, with an average annual growth rate of around 20%, while PV capacity has surged by 184 times, growing at an average annual rate of about 60% [24]. Since 2016, new energy has accounted for more than 50% of the total new power capacity, and by 2023, it made up 85% of the total, establishing itself as the primary source of new power capacity. In 2023, the annual power generation from new energy reached approximately 2.68×10¹² kW•h, representing 30% of the total electricity generation of China. Of this, wind and PV power generation contributed 1.43×10¹² kW•h, or about 15.8% of the country’s total electricity consumption, surpassing the global average (13.0%).
China is a global leader in new energy technology. The rapid advancement of its PV power generation technology has consistently set new world records for battery conversion efficiency. China is also at the forefront of developing large-capacity wind turbines, with innovations in long blades, high towers, and significant breakthroughs in high-power turbines, ultra-low wind speed turbines, and offshore wind energy technologies. In equipment manufacturing, China has established the world’s largest, most comprehensive, and competitive new energy industrial and supply chains, nurturing numerous world-class energy equipment manufacturers. Over the past decade, the development costs of wind and PV power have decreased by 60% and 80%, respectively, with the average cost per kW•h in 2023 dropping to 0.26 yuan and 0.31 yuan. The new energy industry has built a sophisticated, integrated industrial system with international competitive advantages, positioning China as the global hub for the new energy sector.
2.3. Significance of the green energy transition of China
The rapid progress of the new energy revolution has accelerated the global transition to clean energy and made significant contributions to addressing climate change. China has scaled up domestic new energy development and driven down the global cost of green technologies through the large-scale deployment of clean energy, making these solutions more affordable and accessible worldwide.
2.3.1. Accelerating the shift towards a green energy mix in China
Fossil fuels remain the dominant source in China’s energy supply structure, and they serve as a “ballast stone” that stabilizes the system. Coal plays a crucial role as a reliable backstop, capable of rapidly releasing up to 3×10⁸ t/a of reserve capacity in extreme situations, effectively safeguarding the energy consumption needs of China. In 2023, the domestic oil and gas production of China surpassed 4.1×10⁸ toe, maintaining a robust trend of growth by 10 million tons for seven consecutive years. The average annual growth rate reached 1 170×104 toe [3], marking a new peak in production growth.
China has made significant strides in greening and achieving low-carbon for its primary energy production and consumption structures [29]. Since 2000, the share of coal in these structures has steadily declined, while the proportion of clean energy sources, including natural gas and new energy, has rapidly increased [30]. From 2000 to 2023, the share of coal in energy production fell from 72.9% to 65.7%, while the share of new energy production rose from 7.7% to 22.1% (Fig. 7 ). Similarly, the share of coal consumption dropped from 68.5% to 53.9%, and the share of new energy consumption increased from 7.3% to 18.4% (Fig. 8 ).
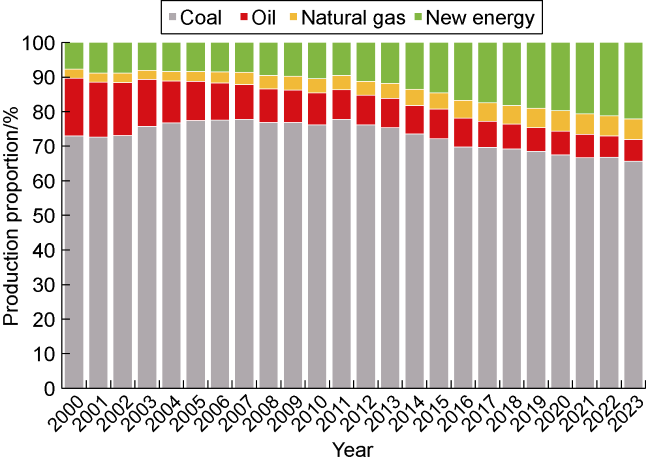
Fig. 7. Changes in the primary energy production structure of China, 2000-2023. |
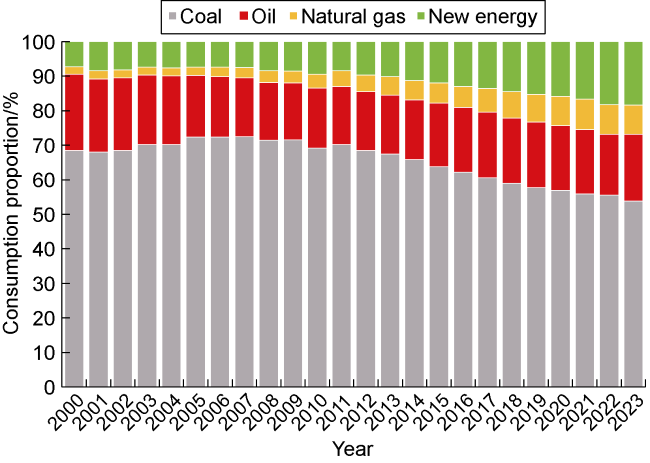
Fig. 8. Changes in the primary energy consumption structure of China, 2000-2023. |
The energy mix of China is currently undergoing a transition marked by the overlap of “three phases”: the “past” of the coal era, which has not yet fully ended, with coal still accounting for 53.85% of the energy consumption in 2023; the “present” of the fossil fuel era, where coal, oil, and natural gas together make up 81.56% of the energy consumption; and the “future” of the new energy era, which has already begun, with the new energy consumption reaching 18.44%. This period of energy transition presents both challenges and opportunities, with new energy playing a central role in the strategy of China for energy transition and its dual-carbon goals [31].
The energy mix of China is diverse. According to the major energy consumption distribution in 2023 (Fig. 9 ) [30], crude oil consumption was primarily driven by industry and transport, and natural gas consumption was largely dominated by industrial use and urban gas supply. Coal consumption, on the other hand, was more concentrated in industry. Electricity consumption was more varied, with the largest share going to industry, followed by residential use.
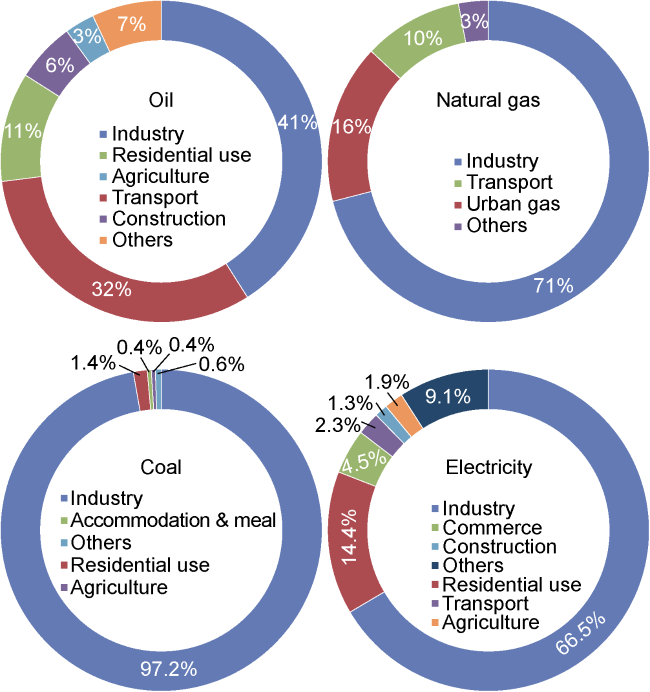
Fig. 9. The major energy consumption structure of China in 2023. |
China has actively transformed its energy consumption pattern and significantly improved energy efficiency. With an average annual energy consumption growth rate of approximately 3.3%, China has supported a national economic growth rate exceeding 6% annually. China’s contribution to the global growth of non-fossil energy consumption accounts for over 40%. The reduction in energy consumption per unit of GDP is more than twice the global average for the same period. Additionally, more than half of the new installed capacity of the world for new energy generation in 2023 was in China [27].
The new energy technologies of China have made significant strides and rapid development, and accelerating the adjustment of the country’s energy mix. The installed capacity for new energy generation has surpassed 50%, while the share of coal consumption has declined by more than one percentage point annually. Additionally, the cumulative reduction in energy consumption per unit of GDP has reached approximately 27%, more than twice the global average for the same period [24]. China has consistently advanced the transformation and upgrading of its traditional energy sector, while actively fostering the growth of the new energy industry, leading to the establishment of a world-leading clean energy industrial system. PV and wind power have become industries in which China holds strong international competitive advantages.
With the continuous advancement of the new energy technologies and the large-scale development of the new energy industry in China, the share of non-fossil energy consumption is expected to rise rapidly in the future. The energy consumption structure of the country will shift in pattern from “one large, three small” (large share of coal consumption, small shares of oil consumption, natural gas consumption and new energy consumption) currently to “three small, one large” (small shares of coal consumption, oil consumption and natural gas consumption, large share of new energy consumption) in the future. It is forecasted that coal, oil and natural gas will account for just 5.0%, 5.6%, and 9.4% of the country’s total energy consumption, respectively, while new energy will reach around 80%, by year 2060 [2,32 -33].
2.3.2. More effectively ensuring the energy independence of China in the future
The “energy rice bowl” must be firmly in our own hands, and the core logic behind China’s development of the new energy industry is to meet the growing energy demands of its people. Currently, the international landscape is both challenging and complex, and the competition around climate change is intensifying [34]. At the heart of this competition lies in the struggle to balance the right to development with the right to emit [35]. For China, the world’s second-largest economy, energy security is of paramount importance [36], and it must take greater responsibility in safeguarding its “energy rice bowl”. In 2023, China accounted for 28% of the global energy consumption and 23% of the global energy production, while its per capita energy consumption remained only about two-thirds of the Organization for Economic Co-operation and Development (OECD) average [27]. The international energy market, especially for bulk commodities like oil and natural gas, is marked by geopolitical, financial, and resource-related complexities due to factors such as uneven geographical distribution, resource scarcity and supply-demand instability. China, with its relatively limited domestic oil and gas resources, is considered as a resource-poor country in this regard. As new-quality productive forces in the energy sector continues to develop rapidly, China’s energy consumption is expected to remain a rigid growth in the coming years, placing a significant responsibility on the country to ensure its energy security effectively.
China possesses inherent advantages in new energy resources and is committed to an energy strategy centered on technology, clean coal and carbon reduction, increasing gas output while stabilizing oil production, enhancing green and new energy and intelligent mutual integration. This approach emphasizes the integration of underground fossil energy and aboveground new energy, which is essential for ensuring national energy security. Coal serves as the “ballast stone” of the energy industry, while oil remains a strategic energy source essential for maintaining energy security. Natural gas is both the “connector” between traditional fossil fuels and new energy, and also a “stabilizer” ensuring the security of the integrated energy system. It functions as a key “regulator” within the new energy system. Natural gas is the most critical and practical transitional energy source for achieving the shift to low-carbon and zero-carbon energy [37]. Meanwhile, wind and solar green electricity, green hydrogen, and controlled nuclear fusion are emerging as the primary alternatives for replacing conventional energy sources. Vigorously developing new energy is both a strategic imperative and a fundamental solution to addressing the complex challenges in the future energy landscape.
The current energy insecurity in China is primarily driven by its heavy reliance on foreign oil and gas. In 2023, China’s dependence on imported oil and gas was 73.0% and 42.3%, respectively. Looking ahead, the future energy insecurity will be increasingly influenced by China’s dependence on imports of key minerals essential for new energy development. China faces significant shortages in lithium and cobalt resources [38], with over 90% of these critical materials imported from abroad.
It is projected that by 2030 and 2060, the share of non-fossil energy in the total energy consumption of China will rise to 25% and 80%, respectively, while the proportion of electricity in final energy consumption will increase to 35% and 75%, respectively. This shift will lead to a more scientific and efficient energy allocation pattern, a profound transformation of the energy supply structure, and a more complex and diversified energy utilization model. Electricity will serve as the primary carrier of green and low-carbon energy transition, with the power grid playing a critical role as the platform that ensures energy security.
2.4. Prospects for green energy transition in China
The energy development in China faces a series of challenges, including immense demand pressures, supply constraints, and the complex task of achieving a green and low-carbon transition. The key to addressing these challenges lies in the vigorous development of new energy. This requires a sustained push to promote the high-quality development of new energy, accelerate technological advancements, and foster industrial growth within the new energy sector. By doing so, China can provide a secure and reliable energy foundation for its modernization drive, while also making significant contributions to the creation of a clean and sustainable global future.
2.4.1. Energy and resource potential of China
As of the end of 2020, the proven recoverable reserves of coal, oil, and natural gas in China were 1 431.97×10⁸ t, 35.42×10⁸ t and 8.40×10¹² m3, respectively, with the reserve-to-production ratios of 36.7, 18.2 and 43.3, respectively. By the end of 2023, the remaining recoverable reserves were 1 298.03×10⁸ t, 29.29×10⁸ t, and 7.73×10¹² m3, respectively [3]. Globally, the proven recoverable reserves of coal, oil and natural gas by the end of 2020 were 10 741.08×10⁸ t, 2 444.21×10⁸ t and 188.07×10¹² m3, with the reserve-to-production ratios of 138.6, 53.5 and 48.8, respectively. By the end of 2023, the global remaining recoverable reserves were 10 480.22×10⁸ t, 2 312.45×10⁸ t and 175.92×10¹² m3, respectively [3].
In 2023, the oil production in China reached 2.09×10⁸ t, natural gas production totaled 2.01×10⁸ toe, and coal production amounted to 22.24×10⁸ toe. China ranks as the world’s sixth-largest oil producer, the fourth-largest natural gas producer, and the largest coal producer. China’s wind power potential exceeds 100×108 kW, while its PV power potential surpasses 450×108 kW [24]. In pursuit of carbon neutrality by 2060, China’s wind and PV installed capacity is projected to exceed 50×108 kW, five times the current total installed capacity.
The energy resources in the world are characterized by abundant coal, rich oil and gas reserves, and vast potential for new energy sources. China is the world’s largest producer, consumer, and importer of energy, making it essential to re-evaluate and better understand its energy resource endowment [39]. In this context, the energy profile of China can be described as having “more coal, less oil and gas, and unlimited wind and solar”. In terms of global recoverable coal reserves and reserve-to-production ratios, China does not rank highly. It is primarily a coal production and consumption country, and while its coal reserves may not be abundant compared to the global figures, it still relies heavily on coal, thus having “more coal” relative to its needs. China is also a major global producer and consumer of oil and gas, but its oil and gas resources are not abundant in relation to its consumption, making it a country with “less oil and gas”. However, China possesses vast renewable energy potential, particularly in wind and solar resources. With less than 30% of these resources currently tapped, China has significant untapped potential that can support its energy independence, thus offering “unlimited wind and solar”.
The overall graphite production of China remains stable. By the end of 2023, the global graphite reserves totaled 36 439.5×10⁴ t, with a reserve-to-production ratio of 218. In comparison, the reserves of China were up to 7 800×104 t, with a reserve-to-production ratio of 63 [3], accounting for 21.4% of the global total reserves. In 2023, the global graphite production reached 166.83×10⁴ t, with China contributing 123.0×10⁴ t or 73.7% [3].
China is the leading producer of rare earth elements of the world. By the end of 2023, the global rare earth reserves totaled 11 560.2×10⁴ t, with a reserve-to-production ratio of 327. In comparison, China’s reserves amounted to 4 400×104 t, with a reserve-to-production ratio of 183 [3], accounting for 38.1% of the global total reserves. In 2023, the global rare earth production reached 35.37×10⁴ t, with China producing 24.00×10⁴ t or 67.9% [3].
China has limited cobalt resources and relies heavily on imports, with a dependence exceeding 95%. By the end of 2023, the global cobalt reserves totaled 1 064.16× 10⁴ t, with a reserve-to-production ratio of 54. In comparison, the reserves of China were only 14.0×10⁴ t, with a reserve-to-production ratio of 80 [3], accounting for just 1.3% of the global total reserves. In 2023, the global cobalt production reached 19.69×10⁴ t, with China contributing only 0.18×10⁴ t or 0.9% [3].
China faces a significant shortage of lithium resources, with its reliance on imports exceeding 95%. By the end of 2023, the global lithium reserves reached 2 602.8×10⁴ t, with a reserve-to-production ratio of 131. In comparison, the reserves of China were only 300×104 t, with a reserve-to- production ratio of 91 [3], accounting for 11.5% of the global total reserves. In 2023, the global lithium production was 19.8×10⁴ t, with China contributing 3.3×10⁴ t or 16.7% [3].
2.4.2. The energy development trajectory of China
China is the second-largest economy of the world, and its external environment is both severe and complex, making energy security a matter of paramount importance. The fossil resource endowment of China is characterized by abundant coal reserves but limited oil and natural gas resources. As a result, China is heavily reliant on imported fossil energy, particularly oil and gas, which poses significant risks to its energy security. To address these challenges, China is actively pursuing the development of new energy sources. Unlike oil and gas, which can be embargoed or subject to sanctions, energy resources such as solar and wind power are not vulnerable to such disruptions. No one can block the sun or control the wind. China has a robust manufacturing sector, a rapidly advancing digital economy, and world-renowned infrastructure capabilities. It is the only country in the world with all industrial categories listed in the United Nations’ industrial classification, and has developed over 200 mature industrial clusters. For 14 consecutive years, China has ranked the first globally in manufacturing output [11]. The core of new energy development lies in the integration of manufacturing, digital technology and infrastructure. With abundant new energy resources, China has a strong foundation to secure its energy future. This offers a realistic pathway for China to enhance its energy security, become a global energy leader and achieve energy independence [12,42].
Under the goal of carbon neutrality, the energy development of China must handle ten key relations: the relationship between the global energy transition and the carbon neutrality of China; the relationship between the energy transition and energy security of China; the balance between fossil energy and new energy development; the relationship between the oil and gas imports and its energy security of China; the challenge of large-scale new energy production and cost-effective utilization; the interplay between the energy independence and disruptive technologies of China; the connection between building an energy power and achieving energy independence; the relationship between the carbon neutrality and the construction of beautiful China; the relationship between the new energy revolution and the world carbon neutrality contribution of China; and the relationship between the carbon neutrality and the development of a green earth of China.
The energy development path of China should prioritize the integrated development of fossil energy, new energy, and CCUS/CCS technologies. This approach emphasizes a green transformation by integrating “oil and gas + new energy + CCUS/CCS”, “oil and gas + coal + CCUS/CCS”, and “oil and gas + coal + new energy + CCUS/CCS”.
Under the dual-carbon goals, building a “super energy system” that integrates diverse energy production and consumption with carbon neutrality is a strategic cornerstone. This system will bring together underground carbon-based traditional energy, aboveground zero-carbon new energy, CCUS/CCS technologies and carbon sinks, promoting collaborative integration and intelligent management. Through innovative configuration, this carbon-neutral “super energy system” [43] will drive the development of new-quality productive forces, establish a new energy system, and lead the way in achieving the dual-carbon goals. Ultimately, it will provide a green power for sustainable human development.
3. Concept of the “energy triangle” theory in the context of new-quality productive forces
3.1. Concept of the “energy triangle” theory
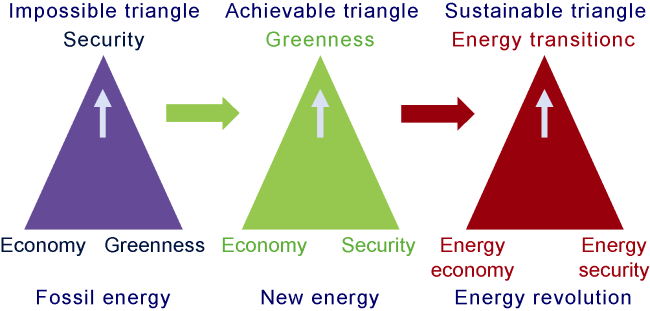
The “impossible triangle” theory was initially proposed to highlight the challenges in simultaneously achieving economic, social, and fiscal policy objectives, suggesting that it is difficult to attain all three goals at once. This paper applies the theory to the energy sector, introducing the concept of the “energy triangle” theory in the context of new-quality productive forces. It explores the implications and development of the “energy triangle” during the transition from carbon-based fossil fuels to zero-carbon new energy, from three perspectives of energy security, economic considerations and environmental sustainability.
Under the backdrop of a carbon-neutral goal-driven energy transition, the “Energy Triangle” theory within the framework of new quality productive forces explains the correlation and development of energy security, economic growth, and environmental sustainability throughout the evolution from fossil fuels to new energy systems, culminating in an energy revolution. The development of energy systems has transitioned from the “impossible triangle” of fossil fuels to the “achievable triangle” of new energy systems, and ultimately to the “sustainable triangle” of a green energy transition revolution (Fig. 10 ). These three stages—“impossible”, “achievable”, and “sustainable”—mark the progression of the theoretical connotation of the “energy triangle” in the context of new-quality productive forces.
Fig. 10. Evolution of the “energy triangle”. |
The “impossible triangle” of fossil energy suggests that achieving a balance between the greenness, economy, and security of energy is challenging [44]. New energy, characterized by zero-carbon clean sources, inherently supports greenness. Currently, new energies such as wind and solar have been scaled up and are supplied at low costs, making them economically viable. Additionally, the new energy system, structured around “multi-energy complementarity, source-grid-load-storage”, enables a safe, stable, and long-term energy supply. This system integrates greenness, economy and security, overcoming the limitations of fossil fuels and evolving into the “achievable triangle” of new energy and new-quality productive forces [1]. To meet climate governance and carbon neutrality targets, energy transition is imperative, propelled by the “four- wheel drive” model with energy economy and energy security as the front wheels, while technological innovation and dual-carbon goals as the rear wheels, accelerating the energy transition to carbon-neutral. The energy revolution, powered by technological advancements, will underpin national energy independence in the future. Energy transition, energy security and energy economy form the “sustainable triangle” within the energy revolution, mutually reinforcing each other to ensure the stable, economically secure supply of energy.
The global green energy transition has evolved from the “impossible triangle” of fossil energy to the “achievable triangle” of a new energy system, and further to the “sustainable triangle” within the energy revolution aimed at achieving energy independence. The energy development of China faces “three pressures” for being the largest energy consumer, largest energy importer and largest carbon emitter of the world. To address these challenges, it is essential to effectively integrate fossil energy with new energy, CCUS/CCS technologies and data intelligence, referred to as the “three integrations”. The green energy transition of China must adhere to the “three principles” (multi-energy integration, safety & orderly, and economic & efficient). The concepts of the “three triangles”, “three pressures”, “three integrations” and “three principles” have enriched and expanded the theoretical connotation of the “energy triangle” in the context of new-quality productive forces.
3.2. Innovations in green energy technology
The new energy system is a “green + smart energy system” that provides sustainable energy for humanity’s green lifestyle and the construction of a greener planet. The development of this system gives top priority to “five new”: new green electricity and green hydrogen; new coal, oil and gas technologies; new material energy storage; new intelligent regulation and control systems; and new policy support. Scientific and technological innovation drives human progress, but this progress does not always begin with green innovation. New-quality productive forces represent green productive forces. The development of the “energy triangle” theory within this framework is focused on advancing low-carbon and zero-carbon energy development, which embodies the essence of “green technology innovation” in the energy sector. Scientific and technological innovation encompasses both the discovery of new natural science knowledge and advancements in technical processes. Green innovation, on the other hand, is an innovation model focused on achieving carbon neutrality and environmental sustainability. Green science and technology innovation involves using new discoveries in natural science and technology to lead and accelerate the realization of carbon neutrality and sustainable development. Green energy science and technology innovation applies these advancements to transform fossil energy systems toward a low-carbon economy, enable large-scale and efficient use of new energy sources, and provide sustainable power for the achievement of carbon neutrality, the greening of the Earth, and the sustainable development of humanity.
The innovation chain integrating scientific discovery, technological invention and enterprise development transforms the energy triangle from “impossible” to “achievable” and ultimately to “sustainable”. Thus the “energy triangle” theory within the framework of new- quality productive forces is formed, ensuring the enduring vitality and sustainability of the industrial base.
4. Conclusions
The global energy landscape is being shaped by two transformative revolutions: the black “shale oil and gas revolution” in the United States and the green “new energy revolution” in China. The shale oil and gas revolution in the U.S. has played a pivotal role in enabling the country to achieve “energy independence” in 2019. Meanwhile, the green energy revolution of China—focused on wind, solar, hydrogen and energy storage—has driven the rapid growth of the global wind power and PV industries. These advancements have made significant contributions to the global response to climate change, the green transformation of energy systems and the enhancement of energy security.
China has achieved historic milestones in the development of its new energy industry. The country leads the world in multiple new energy technologies and equipment manufacturing. PV power generation has consistently broken global records for conversion efficiency, while wind power technology continues to make significant breakthroughs. China now accounts for 60% of the world’s wind power equipment and more than 70% of PV modules. For several years running, China has ranked the first in the world for new energy installed power capacity, which makes up approximately 40% of the global total. New energy has become the dominant source of newly installed power capacity in the country. By the end of 2023, the combined installed capacity of hydropower, wind power, and PV power reached 50.4%, surpassing the installed capacity of thermal power for the first time. This achievement has helped build the world’s largest clean power supply system, leading China into the new energy era.
The “energy triangle” theory explains the interconnections and evolution between energy security, economy, greenness and carbon neutrality. It traces the development of energy systems from the “impossible triangle” of fossil fuels, to the “achievable triangle” of new energy systems, and ultimately to the “sustainable triangle” driven by the green energy transition. The integration of scientific discovery, technological innovation and enterprise development creates an integrated innovation chain that propels the energy triangle from “impossible” to “achievable” and then to “sustainable”. This process lays the foundation for the theoretical connotation of the “energy triangle” within the context of new-quality productive forces.
The rapid advancement of the green and new energy revolution in China has significantly accelerated both the energy mix transformation and the global clean energy transition in China. Over the past decade, the share of non-fossil energy in the global energy consumption has increased from 13.6% to 18.5%, with China contributing 45.2% of this growth. This progress has established a new win-win model for the global green and low-carbon transition, driving efforts toward carbon neutrality and advancing global climate governance. China’s contributions have been instrumental in the global fight against climate change.
The energy resource endowment of China is characterized by abundant coal, limited oil and gas, and unlimited wind and solar. However, the country is highly dependent on foreign oil and gas, and its current energy supply faces security challenges. To address these issues, the development of new energy is essential for ensuring the energy security of China. Looking ahead, the energy development of China will focus on technology, clean coal and carbon reduction, increasing gas output while stabilizing oil production, increasing green energy while enhancing new energy, and achieve intelligent integration. The future energy system will prioritize the coordinated and integrated development of underground carbon-based traditional energy, aboveground zero-carbon new energy, carbon capture, utilization and storage (CCUS/CCS) and carbon sinks. This approach will help form a carbon- neutral “super energy system” with an innovative configuration. The goal is to build a new energy system that supports the transition of China to an “energy power”, striving for “energy independence” while injecting green momentum into the modernization process of China.