

Introduction
1. Connotation of the energy super basin
2. Reserves and development status of different types of resources in the Ordos Basin
2.1. Resources, development status and potential of fossil fuels

Fig. 1. Expected natural gas production in the Ordos Basin. |
2.2. Renewable energy potential and utilization status
2.3. Potential of strategic resources
3. Favorable conditions for constructing the Ordos Energy Super Basin
3.1. Abundant energy resources
3.2. Perfect infrastructures
3.2.1. Energy production facilities
3.2.2. Energy storage facilities
Table 1. Energy storage facilities in the Ordos Basin |
| Storage facilities | Number of existing facilities | Established storage capacity | Ongoing and planned projects |
|---|---|---|---|
| Gas storage | 2 | 14.5×10⁸ m3 | 2 gas storages under construction, with the expected working capacity of 43.8×10⁸ m3/a after completion |
| LNG peak- shaving station | 3 | 4.5×10⁴ m3 | |
| Energy storage power station | 3 | Maximum charging/ discharging power 0.12 GW, energy storage capacity 0.21 GW·h | 10 power storage projects under construction, with the total expected maximum charging/discharging power 1.34 GW and energy storage capacity 4.34 GW·h. 18 planned power storage projects, with total planned maximum charging/discharging power 9.09 GW and energy storage capacity 3.53 GW·h |
Note: the established storage capacity of gas storages refers to the annual working capacity of the gas storage. |
3.2.3. Energy transportation facilities
3.2.4. Ancillary facilities
3.3. Well-matched CCS/CCUS source and sink
3.4. Small population density
3.5. Proximity to energy consumption areas
4. Model construction of the energy super basin
4.1. Principles and model construction workflow
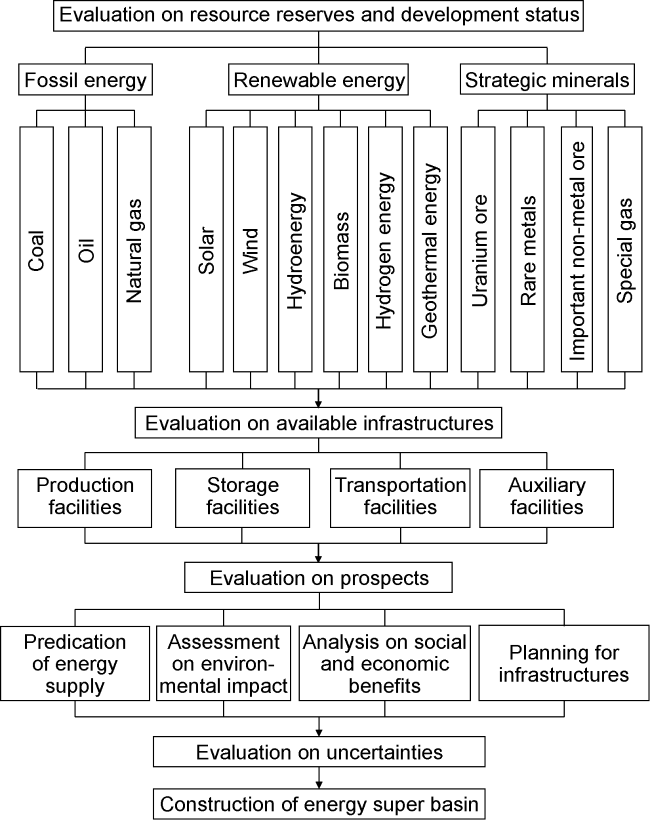
Fig. 2. Workflow of the energy super basin model construction. |
Table 2. Key structural parameters of the Ordos Energy Super Basin |
| Year | Energy supply | Carbon emission/108 t | CCS/CCUS carbon consumption capacity/ 108 t | ||||||
|---|---|---|---|---|---|---|---|---|---|
| Raw coal/ 108 t | Oil/ 104 t | Natural gas/ 108 m3 | New energy power generation/(108 kW·h) | Uranium/ t | Total energy supply in standard coal/108 t | Energy production | Energy utilization | ||
| 2023 | 16.0 | 3 825 | 742 | 1 107 | 410 | 17.13 | 2.27 | 32.32 | 0.032 |
| 2035 | 12.6 | 4 000 | 1 500 | 12 000 | 610 | 19.04 | 2.21 | 19.63 | 0.200 |
| 2050 | 9.8 | 3 800 | 1 500 | 36 000 | 920 | 23.01 | 1.93 | 12.08 | 0.500 |
Note: The supply data for fossil fuels in 2023 is the actual data. The supply of uranium is estimated based on the distribution of uranium reserves in China and the national output of uranium in 2023. The power generation of new energy is estimated based on the installed capacity of wind and PV in the basin (about 61 GW) with an annual effective power generation time of 1 800 h [4]. The data for CCS/CCUS carbon emission and consumption is cited from Reference [4]. The data for energy supply and CCS/CCUS carbon emission and consumption in 2035 and 2050 is cited from Reference [4] and the prediction from the author for the Ordos Basin. The carbon emissions are the amount of CO2 generated in the process of energy production and utilization, while the carbon emissions from plant construction, equipment manufacturing, energy transportation, refining, storage and other fields are not included. |
Table 3. Conversion coefficients of energy supply and carbon emissions |
| Energy source | Standard coal coefficient | Carbon emission intensity of energy production | Carbon emission intensity of energy utilization | ||
|---|---|---|---|---|---|
| 2023 | 2035 | 2050 | |||
| Coal | 0.71 t/t | 0.22 t/t | 1.86 t/t | 1.29 t/t | 0.93 t/t |
| Oil | 1.43 t/t | 0.25 t/t | 3.10 t/t | 2.50 t/t | 2.20 t/t |
| Natural gas | 1.33×10⁻³ t/m3 | 4.00×10⁻⁴ t/m3 | 1.90×10⁻³ t/m3 | 1.60×10⁻³ t/m3 | 1.40×10⁻³ t/m3 |
| New energy power generation | 1.23×10⁻⁴ t/(kW·h) | 0 | 0 | 0 | 0 |
| Uranium | 9.83×10⁵ t/t | 1.20×10⁻² t/t | 5.52×10⁻³ t/t | 5.00×10⁻³ t/t | 4.50×10⁻³ t/t |
Note: The standard coal coefficients of coal, oil, natural gas, and electricity are provided in the General Rules for Calculation of the Comprehensive Energy Consumption (GB/T 2589-2020) [39]. Since the standard coal coefficient of uranium is not mentioned in Reference [39], when uranium is considered for nuclear power generation in this study, the uranium power generation capacity is determined by 35% of the efficiency of nuclear power plants and converted into standard coal equivalent. The data of carbon emission intensity of coal production, uranium mining, and nuclear power generation is obtained from references [40-41]. The data of carbon emission intensity of oil and gas production is cited from the reports Carbon Emission Intensity of Domestic Oil Production in China [42] and Carbon Emission Intensity of Domestic Natural Gas Production in China [43] released by China University of Petroleum (Beijing). According to the Life Cycle Assessment of Electricity Generation Options [44] released by the United Nations Economic Commission for Europe (UNECE), the carbon emissions from wind and PV power generation arise from equipment manufacturing, which are not accounted for in this study. The carbon emission intensity of fossil energy utilization is referenced from the Carbon Dioxide Emission Accounting Methods and Data Verification Forms [45] released by the National Development and Reform Commission, PRC. |
4.2. Energy structure optimization
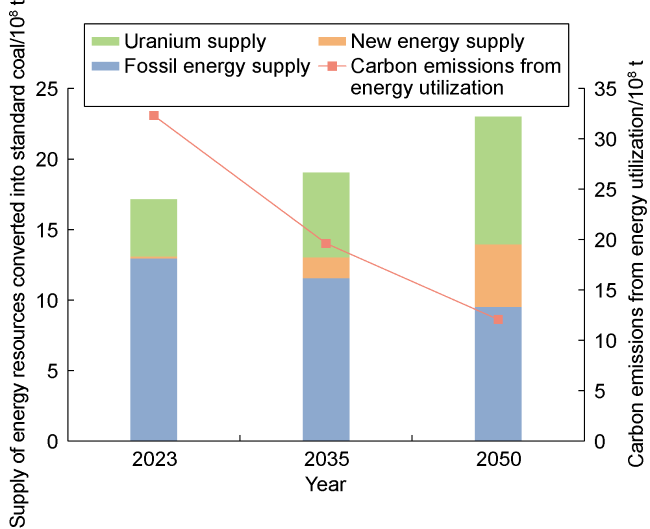
Fig. 3. Energy structure and carbon emissions in the Ordos Basin. |
4.3. Reduction of carbon emissions
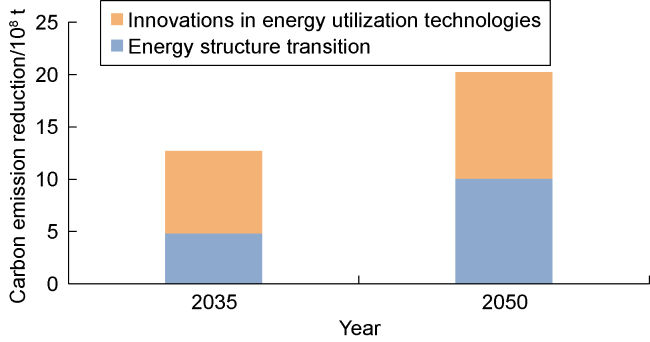
Fig. 4. Carbon emission reduction for energy utilization of the Ordos Basin relative to 2023. |
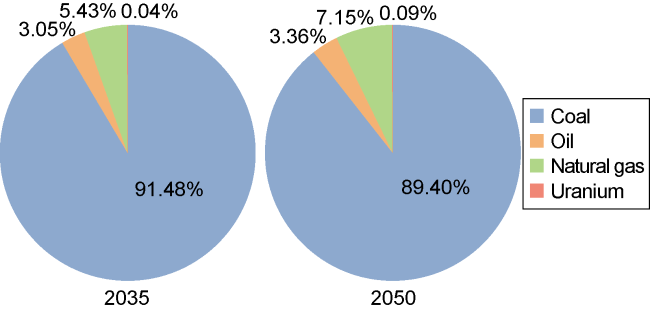
Fig. 5. Carbon emission reduction by clean energy utilization technologies. |
4.4. Regional economic development

Fig. 6. Economic development level distribution of cities/counties within the territory of the Ordos Basin. |
Table 4. Economic benefits from energy supply in the Ordos Basin |
| Year | Economic benefit of coal/ 108 yuan | Economic benefit of oil/ 108 yuan | Economic benefit of natural gas/108 yuan | Economic benefit of power generation/ 108 yuan | Total benefits/ 108 yuan | Energy benefits per capita GDP/ 104 yuan | Per capita GDP increase compared to 2023/104 yuan |
|---|---|---|---|---|---|---|---|
| 2023 | 6 857 | 1 186 | 913 | 6 781 | 15 737 | 6.13 | |
| 2035 | 5 400 | 1 240 | 1 845 | 12 160 | 20 645 | 8.04 | 1.91 |
| 2050 | 4 200 | 1 178 | 1 845 | 21 920 | 29 143 | 11.34 | 5.22 |
Note: The prices of standard coal, oil, natural gas, and electricity are 600 yuan/t, 3 100 yuan/t, 1.19 yuan/m3 and 0.2 yuan/(kW·h), respectively. |
5. Requirement for constructing the energy super basin
Table 5. Planning and progress of construction of the energy super basin |
| Data item | Annual carbon consumption capacity of CCS/CCUS/ 104 t | Annual transmission capacity of power grid/ (1012 kW·h) | Annual transmission capacity of natural gas pipelines/108 m3 | New energy power storage capacity/(GW·h) | Working gas capacity of underground gas storage/ 108 m3 | New energy installed capacity/ GW | Annual natural gas production/ 108 m3 | Annual oil produc- tion/104 t | Annual raw coal produc- tion/108 t |
|---|---|---|---|---|---|---|---|---|---|
| Target | 5 000 | 3.6 | 1 500 | 400.0 | 150 | 2 000 | 1 500 | 3 800 | 9.8 |
| Actual | 320 | 1.2 | 1 500 | 4.5 | 58 | 61 | 742 | 3 825 | 16.0 |
| Completion rate/% | 6 | 33.3 | 100 | 1.1 | 38 | 3 | 49 | 101 | 163.3 |
Note: The targets for the transmission capacity of power grid and natural gas pipelines only account for the exporting energy generated in the Ordos Basin, but not the energy sources that are transported through the Ordos Basin from other regions. The actual transmission capacities of power grid and natural gas pipelines should be slightly higher than the targets. |