

Introduction
In the process of deep coal rock fracturing, fracturing fluid entering into coalbed can cause pulverized coal migration, solid phase damage, phase trap damage, fluid sensitivity and so on [1-2]. In addition, metal ions in high salinity formation water will inhibit the effective extension of molecular chains in fracturing fluid and reduce swelling performance, which will reduce the temperature resistance, shear resistance, sand carrying capacity and viscosity reducing ability of fracturing fluid. This leads to adsorption and accumulation of thickener in pores and fractures to block the seepage channels. Therefore, reducing the damage of fracturing fluid to the reservoir is an important element of deep coal rock gas fracturing [3].
In order to achieve the technical requirements of drag reduction, viscosity increase, sand carrying, and filtration loss reduction, thickener is usually added to the fracturing fluid, and polymer is the main thickener for slickwater, linear gel, and crosslinked gel fracturing fluids. The adsorption of fracturing fluid thickener on the coal rock surface will block pores and fractures, reduce the radius of effective seepage channel, and thus cause the retention of fracturing fluid [4]. It has been shown that the adsorption of thickener on the surface of silica and aluminosilicate rich rocks such as sandstone and shale is mainly controlled by hydrogen bonding and electrostatic effect [5-6]. The deep coal rock has the characteristics of low ash content, high organic content and medium to high thermal maturity. Its unique composition and thermal evolution degree make the adsorption mechanism and controlling factors of fracturing fluid thickener on the coal rock surface more complicated.
This study selected typical deep coal rock, hydroxypropyl guar gum fracturing fluid, and polyacrylamide fracturing fluid, and designed and carried out adsorption experiment of fracturing fluid thickener on the surface of deep coal rock. The adsorption capacity and adsorption layer thickness of fracturing fluid thickener on coal rock surface were measured. The permeability reduction of coal rock caused by adsorption of thickener was evaluated. The three-dimensional morphology of thickener adsorption layer on deep coal surface were characterized and the electrostatic adsorption, chemisorption and intermolecular force adsorption of fracturing fluid thickener was analyzed. Based on this, the adsorption damage mechanism and control countermeasures were revealed.
1. Experiment
1.1. Sample
Experimental rock sample: The Carboniferous Benxi Formation No. 8 coal rock in the Ordos Basin is a typical deep coal rock reservoir with a stable distribution in the whole basin and a buried depth of 2 000-3 800 m [7]. The No. 8 coal rock reservoir needs hydraulic fracturing to obtain industrial gas flow. In this paper, rock samples taken from a deep coal rock gas well were used to carry out experiments. The vitrinite reflectance ranges from 1.2% to 1.9%, which belongs to medium-high thermal maturity [8]. The maceral is mainly vitrinite with high fixed carbon content. Coal rock is weakly hydrophilic and strongly oleophilic. The coal rock samples were crushed, and two kinds of particles with particle diameter of 425-850 μm and 25-75 μm were sieved. Eight irregular lump coal rocks with contour size of 10 mm to 20 mm were prepared to characterize the microscopic morphology of adsorption layer. Six columnar coal rock cores with diameter of 25 mm and length of 50 mm were prepared for permeability damage evaluation. The coal samples were stored in sealed tube or reagent bag to avoid oxidation.
Experimental fluid: (1) Hydroxypropyl guar gum fracturing fluid and polyacrylamide fracturing fluid, which are commonly used for hydraulic fracturing of deep coal rock, were selected. The relative molecular weight of hydroxypropyl guar gum is (1.8-3.0)×106, and the viscosity of the gel breaking liquid with a mass fraction of 0.4% is 5.0 mPa·s. The relative molecular weight of polyacrylamide is about 3.0×10⁶, and the viscosity of the gel breaking liquid with a mass fraction of 0.4% is 4.5 mPa·s. (2) According to the General Technical Specifications of Fracturing Fluids (SY/T 6376-2008) [9], fracturing fluid was prepared with water. After preparation, the fracturing fluid residue was removed by vacuum filtration in Buchner flask, and the filtrate was extracted and set aside. (3) According to the ionic composition of formation water in deep coal rock gas reservoir, calcium chloride type formation water with salinity of 80 000 mg/L was prepared for testing cores permeability.
1.2. Method
Based on the coal rock particles static adsorption and core dynamic displacement experiments, the adsorption capacity of fracturing fluid thickener in deep coal rock and the permeability damage of adsorption were evaluated. Atomic force microscopy was used to characterize the three-dimensional morphology of adsorption layer, quantify the thickness of the adsorption layer, and explore the response factors of adsorption layer. Zeta potential, infrared spectrum and X-ray photoelectron spectroscopy were comprehensively used to investigate deep coal rock parameters before and after adsorption and reveal the adsorption mechanism.
1.2.1. Evaluation of static adsorption of fracturing fluid thickener
Spectrophotometry calculates the mass fraction of solute by measuring the absorbance of solution. According to Lambert-Beer law, the absorbance of monochromatic light passing through dilute colored solution has a linear relationship with the mass fraction of solute when the thickness of liquid layer is constant. The adsorption capacity per unit mass of coal rock is calculated by the following formula:
$\Gamma =\frac{\left( {{A}_{1}}-{{A}_{2}} \right)V}{km}$
The temperature of Benxi Formation No. 8 coal rock reservoir is 61.3-87.4 °C [8]. The gas well shut-in time after fracturing is 41 d [10]. Typical mineral adsorption thickener equilibrium time is 2-6 h [11-12]. Considering fracturing process and the efficiency of laboratory experiment, the experimental environment was set at 60-80 °C for 48 h of constant temperature adsorption. The mass fraction of hydroxypropyl guar gum was measured by anthranone colorimetry [11], and the mass fraction of polyacrylamide was measured by starch-cadmium iodide method [12].
Experimental steps are as follows:
(1) The spectrophotometer 722 was turned on and preheated to calibrate absorbance and transmittance.
(2) The mass fraction-absorbance standard curves of hydroxypropyl guar gum and polyacrylamide were tested and fitted.
(3) Two parts of 10 g coal rock particles with diameter of 425-850 μm were taken and then added with 40 mL of mass fraction 0.4% polyacrylamide fracturing fluid and hydroxypropyl guar gum fracturing fluid, respectively. The experimental results of this group after adsorption at 60 °C for 48 h were regarded as the adsorption group.
(4) 40 mL of mass fraction 0.4% polyacrylamide fracturing fluid and hydroxypropyl guar gum fluid were taken into centrifugal tubes respectively and placed in a water bath at 60 °C for 48 h. The experimental results of this group were used as control group.
(5) The two groups of samples were centrifuged for 20 min, and the supernatant was taken to test the absorbance.
1.2.2. Evaluation of dynamic permeability damage of fracturing fluid thickener
The adsorption and retention of fracturing fluid thickener in porous media, such as coal, will cause permeability damage. The damage rate caused by adsorption can be quantitatively evaluated by measuring the permeability before and after adsorption of fracturing fluid thickener in coal rock cores.
Experimental steps are as follows:
(1) The confining pressure was set to 2.5 MPa and the displacement pressure difference to 0.5 MPa.
(2) One coal rock core was taken, saturated with formation water for 24 h and put into core holder. The initial permeability was tested after forward displacement with 3 times pore volume of formation water.
(3) Reverse displacement was performed with 3 times pore volume of filtrate of hydroxypropyl guar gum fracturing fluid.
(4) Coal rock core permeability after filtrate adsorption was tested after forward displacement with 3 times pore volume of formation water.
(5) The coal rock core was replaced with another one to repeat steps (2) to (4). A total of 3 core experiments were completed according to this step.
(6) The filtrate in step (3) was replaced with polyacrylamide fracturing fluid to repeat steps (2) to (5). Three core tests were carried out.
1.2.3. Microscopic characterization of fracturing fluid thickener adsorption morphology
Bruker Dimension Icon atomic force microscope (AFM) was used to quantitatively characterize the three-dimensional adsorption morphology and layer thickness of fracturing fluid thickener [13]. The experimental scheme design is shown in Table 1 .
Table 1. Design of AFM adsorption experiment parameters |
| No. | Type | Mass fraction/ % | pH | Temperature/ °C | Remarks |
|---|---|---|---|---|---|
| 1 | Hydroxypropyl guar gum | 0.4 | 9.0 | 20 | Control group |
| 2 | 0.2 | 9.0 | 20 | Mass fraction comparison | |
| 3 | 0.4 | 7.0 | 20 | pH comparison | |
| 4 | 0.4 | 9.0 | 80 | Temperature comparison | |
| 5 | Polyacrylamide | 0.4 | 7.0 | 20 | Control group |
| 6 | 0.2 | 7.0 | 20 | Mass fraction comparison | |
| 7 | 0.4 | 9.0 | 20 | pH comparison | |
| 8 | 0.4 | 7.0 | 80 | Temperature comparison |
Experimental steps are as follows:
(1) A total of 8 lump coals were taken and the test surfaces were inlay polished.
(2) The 48 h adsorption experiment for each group was completed according to the scheme shown in Table.1 .
(3) The residual fracturing fluid on lump coals was washed with deionized water and dried in thermostat at 60 °C for 4 h.
(4) The adsorption morphology was observed by AFM, and the adsorption layer morphology and thickness were analyzed by NanoScope software.
1.2.4. Evaluation of electrostatic adsorption of fracturing fluid thickener
Zeta potential was used to measure the electric charge characteristics of coal rock dispersed in fracturing fluid to analyze the surface electrical changes of coal rock after contact with fracturing fluid.
Experimental steps are as follows:
(1) Several 0.1 g coal rock particles with diameter of 25 μm to 75 μm were dispersed in 100 mL deionized water with pH value of 2, 3, 4, 5, 6, 7, 8, 9, 10, 11, 12, respectively. The Zeta potential was measured by Zeta potentiometer after stir.
(2) Coal rock particles with the same diameter and mass as in step (1) were dispersed into 100 mL filtrate of hydroxypropyl guar gum fracturing fluid and polyacrylamide fracturing fluid with the same pH value as step (1). The Zeta potential was measured after stir.
1.2.5. Evaluation of adsorption of functional group of fracturing fluid thickener
Based on the infrared absorption frequency of the coal rock samples, the information of chemical bonds or functional groups of the samples before and after the adsorption of fracturing fluid thickener can be obtained [11].
Experimental steps are as follows:
(1) 2 g of coal rock particles with diameter of 25-75 μm were dispersed in 10 mL hydroxypropyl guar gum and polyacrylamide fracturing fluid filtrate, respectively. The samples were placed in thermostat at 60 °C for 48 h.
(2) The coal rock particles after adsorbing fracturing fluid were filtered and dried. The infrared spectral transmittance of raw coal rock particles and coal rock particles after adsorption were measured by WQF520 Fourier transform infrared spectrometer.
(3) The types of coal rock functional groups and adsorption categories were analyzed after denoising, baseline correction and peak-seeking.
1.2.6. Evaluation of adsorption of intermolecular force of fracturing fluid thickener
The full spectra and high-resolution spectra of coal rock were measured by X-ray photoelectron spectroscopy (XPS). The change of electron binding energy of coal rock after adsorption of fracturing fluid thickener was analyzed to determine the chemical bond state or the microscopic force on atoms.
Experimental steps are as follows:
(1) 2 g of coal rock particles with diameter of 25-75 μm were dispersed in 10 mL hydroxypropyl guar gum and polyacrylamide fracturing fluid filtrate, respectively. The samples were placed in thermostat at 60 °C for 48 h.
(2) The coal rock particles after adsorbing fracturing fluid were filtered and dried. The full spectra and high-resolution spectra of raw coal rock particles and coal rock particles after adsorption were measured by XPS.
(3) Avantage software was used to charge shift, and the high-resolution spectra were peak fitted after background subtraction. The distribution of elements and electron binding energy were analyzed.
2. Results and discussion
2.1. Static adsorption capacity of fracturing fluid thickener
After the hydroxypropyl guar gum and polyacrylamide fracturing fluid were standing for 48 h, the mass fraction of thickener decreased from the initial value of 0.400%-0.344% and 0.347% due to the polymer self-degradation, condensation and precipitation. After adsorption, the mass fraction of thickener decreased to 0.248% and 0.265%, respectively, and the adsorption proportion were 28.0% and 23.7% of the total. The static adsorption capacity of coal rock for hydroxypropyl guar gum is 3.86 mg/g, which is higher than that for polyacrylamide 3.29 mg/g. Generally, the thickener adsorption capacity of shale is 3.02-7.23 mg/g, and that of sandstone is 2.23-4.21 mg/g [5-6]. It can be seen that the thickener adsorption capacity of deep coal rock is the same order of magnitude as that of shale and sandstone.
2.2. Dynamic permeability damage of fracturing fluid thickener
The permeability of deep coal rock was damaged to varying degrees after adsorption of hydroxypropyl guar gum and polyacrylamide. As shown in Table 2 , the coal rock cores permeability damage rate after adsorption of hydroxypropyl guar gum is 35.24%-37.01%, and that of polyacrylamide is 14.31%-21.93%. The permeability damage rates of both thickeners are lower than that of shale 40.2% [5]. Hydroxypropyl guar gum damages coal rock at a higher rate than the 25.8% for sandstone [6].
Table 2. Dynamic permeability damage of deep coal rock by fracturing fluid thickener adsorption |
| Type | No. | Porosity/ % | Initial permeability/ 10−3 μm2 | Permeability after adsorption/10−3μm2 | Damage rate/% |
|---|---|---|---|---|---|
| Hydroxy- propyl guar gum | DC-1 | 2.37 | 2.39 | 1.54 | 35.62 |
| DC-2 | 2.32 | 4.13 | 2.60 | 37.01 | |
| DC-5 | 2.60 | 0.45 | 0.29 | 35.24 | |
| Polyacry- lamide | DC-3 | 2.40 | 6.98 | 5.45 | 21.93 |
| DC-4 | 2.34 | 6.00 | 5.14 | 14.30 | |
| DC-6 | 1.39 | 0.39 | 0.32 | 19.63 |
2.3. Microscopic morphology of adsorption layer of fracturing fluid thickener
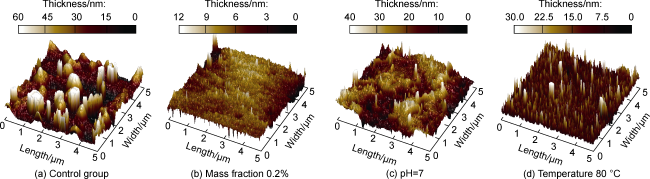
Fig. 1. Three-dimensional morphology of hydroxypropyl guar gum adsorption layer on the surface of deep coal rock. |
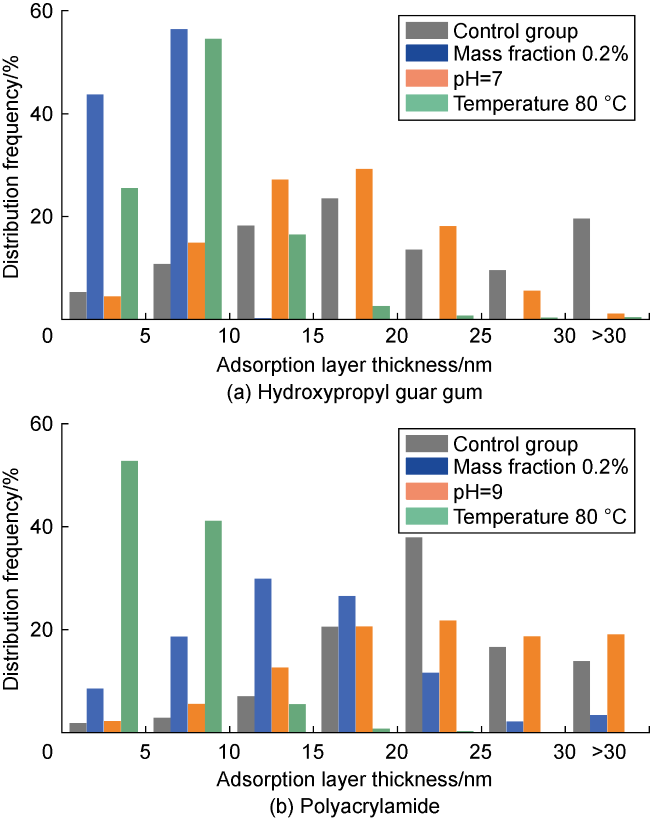
Fig. 2. Thickness distribution of thickener adsorption layer on the surface of deep coal rock. |
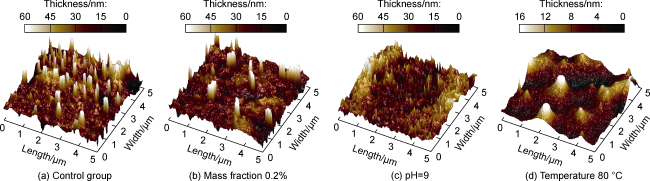
Fig. 3. Three-dimensional morphology of polyacrylamide adsorption layer on the surface of deep coal rock. |
2.4. Electrostatic adsorption of fracturing fluid thickener
The surface of deep coal rock is weakly electrically charged (Fig. 4 ), and the absolute value of Zeta potential in neutral deionized water is less than 1 mV. When pH=2, due to H+ and charge transfer, the coal rock surface has a weak positive charge, the Zeta potential is 0.67 mV and the isoelectric pH is 3. In alkaline solution, the rocks attract OH− to form a partially hydroxylated surface with negative electricity, which is more obvious when pH equals 11 to 12, and the Zeta potential drops to −9.34 mV. When deep coal rock comes into contact with hydroxypropyl guar gum fracturing fluid and polyacrylamide fracturing fluid, some of the thickener molecules are adsorbed on the surface of the coal rock, making it more difficult to ionize hydroxyl groups and inorganic minerals. The Zeta potential decreases to -1.88 mV and -2.25 mV when pH is 11-12. The hydroxypropyl guar gum-coal rock isoelectric point pH is 3, and the polyacrylamide-coal rock isoelectric point pH is 4.4. There is no significant change in Zeta potential under neutral and weakly alkaline conditions. Therefore, it can be judged that electrostatic force is not a major factor in the adsorption of thickeners by coal rocks.
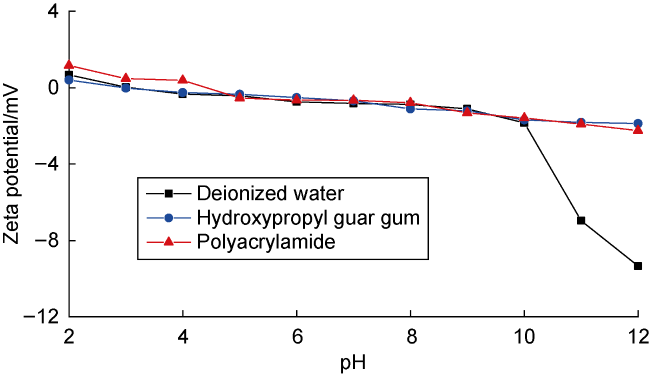
Fig. 4. Zeta potential of deep coal rock versus pH value in different fluids. |
2.5. Functional group adsorption of fracturing fluid thickener
The types of functional groups in deep coal rock are complex, and the adsorption peaks of FTIR show multi-peak characteristic (Fig. 5 ). Since the test atmosphere of WQF520 spectrometer is air, there is no potential peak of the sample near the CO2 stretching vibration peak, which has no effect on the experiment. The chemical bonds of hydroxypropyl guar gum are mainly C-H and C-C of polysaccharides, and there is obvious O-H stretching vibration and C-O stretching vibration peaks. No new absorption peaks appear in coal sample adsorbed with hydroxypropyl guar gum fracturing fluid, indicating that no new functional groups or chemical bonds are formed after the adsorption of hydroxypropyl guar gum in coal rock. However, the O-H stretching vibration peaks at wave number 3 500-3 700 cm-1 almost disappear. It suggests that after adsorption, the hydroxyl groups on the surface of deep coal rock may undergo condensation polymerization with hydroxypropyl guar gum to form C-O-C like ether bond. Alternatively, the presence of intermolecular hydrogen bonds attenuates the O-H vibration.
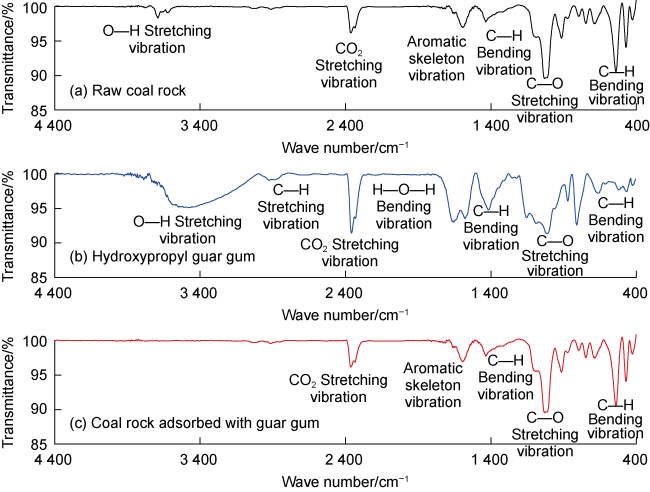
Fig. 5. Infrared spectral curve of coal rock adsorbed with hydroxypropyl guar gum. |
Polyacrylamide functional groups are mainly hydroxyl and amide groups. Typical C-N stretching vibration, N-H bending vibrations, and C-O stretching vibrations were detected by FTIR. Hydrocarbon C-H bending vibration peaks and O-H stretching vibration peaks were present (Fig. 6 ). These are the characteristics of the amide group. No new absorption peaks appeared in coal rock after adsorption of polyacrylamide fracturing fluid, preserving the complex multi-peak characteristics of the fingerprint region. It indicates that no new functional groups or chemical bonds were produced after the adsorption of polyacrylamide in coal rock, and no condensation polymerization occurred.
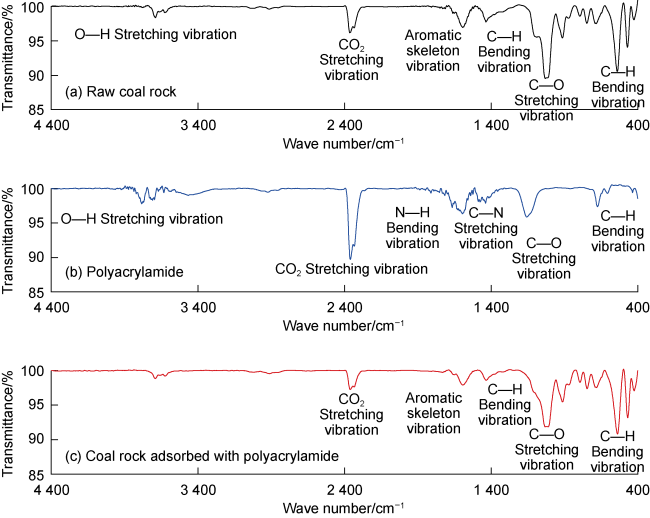
Fig. 6. Infrared spectral curve of coal rock adsorbed with polyacrylamide. |
2.6. Intermolecular forces of fracturing fluid thickener
Intermolecular forces affect the electron binding energy through electron cloud interactions. There is no significant difference in the material composition of the coal rock before and after adsorption (Fig. 7 ).
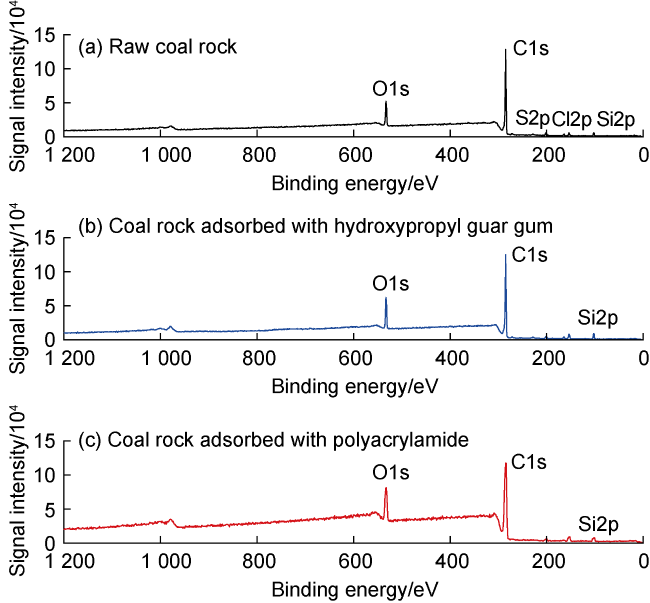
Fig. 7. Full-wave band XPS analysis of coal rock. O1s -electrons in 1s orbital of oxygen atoms; C1s -electrons in 1s orbital of carbon atoms; S2p -electrons in 2p orbital of sulfur atoms; Cl2p -electrons in 2p orbital of chlorine atoms; Si2p -electrons in 2p orbital of silicon atoms. |
Three spectral peaks corresponding to C-C, C-O, and C═O bonds can be observed in the C1s band (Fig. 8 ). The adsorption of hydroxypropyl guar gum in coal rock reduces the binding energy of the three spectral peaks by 0.3-0.4 eV. Hydroxypropyl guar gum adsorption attracts C1s electrons through intermolecular forces, thus weakening the bond strength of C1s electrons to the nucleus. After adsorption of polyacrylamide in coal rock, the amide group increases the proportion of C═O bonds in the C1s spectrum from 3.89% to 33.82%. The C═O and C-O binding energies decrease by 0.3 eV and 0.1 eV, respectively. Polyacrylamide likewise attracts the C1s electrons through intermolecular forces, reducing the binding energy.
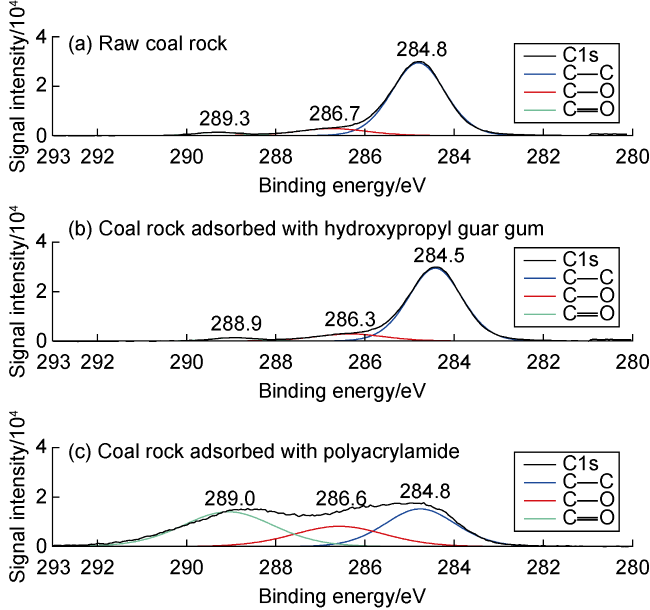
Fig. 8. Peak fitting in C1s band of XPS high-resolution spectra. |
Two spectral peaks of C-O bonds and C═O bonds can be observed in O1s band (Fig. 9 ). After adsorption of hydroxypropyl guar gum and polyacrylamide in coal rock, the spectral peaks are hardly shifted, and the adsorption increases the width of the peaks to different degrees. It indicates that the electron binding energy of the oxygen does not change significantly after adsorption of fracturing fluid thickener.
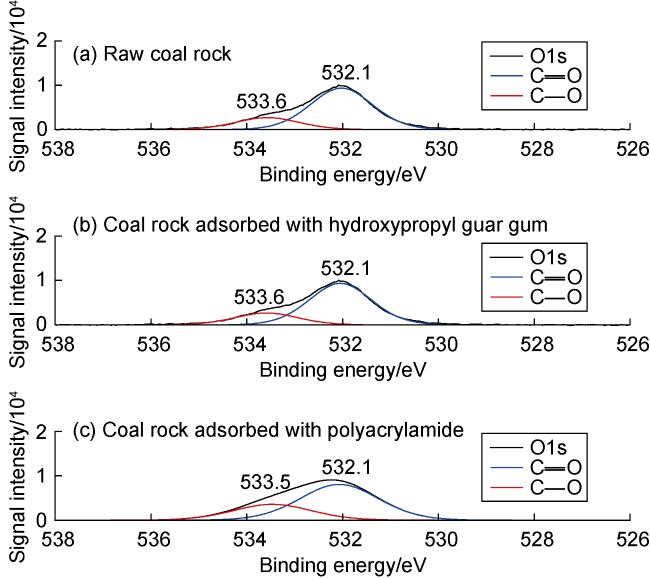
Fig. 9. Peak fitting in O1s band of XPS high-resolution spectra. |
3. Adsorption damage mechanism and control countermeasures of fracturing fluid thickener in deep coal rock
3.1. Adsorption mechanism of fracturing fluid thickener in deep coal rock
3.1.1. Electrostatic adsorption in deep coal rock
Negatively charged rock surfaces are usually related to mineral composition. Silicate minerals are easily hydrolyzed to form negatively charged ions. Silicon dioxide undergoes lattice substitutions and silicon-oxygen bond breakage making the rock surface negatively charged. Hydroxyl groups in organic compounds are typically polar groups that can form hydrogen bonds and are negatively charged in aqueous solutions. Proximate analysis of coal shows that the deep coal rock in the Ordos Basin has the ash content (mainly composed of silicon dioxide and silicate) of 4.77%-4.94%, so it is categorized as extra low ash coal. The results of elemental analysis show that the coal rock elements are mainly C, O, and a trace of S, Cl, Si, of which the Si content is 4.24%-7.22%. The deep coal rock belongs to the medium-high coal rank, and the organic matter consists mainly of aromatics and alkanes. With the increase of thermal maturity, the proportion of oxygen-containing groups in the molecular structure of coal rock organic matter decreases, the hydroxyl groups gradually decrease to form short aliphatic chains or ether bonds, and aromatic system is gradually formed through cross-linking and polycondensation [14]. The low formation of negative ions from mineral ionization and the low proportion of hydroxyl groups in the deep coal rock of the medium-high coal rank along the eastern margin of the Ordos Basin causes it difficult to make the surface of coal rock show obvious electrostatic characteristics. Therefore, electrostatic adsorption is not the main reason for the adsorption of fracturing fluid thickener in deep coal rock.
3.1.2. Functional groups adsorption in deep coal rock
FTIR reveals that the functional groups of coal rock are mainly large molecular aromatics and alkanes, and there are hydroxyl, carboxyl, and ester groups which are susceptible to substitution or polymerization reactions. The experimental results showed that the characteristics of the fingerprint region (wave number 400-1 300 cm−1) of the coal rock are not significantly changed after adsorption of hydroxypropyl guar gum and polyacrylamide. After adsorption of hydroxypropyl guar gum, the original O-H stretching vibration signal peak (wave number near 3 500 cm−1) almost disappears, while there is no significant shift in the electron binding energy of O1s. It indicates that the hydroxyl groups on the surface of deep coal rock undergo condensation polymerization with the groups, such as hydroxyl, on the molecular chain of hydroxypropyl guar gum, and consequently ether bonds like C-O-C are formed. This kind of condensation polymerization produces a strong chemisorption. Therefore, the condensation polymerization between chemically active functional groups is one of the reasons for the adsorption of hydroxypropyl guar gum on the surface of deep coal rock. After the adsorption of polyacrylamide in coal rock, new functional groups or chemical bonds are not produced, and there is no similar condensation polymerization reaction. Therefore, the chemisorption of functional groups does not affect the adsorption of polyacrylamide on the surface of deep coal rock.
3.1.3. Intermolecular forces between coal rock and fracturing fluid thickener
Intermolecular forces, which commonly include van der Waals forces, hydrogen bonding, and π-stacking [15], contribute to adsorption of thickeners on rock surfaces [5]. After the thickeners are adsorbed, the electron binding energies of the 1s orbital of the C-C, C-O, and C═O bonds in the C1s spectrum are reduced by 0.1-0.4 eV.
Hydrogen bonds act mainly between polar molecules containing hydrogen and electronegative molecules. Both hydroxypropyl guar gum and polyacrylamide contain hydroxyl groups, which can interact with coal rock to form hydrogen bonds, leading to changes in the electron binding energy of O1s [6]. However, the magnitude of change in O1s binding energy after adsorption is small. It suggests that hydrogen atoms do not share electrons with the oxygen of C-O bonds through hydrogen bond and that hydrogen bond effect is limited. Van der Waals forces and π-stacking are the main noncovalent bonding forces [16-17] that play a role in physisorption of coal. For example, van der Waals forces account for 79%-87% of coal adsorbed phenol [18], and van der Waals forces and π-stacking account for 55% of coal adsorbed surfactants [19]. Both van der Waals forces and π-stacking show a small decrease in the electron binding energy of C1s [17]. There are induction force and dispersion force between nonpolar molecules in coal rock and hydroxypropyl guar gum or polyacrylamide, all of which are van der Waals forces. π-stacking occurs between aromatic molecules and other molecules. Coal rock has aromatic rings, and the saturated -CH groups in the thickener can adsorb with aromatic rings through CH-π stacking [20], resulting a decrease in electron binding energy. As can be seen in Fig. 8 , the binding energies of C1s corresponding to C-C, C-O and C═O bonds decrease after coal rock adsorbs thickener. It is revealed that the intermolecular forces between the coal rock and thickener are mainly van der Waals forces and π-stacking.
3.2. Adsorption damage mechanism of fracturing fluid in deep coal rock
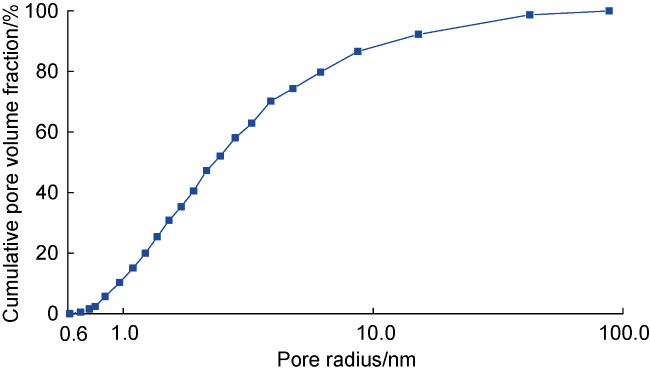
Fig. 10. Pore radius distribution of nanopores in deep coal rocks measured by nitrogen adsorption experiment. |
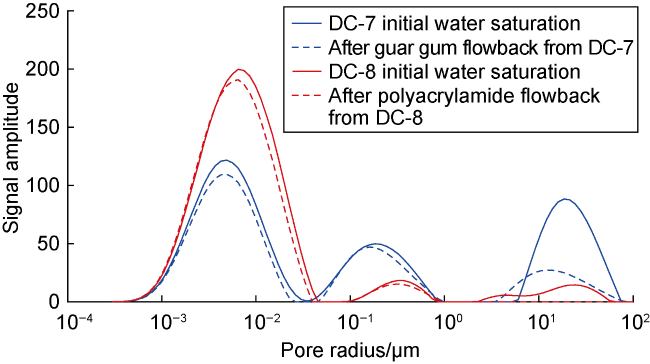
Fig. 11. Nuclear magnetic resonance T2 spectra of deep coal rock before and after fracturing fluid flowback by gas displacement. |
The adsorption of pulverized coal to thickener has potential solid-phase blockage damage. Yang et al. [12] suggested that the adsorption of polyacrylamide by coal particles with diameter less than 150 μm can reach 38 mg/g, which is much higher than the experimental result of 3.29 mg/g in this paper. The experiments in this paper used pulverized coal rock with diameter of 425-850 μm. The specific surface area of 150 μm coal particle is about 8-32 times of that of the pulverized coal used in the experiments in this paper. The increase in specific surface area significantly increases the adsorption capacity of polyacrylamide in pulverized coal. In the process of coal rock gas development, pulverized coal sheds and migrates, and then is produced together with coalbed methane. The diameter of the produced pulverized coal is generally 45-150 μm [22], the specific surface area is also much larger than the pulverized coal rock in this paper. Therefore, the adsorption capacity of thickener on the surface of pulverized coal in fracturing may be higher than the experimental results.
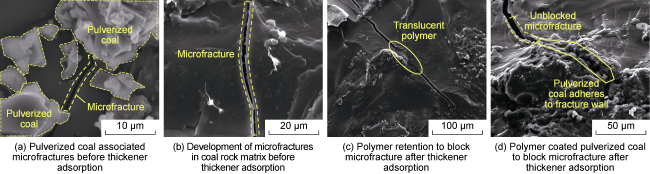
Microfractures are developed in the deep coal rock (Fig. 12a, 12b ), with width generally ranging from 4 μm to 74 μm [23], and they are the main gas migration channels. After the fracturing fluid intrusion and flowback, high molecular weight polymers along with the organic components of coal rock will be adsorbed on microfracture wall by functional group polymerization, and intermolecular forces. This will block seepage channels and reduce coal rock permeability (Fig. 12c ). In addition, the polymer thickener adsorbs on the surface of pulverized coal and adheres the pulverized coal to the fracture wall. This intensifies the sedimentation of pulverized coal during migration, blocking the seepage channels (Fig. 12d ).
Fig. 12. Scanning electron microscope morphology of microfractures before and after fracturing fluid intrusion into deep coal rock. |
3.3. Adsorption damage control countermeasures for fracturing fluids thickener in deep coal rock
Compared with the middle/shallow burial depth coal, the deep coal rock reservoirs have high gas saturation, high formation water salinity, and extraordinarily low porosity and permeability. Compared with shale and tight sandstone reservoir, deep coal rock has high fracture density, high organic fraction, and low mechanical strength. Therefore, nanopores and microfractures are the main channels for gas migration in deep coal rock reservoirs. During development, pulverized coal easily sheds and migrates, with potential permeability damage. Additionally, in the process of hydraulic fracturing to create fractures, the factors such as blockage of gel breaking residue, solid phase blockage of pulverized coal, liquid phase retention, and polymer adsorption, are superimposed on each other, leading to a decline in the permeability of some fractures and making it difficult to recover, restricting the efficient development of deep coal rock gas.
In order to reduce the potential damage to microscale and nanoscale pores and fractures during the development, 4 countermeasures are proposed with full consideration of the adsorption mechanism and the factors affecting the adsorption layer of the fracturing fluids in deep coal rock. (1) Polymer molecules undergo curling and sedimentation when they come into contact with highly mineralized formation water [24]. Reasonable reduction of thickener mass fraction can effectively decrease the thickness of adsorption layer and control the damage. (2) Modify the hydroxyl group of thickener to an inactive group, so as to maintain its water solubility and reduce the adsorption capacity of hydroxyl group by condensation polymerization. Alternatively, acidification can be used to break some of the functional groups of coal rock, so as to reduce its adsorption capacity [25]. (3) Apply oxidative thermogenesis gel breakers in fracturing fluid. On the one hand, it promotes polymer degradation. The decomposition of aliphatic hydrocarbons and benzene in coal produces a large amount of CO2 [26] and promotes the desorption of adsorbed methane, while increasing the permeability of the coal rock and promoting diameter reduction of pulverized coal [27]. On the other hand, it raises temperature, intensifies molecular motion and reduces van der Waals forces to decrease adsorption capacity. (4) Develop low molecular weight desorption agent, which can prevent adsorption of fracturing fluid. Small molecules containing reactive functional groups, like hydroxyl and amino groups, can decrease the adsorption sites for condensation polymerization of oxygen-containing functional groups in coal rock by competitive adsorption. In addition, aromatic hydrocarbons are able to form tight conjugate with the coal rock to prevent the adsorption of polymers [28].
4. Conclusions
Fracturing fluid thickener is easily adsorbed on the surface of deep coal rock. In the experimental conditions of this paper, coal rock permeability decreased by 35.24%-37.01% after adsorption of hydroxypropyl guar gum, and by 14.31%-21.93% after adsorption of polyacrylamide.
The thickness of adsorption layer of the fracturing fluid thickener is directly proportional to the mass fraction and inversely proportional to the temperature. Compared with alkaline solution, the thickness of adsorption layer of hydroxypropyl guar gum is lower in neutral solution, and the distribution frequency of the thickness of adsorption layer of polyacrylamide is more concentrated in neutral solution.
The surface of deep coal rock is weakly electrically charged, and electrostatic adsorption is not the main factor of thickener adsorption. Condensation polymerization between functional groups is chemical force for the adsorption of hydroxypropyl guar gum in coal rock, but does not affect the adsorption of polyacrylamide on the surface of deep coal rock. Intermolecular forces such as van der Waals forces and CH-π stacking are the physical forces for the adsorption of coal rock to thickener.
The thickness of the adsorption layer and the adsorption intensity can be reduced by optimizing the mass fraction of thickener, chemically modifying the thickener molecule, performing oxidative thermogenesis degradation on the polymer, and adding desorbent. These countermeasures can reduce the potential risk of permeability damage to microscale and nanoscale pores and fractures during deep coal rock gas development.
Nomenclature
A1, A2—absorbance of fracturing fluid of control group and adsorption group, A;
k—absorbance coefficient, A·L/mg;
m—mass of coal rock, g;
V—volume of fracturing fluid, L;
$\Gamma $—adsorption capacity per unit mass of coal rock, mg/g.