

Introduction
The Khasib Formation in the Halfaya oilfield in Iraq is a typical bioclastic limestone porous reservoir with gas- cap and edge-water and low permeability. The reservoir is highly heterogeneous, with porosity of 8.0%-25.6% and permeability of (0.01-80.00)×10-3 μm2. Conventional crude oil exists in the low part of the structure. With a large difference between formation pressure and saturation pressure, the production decline of the oil well is relatively slow. Light crude oil exists in the high part of the structure near the gas cap. With a small difference between formation and saturation pressure, the gas-to-oil ratio rises rapidly, and gas channeling is serious, resulting in a rapid decrease in oil production. The Khasib Formation reservoir accounts for 23.37% of the geo-logical reserves of three major oil fields in Iraq, and shows a great development potential. It is urgent to explore the optimal EOR method.
To develop reservoirs with gas cap and edge water, generally there are methods such as depletion, water injection, gas injection, barrier water injection, gas-water synergistic displacement [1⇓⇓-4]. Depletion development was conducted in G oilfield in the Agadem area of Niger, but the effect was poor. The high production rate in the initial stage led to gas channeling in the oil wells at structural highs, water breakthrough in the oil wells at structural edges, and low oil recovery in the oil ring, consequently a large amount of crude oil irrecoverable underground[5]. Ao et al. [6] systematically analyzed the production performances of the development method with gas-cap barrier water injection and edge water injection for Bektas gas-cap and edge-water reservoirs, and they pointed out that this method can not only increase the formation energy and stabilize the oil-gas contact (OGC), but also prevent the gas cap from expanding. As gas-to-oil ratio of the reservoir decreases rapidly, oil production increases steadily. Liu et al. [7] evaluated the feasibility of associated gas drive development of a porous carbonate S reservoir in the Middle East based on indoor experimental method. The injected gas expanded the volume of crude oil, reduced viscosity and improved fluidity, and the displacement efficiency could reach 52.02%. Liu et al.[8] analyzed the production performance of Ariskum oilfield by injecting gas at the top and barrier water injection, and they found that both field production performance and numerical simulation prediction have confirmed that injecting gas into the gas cap for energy supplement and injecting water for prevention of gas from diffusing can greatly reduce the gas-to-oil ratio near the OGC, and the water barrier for gas invasion is remarkable. In addition, the combination of edge water injection and gas cap injection can not only improve displacement efficiency, but also makes full use of the gas from the gas cap. So it has good social and economic benefits [9⇓⇓⇓-13].
Numerical simulation and physical simulation are mainly used to evaluate the development methods of gas-cap and edge-water reservoirs. Feng et al. [14], Hu et al.[15], and Miao [16] studied the production effects of typical gas-cap and edge-water reservoirs by different development modes (i.e., depletion and gas injection) and gas injection parameters (type, timing and mode of gas injection) through numerical simulation. They found that using the depletion method to develop gas-cap and edge- water reservoirs would cause serious gas channeling and water flooding in oil wells and poor production, but injecting gas can reduce crude oil viscosity, supplement reservoir energy and reduce interfacial tension. The displacement efficiency by injecting gas is 3.25-20.00 percentage points higher than that by injecting water. Based on the material balance theory, Zhou [17] took the JZ25-1S gas-cap and edge-water reservoir as a case, calculated, and analyzed the influence of different injection and production parameters on the migration law of OGC/OWC (oil-water contact) by using reservoir engineering method. He concluded that controlling reasonable injection and production rates can get stable migration of OGC/OWC.
Many scholars conducted core flooding experiments on limestone reservoirs with different injection fluids and injection methods. Su et al.[18] carried out experiments to study the displacement efficiency of different development methods (water flooding, gas flooding, and gas-water alternating flooding) on porous carbonate reservoirs in the Middle East. The results show that water primarily displaces crude oil in macropores, but that in small pores is less produced, so the development effect is the worst. Miscible gas flooding can eliminate interfacial tension and reduce crude oil viscosity so that crude oil in small pores can be produced. CO2-water alternating flooding can enhance displacement efficiency by 20 percentage points higher than that of water flooding. Taking a low-permeability carbonate reservoir in the Middle East as an example, Shi et al.[19] used double cores in parallel and NMR experiments to study the displacement efficiency of different water flooding methods for interlayer heterogeneous reservoirs. They concluded that the displacement efficiency by separate injection and separate production was very different from that by commingled injection and separate production. After water flooding, residual oil remained in the large pores in the form of oil films, and the small pores were still occupied by bound water. Abedini et al.[20] combined core displacement experiment with numerical simulation to study the injection rates of CO2 miscible and immiscible flooding for tight carbonate reservoir, and found that when the injection pressure was lower than the miscible pressure, the flooding effect became worse with the increase of the injection rate; when the injection pressure was close to or higher than the miscible pressure, the effect of gas injection rate on displacement efficiency was small. Motealleh et al. [21] evaluated the development method of CO2-water alternating flooding for carbonate reservoir through experiments and concluded that the process of first continuous gas injection and then alternating injection of gas and water was the optimal development mode. Present physical simulation methods (one-dimensional displacement experiment) ignore the influence of the macroscopic distribution of oil, gas and water in gas-cap and edge-water reservoirs, and it is difficult to simulate the process of "edge/top injection + middle production" by experiment [22⇓-24].
In summary, for gas-cap and edge-water carbonate reservoir, field practice and numerical simulation have confirmed that the combination of gas and water injection is more effective [8]. In this study, we designed an experimental set to simulate the gas-water distribution characteristics of the gas-cap and edge-water reservoir, carried out experiments on the combination method of water flooding and gas-water synergistic displacement, and studied the influences of displacement media and parameters on displacement efficiency of gas-cap and edge-water reservoirs.
1. Displacement experiment
1.1. Experimental materials
1.1.1. Formation crude oil
According to the initial PVT data (pressure, volume, temperature) of formation fluid taken in typical wells and applicable standards [25], degassed oil sample and separator gas were used to prepare the original formation oil sample at a gas-to-oil ratio of 101.87 m3/m3, original formation pressure of 33.21 MPa and formation temperature of 94 °C. The measured saturation pressure of the oil sample was 19.03 MPa, the flash gas-to-oil ratio was 100.8 m3/m3 and the viscosity at saturation pressure was 3.41 mPa·s, which were consistent with the original formation fluid. Table 1 lists the composition of the prepared oil sample and injected gas.
Table 1. The composition of the prepared oil sample and injected gas |
| Composition | Mole fraction of the prepared crude oil/% | Mole fraction of injected gas/% |
|---|---|---|
| CO2 | 1.16 | 4.24 |
| N2 | 0.40 | 0.35 |
| C1 | 25.44 | 71.15 |
| C2 | 8.57 | 12.42 |
| C3 | 8.94 | 4.49 |
| iC4 | 2.62 | 0.89 |
| nC4 | 4.65 | 0.92 |
| iC5 | 1.85 | 2.07 |
| nC5 | 4.28 | 3.42 |
| C6 | 6.99 | 0.05 |
| C7+ | 35.10 |
1.1.2. Injected gas
Injected gas was prepared according to the composition of the gas cap (Table 1 ). Gas injection expansion experiment and thin tube experiment were carried out before core displacement experiment[12] to evaluate the influence of injected gas on the physical properties of the formation fluid under high pressure and whether the injected gas is miscible with the crude oil. Table 2 lists the result of gas injection expansion experiment. With the increase of the volume of gas injected, the elastic expansion capacity of the formation crude oil increased while the viscosity decreased. At the formation temperature of 94 °C and formation pressure of 33.21 MPa, the minimum miscibility pressure of injected gas and crude oil was measured at 50.13 MPa, which was much higher than the initial formation pressure of 33.21 MPa. Under the original formation conditions, injecting gas at the top may start an immiscible gas flooding mode.
Table 2. The result of gas injection expansion experiment |
| Volume of injected gas/% | Gas-oil ratio/ (m3·m-3) | Saturation pressure/MPa | Volume factor | Expansion coefficient | Density/ (g·cm-3) | Viscosity/ (mPa·s) |
|---|---|---|---|---|---|---|
| 0 | 99.29 | 19.27 | 1.238 1 | 1.000 0 | 0.806 4 | 3.686 7 |
| 4.19 | 112.60 | 20.65 | 1.306 5 | 1.023 9 | 0.805 1 | 3.596 2 |
| 11.27 | 133.01 | 22.94 | 1.427 5 | 1.056 0 | 0.803 0 | 3.515 5 |
| 18.11 | 156.03 | 26.09 | 1.516 9 | 1.123 6 | 0.800 4 | 3.459 3 |
| 28.99 | 201.93 | 30.97 | 1.623 1 | 1.184 2 | 0.796 1 | 3.353 7 |
| 38.06 | 252.51 | 36.16 | 1.839 7 | 1.277 9 | 0.790 5 | 3.208 8 |
Note: the volume of injected gas refers to the ratio of the amount of substance of injected gas to that of formation crude oil. |
1.1.3. Water sample
Formation water and injection water were prepared according to the water quality report of the water produced from actual wells. The water type was CaCl2-type, the salinity was 251 980 mg/L and the pH value was 5.31. The mass concentrations of Ca2+, Mg2+, Na+, K+ and Sr2+ in the water samples were 19 100, 3650, 70 400 and 1030, 790 mg/L, respectively. And the mass concentrations of Cl-, HCO3- and SO42- were 156 710, 17 and 260 mg/L, respectively.
1.1.4. Experimental cores
The longitudinal physical properties of the study area were quite different. The average permeability at the structural high and low in the study area was 33.0×10⁻³ and 4.5 × 10⁻³ μm2, respectively. In order to approximate the physical properties of the actual reservoir, a long core was made up of samples from the structural high and low according to a harmonic mean method. The length of the sample from the structural low was 45.8 cm, the average porosity was 21.7%, and the average permeability was 4.5×10⁻³ μm2. The length of the sample from the structural high was 43.1 cm, the average porosity was 24.4%, and the average permeability was 33.0×10⁻³ μm2 (Table 3 ). A filter paper was placed between two short samples to reduce the influence of the capillary end effect[12]. Because the filter paper has a strong absorption performance to liquid, it can reduce the saturation of the wetting phase and enhance the capillary connectivity at the ends of the samples.
Table 3. Parameters of experimental core |
| Sampling location | Core No. | Length/ cm | Diameter/ cm | Porosity/ % | Permeability/ 10-3 μm2 |
|---|---|---|---|---|---|
| Structural low | 1(outlet) | 6.944 | 3.836 | 22.41 | 4.30 |
| 2 | 6.411 | 3.805 | 20.12 | 4.25 | |
| 3 | 6.375 | 3.806 | 20.72 | 4.47 | |
| 4 | 7.011 | 3.833 | 20.95 | 3.98 | |
| 5 | 6.400 | 3.808 | 22.29 | 4.69 | |
| 6 | 6.356 | 3.793 | 23.66 | 3.08 | |
| 7(inlet) | 6.273 | 3.795 | 21.81 | 6.69 | |
| Structural high | 8(outlet) | 6.378 | 3.813 | 23.77 | 24.61 |
| 9 | 5.812 | 3.814 | 24.56 | 26.20 | |
| 10 | 6.551 | 3.805 | 22.92 | 31.86 | |
| 11 | 5.251 | 3.816 | 27.45 | 15.39 | |
| 12 | 6.330 | 3.815 | 24.15 | 39.73 | |
| 13 | 6.298 | 3.796 | 23.83 | 13.43 | |
| 14(inlet) | 6.449 | 3.809 | 24.37 | 79.97 |
1.2. Experimental device and process
The proprietary HPHT (high-pressure and high-temperature) long core displacement system could work at the maximum pressure of 100 MPa and the maximum temperature of 150 °C. It was composed of injection pump, intermediate container, long core holder, back pressure regulator, differential pressure meter, temperature control system and gas meter. The inlet of the core sample from the structural low was connected with water, and the inlet of the core sample from the structural high was connected with gas-cap, and oil flows out from the junction between the two core holders (Fig. 1 ). A Ruska automatic displacement pump was used with 0.001 mL/min speed accuracy. The accuracy of the temperature control system was 0.1 °C and that of the gas meter was 0.1 mL.
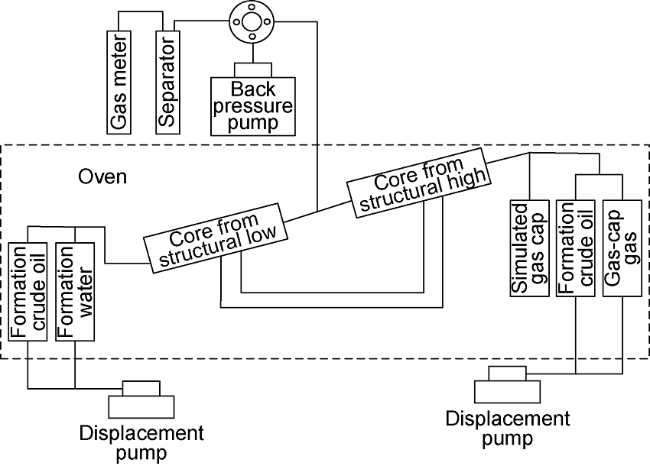
Fig. 1. Long core displacement experiment. |
In order to simulate the production performance of the gas-cap and edge-water reservoir, two core holders were connected in series, and the connection of the two holders was the outlet. The inlet of the core sample from the structural high was connected to an intermediate container with gas-cap gas, while that from the structural low was connected to an intermediate container with formation water. The container volume was determined by the gas cap index (1.63) and the pore volume of water. The dip angle of the core was 2.7°, consistent with the formation dip.
1.3. Experimental scheme and procedures
1.3.1. Experimental scheme
Eight long core (two core samples in series) displacement schemes were performed under different development methods (water flooding, gas-water synergistic displacement) and injection parameters (injection timing and flow rate) for future development of the study area (Table 4 ). Schemes 1-4 were water flooding experiments, which simulated the development mode of edge water injection + middle oil production. Schemes 5-8 were gas-water synergistic displacement experiments, which simulated the development mode of edge water injection + top gas injection + middle oil production.
Table 4. Long core physical simulation experiment schemes |
| Water flooding experiment | Gas-water synergistic displacement experiment | |||||
|---|---|---|---|---|---|---|
| Experimental scheme | Water injection timing/MPa | Water injection rate/ (mL·min-1) | Experimental scheme | Injection timing/ MPa | Water injection rate/ (mL·min-1) | Gas injection rate/ (mL·min-1) |
| 33.21 | 0.125 0 | 33.21 | 0.125 0 | 0.125 0 | ||
| 28.00 | 0.125 0 | 28.00 | 0.125 0 | 0.125 0 | ||
| 15.00 | 0.125 0 | 15.00 | 0.125 0 | 0.125 0 | ||
| 28.00 | 0.062 5 | 28.00 | 0.062 5 | 0.062 5 | ||
1.3.2. Experimental steps
(1) Soak the core in degassed oil for 28 d, put it into the long core holder according to the harmonic mean method after cleaning and drying, and then vacuum it. (2) Saturate the core samples from the structural high and low with formation water, and record the saturated water volume. Boost pressure to the original formation pressure of 33.21 MPa, and then raise temperature to the formation temperature of 94 °C after the pressure is stable. (3) Saturate the core samples with formation crude oil, and record the water volume displaced. Subtract the water volume displaced from the water volume saturated to calculate the oil volume saturated in each core sample. When the gas-oil ratio at the outlet is the same as the original gas-oil ratio in the PVT report, the original reservoir has been restored. (4) Start the water flooding experiment. The pressure drop to the target pressure by depletion development first, and then injecting water at a constant rate. Formation water was injected at a constant rate into the inlet of the core sample from the structural low, while the inlet of the core from the structural high was kept connected to the simulated gas cap. The outlet maintains at constant pressure. Stop injecting water until the water cut reaches 100%. (5) Start gas-water synergistic displacement experiment. The pressure drop to the target pressure by depletion first, and then injecting water and gas. Water was injected at a constant rate into the inlet of the core sample from the structural low and gas was injected at a constant rate into the inlet of the core sample from the structural high, until no oil is produced. (6) Use petroleum ether to clean the cores until the petroleum ether flow from the outlet was transparent, and measure the residual oil volume in each core. (7) It was difficult to estimate the displacement efficiency from each sample during the experiment, but the final displacement efficiency could be estimated according to the saturated oil volume, residual oil volume and original crude oil volume coefficient of each sample.
2. Comparative analysis of experimental results
2.1. Influence of injection timing and injection rate of edge water drive on displacement efficiency
2.1.1. Influence of injection timing
For schemes 1, 2 and 3, the injection pressures were 33.21, 28.00 and 15.00 MPa, and the final displacement efficiencies by water flooding were 27.36%, 33.56% and 36.89% respectively (Fig. 2 ). The displacement efficiency of both the structural high and low samples increased with the decrease of injection pressure (Fig. 3 ). Due to the elastic expansion of formation crude oil and the continuous release of gas cap energy, the oil displacement efficiency of the structural high core increased. When the injection pressures were 33.21, 28.00 and 15.00 MPa, respectively, the displacement efficiencies were 8.57%, 15.10% and 18.64%, respectively. Water injection development was mainly effective to displace the crude oil in the structural low core. When edge water was injected into structural low part, it supplemented energy to the formation, while the outlet pressure was additional resistance to the structural high core, and negative to the displacement efficiency. When injection pressures were 33.21, 28.00, and 15.00 MPa, the displacement efficiencies of the structural low core were 46.54%, 51.83% and 55.45%, respectively. The structural low core makes a great contribution to the total displacement efficiency.
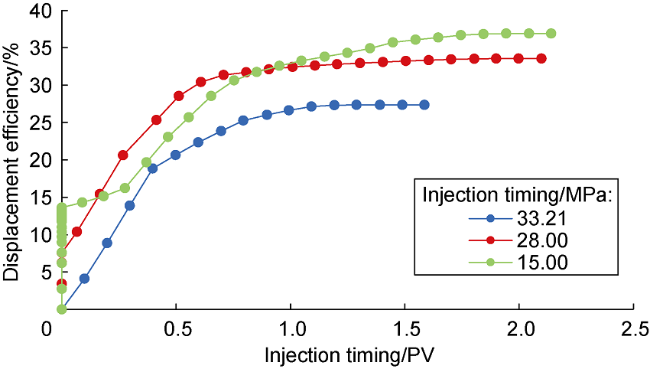
Fig. 2. Displacement efficiency at different injection timings from water flooding experiment (PV—pore volume multiple). |
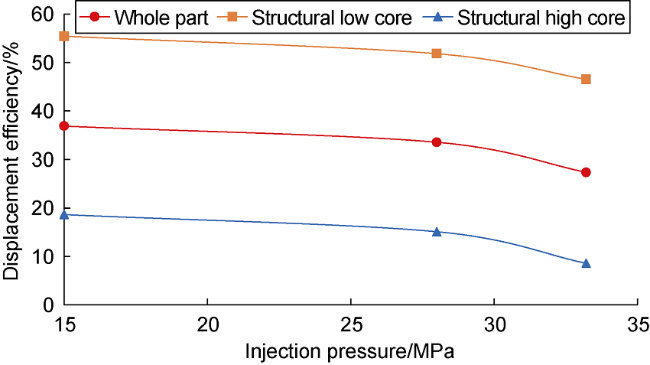
Fig. 3. Displacement efficiency of structural high and structural low cores at different injection timings from water flooding experiment. |
Water breakthrough volume and displacement pressure difference changed greatly with injection timing. At 33.20 MPa and 15.00 MPa, the water breakthrough volume was 0.37 and 0.47 PV, respectively, and the maximum displacement pressure difference was 1.20 and 4.32 MPa, respectively (Fig. 4 ). It was considered that when injection timing was late, the gas cap expands more fully, which not only increased the producing degree of the structural high core, but also delayed the overall water breakthrough and increased the displacement efficiency. At the same time, the later the injection timing, the larger the additional resistance to the crude oil flow in the high part and the viscosity of crude oil after degassing are. While increasing the pressure difference in the low part could make water easy to enter small pores and improve displacement efficiency. However, when the injection pressure was lower than the saturation pressure, there coexisted oil, gas and water after degassing, which reduced the oil-phase flowing capacity and the water flooding efficiency. The results of the three groups of experiments have proved that it is effective to develop for the edge-water and gas-cap reservoir by first making full use of the expansion of the gas cap and then injecting water.
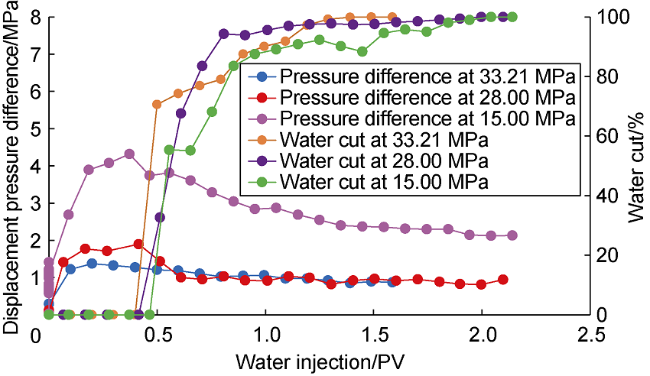
Fig. 4. Relationship between water injection and pressure difference and water cut from water flooding at different injection timings. |
2.1.2. Influence of injection rate
For Scheme 2 and Scheme 4 , when the injection pressure was kept at 28 MPa, and the injection rate increased from 0.062 5 mL/min to 0.125 0 mL/min, the displacement efficiency decreased from 37.54% to 33.56%, so the displacement efficiency decreased with the increase of injection rate (Fig. 5 ). With the increase of injection rate, the displacement efficiency of the cores from low and high parts decreased to varying degrees. In particular, the displacement efficiency of the structural low core decreased significantly, by nearly 8 percentage points from 59.82% to 51.83% (Fig. 6 ). The analysis showed that with the increase of injection rate, although the increase of pressure difference improved the displacement efficiency, when the injection rate increased from 0.062 5 mL/min to 0.125 0 mL/min, water breakthrough advanced from 0.46 PV of water injection to 0.41 PV, which is the primary cause for the reduction of displacement efficiency (Fig. 7 ).
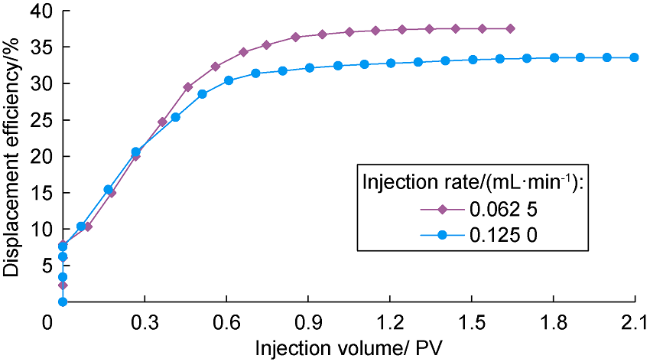
Fig. 5. Displacement efficiency at different injection rates in water flooding experiment. |
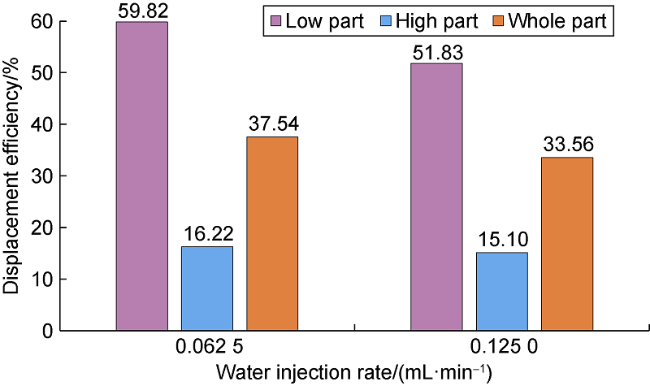
Fig. 6. Displacement efficiency at different injection rates from different parts in water flooding experiment. |
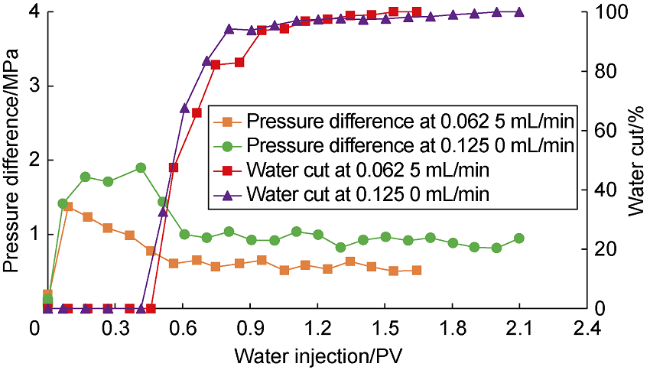
Fig. 7. Relationship between water injection and displacement pressure difference and water cut in water flooding experiment at different injection rates. |
2.2. Influences of injection timing and injection rate on displacement efficiency of gas-water synergistic displacement
2.2.1. Influence of injection timing
After analyzing the experimental results of schemes 5, 6 and 7, the injection timing greatly impacted the overall displacement efficiency and made the displacement efficiency of different parts different. When injection timing was at 33.21, 28.00, and 15.00 MPa, the corresponding total displacement efficiencies were 41.29%, 37.77% and 37.11%, respectively (Fig. 8 ). The displacement efficiency of the core from structural high decreased from 37.29% to 20.39%, and that of the core from structural low increased from 45.74% to 55.12% (Fig. 9 ). The analysis showed that the mechanism of gas-water synergistic displacement differed from conventional gas flooding. According to the results of gas injection and expansion experiment (Table 2 ), it was generally considered that the higher the gas injection pressure, the greater the degree of crude oil expansion and viscosity reduction, and the better the displacement effect. However, during gas-water synergistic displacement, with the decrease of gas injection pressure, the displacement efficiency of the high part decreased by gas flooding while the displacement efficiency of the low part increased by water flooding. The two effects would affect the overall displacement efficiency (Fig. 9 ). When the injection pressure was lower than the saturation pressure, degassing of crude oil and the coexistence of gas, oil and water affect the overall displacement efficiency (Fig. 10 ). Compared with the structural low core, the structural high core had better physical properties, so fluid was easy to produce, restricting the fluid flow in the core from low part. The greater the injection pressure was, the more obvious the restriction effect was, showing a trend that the displacement efficiency increased with the decrease of pressure. In general, considering the adverse factor as multiphase flow after degassing, it is suggested that the injection pressure for gas-water synergistic displacement should be kept above the saturation pressure.
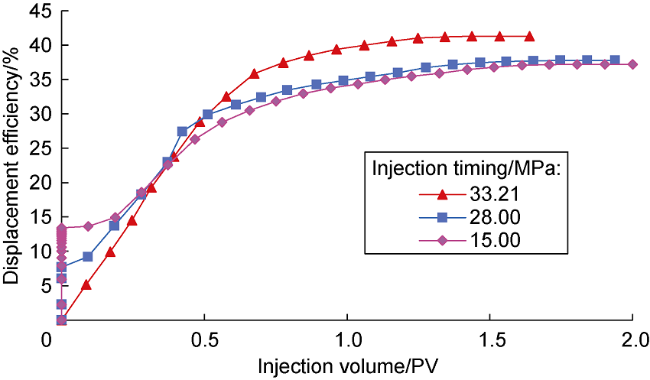
Fig. 8. Displacement efficiency at different injection timings in gas-water synergistic displacement experiment. |
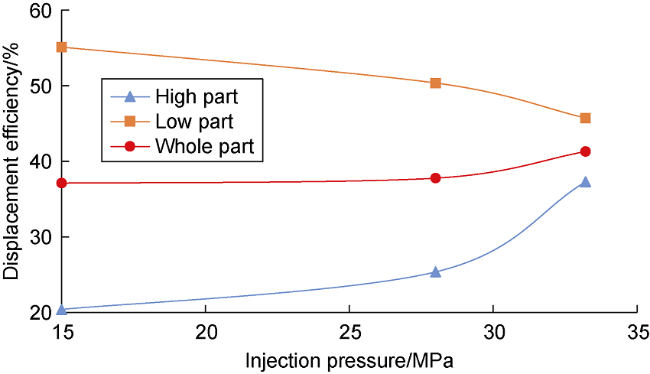
Fig. 9. Displacement efficiency of different parts at different injection timings in gas-water displacement flooding experiment |
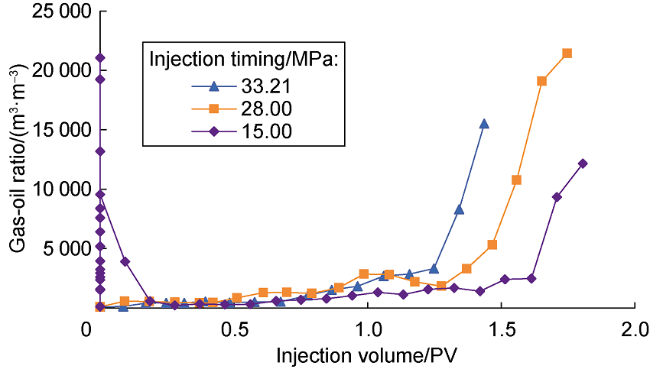
Fig. 10. Relationship between water injection and gas-oil ratio at different injection timings in gas-water synergistic displacement experiment. |
2.2.2. Influence of injection rate
Water and gas injection rates were the same during the experiment. The experimental results of Scheme 6 and Scheme 8 showed that the displacement efficiencies of the low part, high part, and whole parts improved as the injection rate decreased. When the injection rate decreased from 0.125 0 mL/min to 0.062 5 mL/min, the displacement efficiency of the whole part increased from 37.77% to 42.65%, the displacement efficiency of the low part increased from 50.37% to 59.22%, while the displacement efficiency of the high part increased from 25.36% to 28.05% (Fig. 11 ). The analysis showed that the lower the injection rate, the longer the contact time between injected gas and crude oil. This observation could be attributed to interphase mass transfer and oil recovery. In the late stage of gas flooding, due to the high degree of crude oil recovery in the early stage at low injection rate, the produced oil in the late stage decreased and the recovered gas increased, resulting in a fast increase in gas-oil ratio (Fig. 12 ). When the injection rate increased from 0.062 5 mL/min to 0.125 0 mL/min, the maximum pressure difference increased from 3.22 MPa to 6.63 MPa, the injected volume at water breakthrough reduced from 0.46 PV to 0.42 PV. After the water breakthrough, the water cut increased faster, and the water displacement effect became worse (Fig. 13 ).
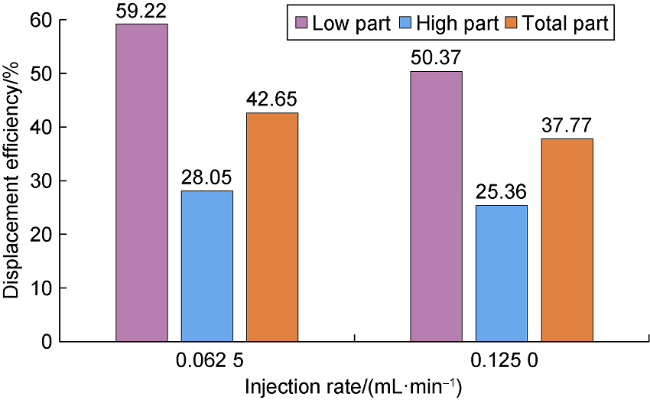
Fig. 11. Displacement efficiency of different parts during gas-water synergistic displacement experiment. |
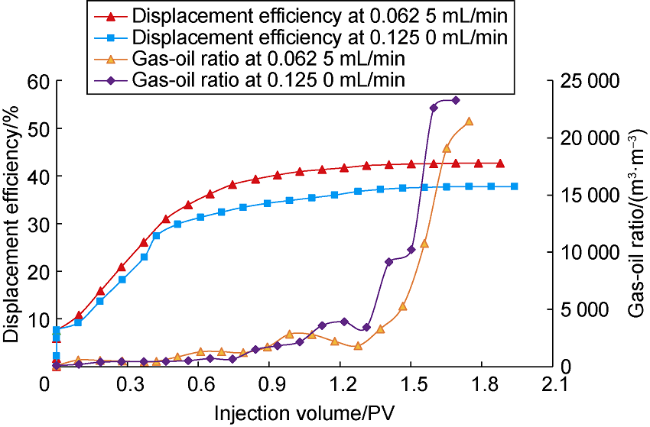
Fig. 12. Relationship between injection volume and displacement efficiency and gas-oil ratio at different injection rates during gas-water synergistic displacement experiment. |
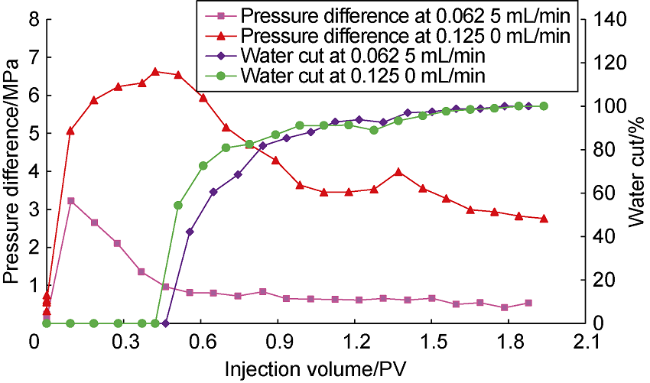
Fig. 13. Relationship between injection volume and pressure difference and water cut at different injection rates during gas-water synergistic displacement experiment. |
2.3. Sensitivity analysis of injection timing and injection rate
The experiment results showed that the injection rate and timing significantly impact the displacement efficiency of the edge-water and gas-cap reservoir. In order to confirm whether there were reasonable injection timing and injection rate, a thin tube experimental model was built to carry out physical simulation with parameters consistent with the core displacement experiment. By fitting the phase behavior and the core experiment, the influencing law of injection rate and injection timing on the edge-water and gas-cap reservoir displacement efficiency was further demonstrated.
2.3.1. Sensitivity analysis of injection timing
The injection rate was set to be 0.125 mL/min, and the displacement efficiencies at 7 different injection timings were calculated for water flooding and gas-water synergistic displacement. During water flooding, when injecting water at 25 MPa, the oil displacement effect of gas cap expansion appeared. The displacement efficiency gradually increased and then became stable. When the injection pressure was lower than the saturation pressure (19.03 MPa), degassing process started and the oil viscosity increased, and multiphase flow occurred and restricted the flow of crude oil, resulting in decreasing displacement efficiency during water flooding (Fig. 14 ). During gas-water synergistic displacement, the gas injection pressure decreased with the delay of injection, and the displacement efficiency of the high part decreased, resulting in a decrease in the total displacement efficiency. With further decrease of the injection pressure, the displacement efficiency of the low part increased, making the total displacement efficiency gradually increased and then tended to be stable. When the injection pressure was lower than the saturation pressure, the displacement efficiency of gas-water synergistic displacement decreased (Fig. 14 ). In conclusion, the reasonable injection timing for water flooding and gas-water synergistic displacement for the Khasib edge-water and gas- cap reservoir was 20-25 MPa.
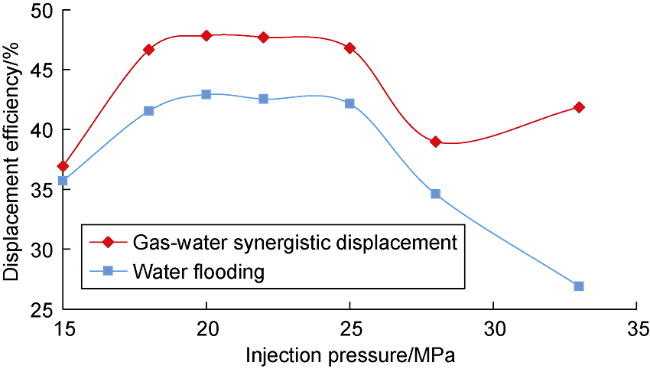
Fig. 14. Analysis results of injection timing sensitivity of water flooding and gas-water synergistic displacement. |
2.3.2. Sensitivity analysis of injection rate
The injection timing was set at 28 MPa, and the displacement efficiencies at 6 different injection rates were calculated for water flooding and gas-water synergistic displacement. During gas-water synergistic displacement, the water injection speed was consistent with gas injection rate. When the gas injection rate was greater than 0.1 mL/min, the displacement efficiency gradually decreased with the increase of the injection rate, and the displacement efficiency was stable at about 43% when injection rate was less than 0.1 mL/min (Fig. 15 ). Gravity number was used to evaluate the relative effect of gravity and viscous force during gas flooding[26⇓-28]. The calculation results of gravity number at different gas injection rates showed (Fig. 16 ) that with the decrease of the gas injection rate, the viscous force decreased and the gravity number increased, indicating that gravity was more influencing in stabilizing OGC and enhancing displacement efficiency[29⇓-31]. Considering the vertical difference of reservoir physical properties, in order to obtain the best displacement effect, the breakthrough time of gas and water should be consistent, so the gas injection rate was set to be 0.10 mL/min. The displacement efficiencies at different injection rates were calculated (Fig. 17 ). Because of the poor physical properties of the structural low core, if the water injection rate was kept the same as the gas injection, gas sould break through before water, and restrict oil flow in the low part. It was found that when the water injection rate increased to 0.15 mL/min, that is, 1.5 times the gas injection rate, gas and oil would break through the outlet at the same time, and the displacement efficiency reached the maximum of 46.58%. In order to further demonstrate the rationality of injection rate and production rate, the water injection rate was kept at 0.15 mL/min and the gas injection rate at 0.1 mL/min, and the displacement efficiencies were calculated at different injection-production ratios (Fig. 18 ). When the injection-production ratio was 1.0∶1.2, the displacement efficiency reached the maximum 47.15%, and the corresponding oil production rate was 0.3 mL/min. So appropriately increasing oil production rate was helpful to oil recovery.
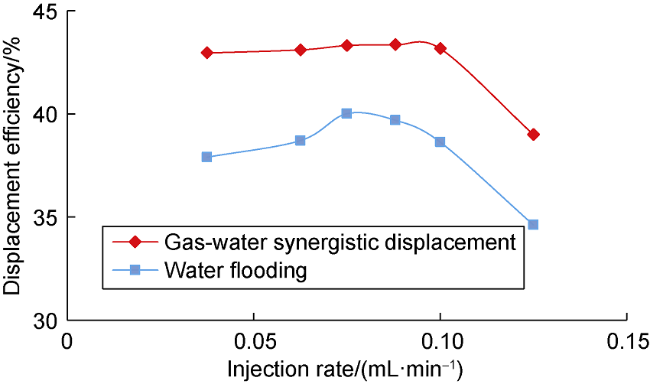
Fig. 15. Sensitivity analysis of injection rate during water flooding and gas-water synergistic displacement. |
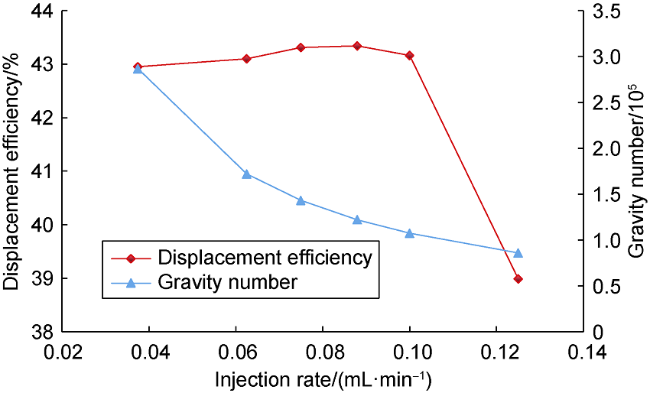
Fig. 16. Gravity number and displacement efficiency at different injection rates during gas-water synergistic displacement. |
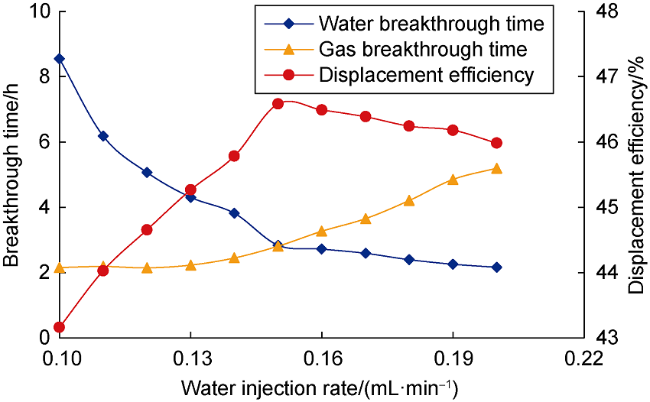
Fig. 17. Sensitivity analysis of water injection rate during gas-water synergistic displacement. |
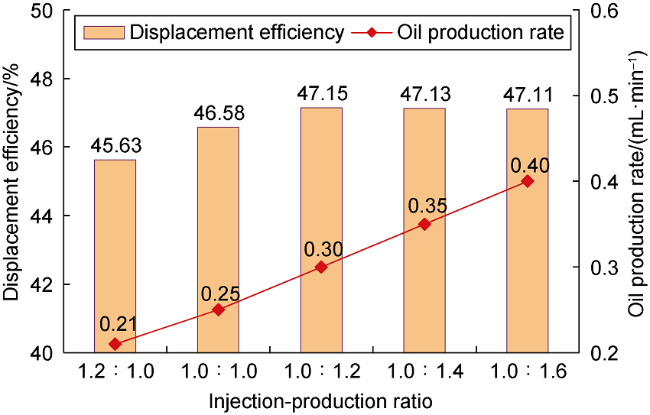
Fig. 18. Relationship between injection-production ratio, oil production rate and displacement efficiency during gas-water synergistic displacement. |
The displacement efficiency of water flooding reached the maximum 40.01% when the injection rate was 0.075 mL/min (Fig. 15 ). The displacement efficiency decreased to different degrees when the injection rate deviated from this rate. Too high water injection rate made early water breakthroughs and water cuts increased rapidly, decreasing displacement efficiency. In contrast, too low water injection rate made pressure difference decrease and water difficult to enter small pores, resulting in slightly decreasing displacement efficiency.
2.4. Optimal development mode of Khasib Formation reservoir
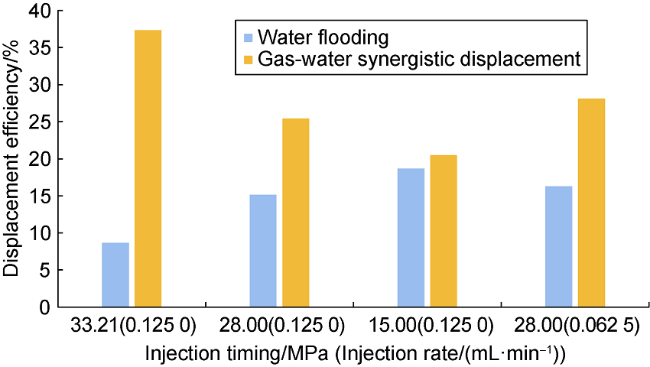
Gas-water synergistic displacement development is better displacement efficiency than water flooding development for Khasib edge-water and gas-cap reservoir. When the injection pressure is higher than the saturation pressure, the displacement efficiency of gas-water synergistic displacement is 5.0-14.8 percentage points higher than that of water flooding at the same injection rate (Figs. 14 and 15 ). The difference in displacement efficiency between water flooding and gas-water synergistic displacement is mainly attributed to the oil produced from the structural high, and the maximum difference is 28.72% (Figs. 19 and 20 ). Therefore, for gas-cap and edge-water reservoirs similar to the Khasib reservoir, it is recommended to adopt the gas-water synergistic displacement method. It can form a three-dimensional displacement effect shown as "upper pressure and lower pushing" in the reservoir, making crude oil fully recovered from different parts.
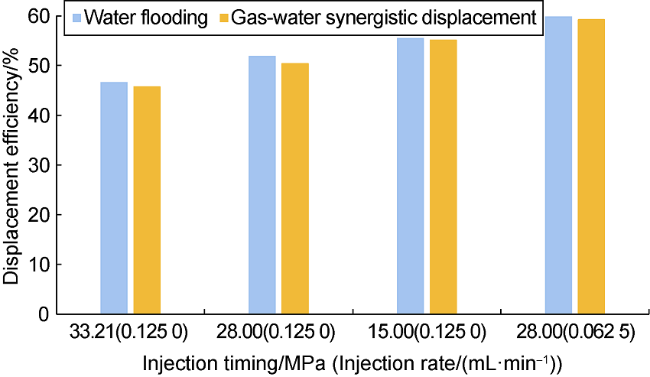
Fig. 19. Comparison of displacement efficiency of different displacement methods for the low part. |
Fig. 20. Comparison of displacement efficiency of different displacement methods for the high part. |
3. Conclusions
To develop the gas-cap and edge-water reservoir in the Khasib Formation by "water flooding in the edge + oil production in the middle", depletion development in the early stage is helpful to utilizing the energy of the gas cap to produce crude oil in the high parts. The experimental results show that the reasonable injection timing of water flooding is 20-25 MPa, the reasonable water injection rate is 0.075 mL/min, and the maximum displacement efficiency is 40.01%.
To develop the reservoir by "gas-water synergistic displacement + oil production in the middle," the displacement effect on different parts should be considered comprehensively. The experimental results show that the reasonable injection timing of gas-water synergistic displacement is 20-25 MPa, the maximum displacement efficiency is 47.15% at 0.15 mL/min of water injection rate and 0.10 mL/min of gas injection rate.
The development method of "gas-water synergistic displacement + oil production in the middle" can fully mobilize the crude oil in high parts, and the displacement efficiency is 5.0-14.8 percentage points higher than the development mode of "water flooding in the edge + oil production in the middle."
Due to the difference between one-dimensional linear seepage and real radial seepage flow field from injection wells to production wells, the reasonable injection and production rates calculated in this paper cannot be directly used for actual reservoir conditions. However, based on similarity theory, they can be converted into useful injection and production parameters according to the actual reservoir parameters such as thickness and pressure.