

Introduction
Since the "Twelfth Five-Year Plan", China has carried out a lot of scientific and technological research on shale gas development and made significant breakthroughs [1-2], prompting the shale gas output to exceed 200×108 m3 in 2020, making China the second largest shale gas commercial development country in the world[3]. At present, the increase of shale gas reserves and production in China mainly depends on the Ordovician Wufeng Formation to the Silurian Longmaxi Formation, which are 3500 m or shallower, in Fuling and Weiyuan areas in the Sichuan Basin, SW China, and its surrounding area. Although the shale gas geological resources of the Wufeng Formation to the Longmaxi Formation in the Sichuan Basin are as high as 21.9×10¹² m3, 51% of them are deep shale gas with a buried depth of 3500-4500 m. Among the 10×1012 m3 resources proved in the south of the Sichuan Basin (referred to as southern Sichuan), the proportion of deep shale gas is as high as 87% [4]. In foreign countries, the major shale gas producing countries represented by the United States have made important progress in five deep shale gas areas with an average burial depth of 3600-4648 m, including Eagle Ford, Haynesville, Cana Woodford, Hilliard Baxter Mancos and Uinta Mancos [5-6]. Deep shale gas is a real field for increasing reserves and production in the future[7].
Although deep shale reservoirs in China are thick and have a wide gas-bearing area, the proven rate of resources is still extremely low [8]. This is because that there are more complicated factors related to geology, engineering and geophysics, which influence the development of deep shale gas reservoirs. Geologically, the stronger the compaction is, the lower the porosity and permeability are, and the more complicated the sedimentary environment and fracture distribution are. In engineering, the greater the in-situ stress and rock strength are, the weaker the brittleness is, and the more complicated the grind ability, drillability and fracturability of the reservoir are. In geophysics, with the increase of depth, the frequency band of seismic wave narrows, and the dominant frequency and resolution decrease. This inevitably affects the prediction accuracy of favorable reservoir parameters such as micro-fractures, anisotropy, TOC, gas content and brittleness, and is not conducive to fine target evaluation and optimization from plane to section. Driven by these complex factors, how to predict favorable deep shale reservoirs has become a research hotspot in such fields as geology, engineering and geophysics.
Favorable deep shale reservoirs refer to the shale reservoirs with high TOC and gas content, large-scale effective reformed volume, high recoverable reserves, excellent geological and engineering conditions, and the greatest potential for commercial development [9]. And it is also a prediction difficult point to be solved urgently in the geophysical field. At present, to meet the requirements of selecting favorable shale reservoir zones, favorable pays and favorable intervals, and field engineering support, a series of advanced technologies such as "2W1H" (wide frequency band, wide azimuth, high density) seismic data acquisition, and "3P3H" (preserving AVO, bandwidth and anisotropy, high signal-to-noise ratio, high resolution and high fidelity) seismic data processing and structural interpretation were developed [10], and based on which several methods were proposed, including formation pore fluid pressure prediction [11], anisotropy inversion [12-13], TOC calculation [14], VTI (transverse isotropy with a vertical axis of symmetry) medium brittleness index calculation [15]. These methods can be used to obtain various favorable reservoir parameters, and provide an important basis for predicting reservoir geological characteristics, fracture network expansion capacity, stimulation potential and recovery factor [16⇓⇓-19]. However, influenced by complicated factors in geology and engineering, the prediction parameters of favorable deep shale reservoirs are numerous and redundant information is complex, and the traditional manual interpretation has problems such as strong subjectivity and low efficiency, which makes it difficult to break through the bottleneck of high precision and high efficiency. It is urgent to explore new solutions and further improve the prediction methods of favorable deep shale reservoirs [20-21].
In recent years, with the rapid development of artificial intelligence technology, machine learning has been widely used in the field of earth science, and favorable reservoir prediction methods show a new trend of interdisciplinary integration of geology, engineering, geophysics and machine learning. Semi-supervised fuzzy C-means machine learning method has been used to analyze various seismic attributes and predict favorable sedimentary facies [22]; convolution neural network (CNN) has been used to calculate petrophysical parameters [23] and fracture grading evaluation [24]; support vector regression and long-term and short-term memory network have been used to predict porosity, permeability and other parameters [25-26]; and reservoir velocity, density and other parameters can be inversed by combining semi-supervised learning with CNN [27-28]; and reservoir TOC can be predicted by support vector machine and CNN [29-30]. However, these machine learning methods can only realize the prediction of single or few favorable reservoir parameters, but can’t run high-dimensional big data analysis, nonlinear feature extraction, multi-parameter intelligent prediction and comprehensive evaluation, which is not conducive to target optimization, reservoir reconstruction and enhanced oil recovery.
This paper proposes three methods including parameter correlation analysis principle, CNN intelligent prediction method, and integrated and fused characterization based on the nonlinear dimensionality reduction principle of kernel principal component analysis (KPCA), and follows five steps, namely analyzing high-dimensional correlations among favorable reservoir parameters based on Pearson coefficient, selecting favorable reservoir characteristics and analyzing response laws from KPCA logging data, training CNN reservoir model, predicting CNN favorable reservoir parameters, integrated and fused characterization and evaluation of KPCA favorable reservoir parameters, to realize the prediction of favorable deep shale reservoirs based on machine learning. Then various data of core, logging, seismic and gas production are used in practical application to test the prediction accuracy of the method based on machine learning and to explore any intelligent method for exploration and development of deep shale gas in China. Finally, the typical application case of the Weirong shale gas field in the Sichuan Basin proves that this method can provide effective technical support for the exploration and development of deep shale gas.
1. Methods, principles and implementation steps
1.1. Principles and methods of parameter analysis of deep shale reservoirs
1.1.1. Principle of parameter correlation feature analysis
Through core testing and logging interpretation, we can get deep shale reservoir parameters including P-wave velocity (vp), S-wave velocity (vs), density (ρ), porosity (ϕ), organic carbon content (TOC), gas content (Qg), brittle mineral content (Cbri), pore pressure (p), maximum horizontal stress (σmax) and minimum horizontal stress (σmin). Although, the more parameters, the more favorable to get the reservoir response characteristics, at the same time, the data analysis is more complicated and extraction of high-dimensional data features is more difficult. Using Pearson correlation coefficient and thermal diagram to quantitatively analyze the correlation between core and logging parameters can solve the problem of describing high-dimensional correlation characteristics between favorable reservoir parameters under multi-parameter conditions.
Pearson correlation coefficient is based on statistics, which is often used to reduce the dimensionality of high-dimensional data and describe the correlation (or independence) between data. Assuming that any two groups of core or logging parameters are respectively x and y after normalization, the Pearson correlation coefficient c can be calculated by using its covariance e and standard deviation s [31], namely:
$ c(x, y)=\frac{e(X, y)}{S(x) S(y)}$
c∈[-1,1], reflecting the correlation between x and y. When c=-1, x is negatively correlated with y. When c = 1, x is positively correlated with y. When c = 0, x and y are completely independent. In other words, when c is closer to 1 or -1, the similarity of features between x and y is higher; otherwise, it is lower. A Pearson correlation coefficient matrix can be constructed by using c, and filled with different colors according to the size of c. A Pearson correlation coefficient thermal map is established, which visualizes the correlation characteristics between x and y.
1.1.2. Intelligent prediction method based on CNN
Deep shale reservoirs are influenced by complex geological, engineering and geophysical factors, and lots of parameters can be obtained for favorable reservoir prediction, but conventional methods are difficult to effectively eliminate redundant information with some problems such as strong subjectivity, low efficiency and low accuracy. The CNN-based deep learning method adopts mechanisms such as parameter sharing and sparse connection. Compared with machine learning methods for shallow reservoir prediction, such as support vector machine (SVM) and random forest, the CNN-based deep learning method considering nonlinear factors has significant advantages in high-dimensional data processing, complex feature mapping and automatic extraction of the feature map. It can solve problems related to the prediction of favorable deep shale reservoirs. As the most representative and widely used deep learning method, CNN has deep network structures composed of convolution layer, pool layer, activation layer, full connection layer and normalization layer, etc., and strong feature learning ability. Aiming at the prediction of favorable deep shale reservoirs, a CNN network framework is designed based on logging and seismic data. Among them, the input layer is composed of several data input neurons, which are mainly used for logging, seismic and other multidimensional data input. The convolution layer is the key link to determining prediction accuracy, which is composed of the most basic convolution operation units of CNN. Through the convolution kernel, the convolution operation between the receptive field area of the input layer and the weight matrix of the convolution kernel is completed, as well as the extraction of local and global feature maps and feature mapping of the input layer. The activation layer is composed of Sigmoid, ReLU, Tanh and other types of activation functions [32]. Because there are nonlinear relationships between logging, seismic and other input data and the parameters to be predicted, the activation functions can be used to strengthen CNN's nonlinear feature learning ability, and quickly realize the mapping and nonlinear fitting of complex data while suppressing gradient disappearance. The pool layer plays the role of data compression, feature dimensionality reduction, prevention of over-fitting, etc. Although the features of favorable reservoir parameters are extracted after convolution operation on logging and seismic data, the feature dimensions are relatively high with similarities. Therefore, the linear or nonlinear pool function of the pool layer should be used for substitution and down-sampling processing, to filter redundant information and reduce feature dimensions, and realize high-level abstract feature description. The full connection layer is composed of many neurons which are all connected with the neurons in the upper layer. It mainly plays the role of feature mapping and comprehensive classification, realizing the mapping of input data to feature types one by one and spreading them to the output layer.
In a word, the key to realizing favorable deep shale reservoir prediction based on CNN mainly includes three core links: deep learning network design, favorable reservoir model training and parameter prediction. Training a favorable reservoir model is evaluated by loss function and decision coefficient as criteria, and realized by the backpropagation algorithm [33]. The advantage of the loss function is that the function curve is continuous and smooth, and derivable everywhere. With the decrease of the loss function, the gradient will decrease, which is conducive to the convergence of the model (see Reference [33] for detailed model training methods). Through the back-propagation algorithm, the weight of the convolution layer and the loss function of back-propagation are modified layer by layer in continuous iteration by CNN, and finally stop iteration until the loss function is the smallest, and obtain the prediction data with the highest accuracy.
1.1.3. Integrated and fused characterization based on nonlinear dimensionality reduction principle of KPCA
KPCA is the extension of principal component analysis (PCA). PCA is a linear dimensionality reduction method based on multivariate statistical analysis. It simplifies complex data by the linear transformation, covariance matrix and matrix diagonalization to mine the most important characteristics of high-dimensional data. PCA is suitable for noise suppression, redundant information elimination, data compression and other processing, but it’s a linear dimensionality reduction method not suitable for nonlinear data analysis. KPCA overcomes the defects of PCA. By mapping the original sample space into the high-dimensional feature space, kernel functions such as polynomial and radial basis function (RBF) are used for feature recognition in the high-dimensional space, and then PCA is used to realize the nonlinear dimensionality reduction of the data, thus effectively avoiding the curse of dimensionality, simplifying the data and making it easy to use.
m groups of high-dimensional data $z_{j}={z_{ij}}$ are constructed by using core, logging or seismic data with n samples per group. Setτ(zj) as the mapping matrix of zj in the feature space, and its covariance is:
$ \psi=\frac{1}{m} \sum_{j=1}^{m} \tau\left(Z_{j}\right) \tau\left(Z_{j}\right)^{\mathrm{T}}$
To reduce the dimension, ψ needs to be diagonalized to minimize the value on the nondiagonal line. In this way, the redundant information in zj can be eliminated by only taking the dimension with a large eigenvalue on the diagonal line. Since the diagonalization of ψ is difficult, KPCA introduces a Gaussian kernel function k for nonlinear dimensionality reduction. The zj -related Gaussian kernel matrix K(zj) is constructed by k, and there is a relationship between the eigenvalues and eigenvectors [34], that is:
$λ_{j}V_{j}=K(Z_{j})V_{J}$
Diagonalize K(zj), solve λ and V, and reorder according to the relationship from large to small. When the sum of the first b eigenvalues and the sum of all eigenvalues meet the following conditions:
$ \ell=\left(\sum_{a=1}^{b} \lambda_{a} / \sum_{j=1}^{m} \lambda_{j}\right) \geq 80 \%$
The kernel principal component of zj is:
$ \boldsymbol{Z}=\sum_{j=1}^{m} \boldsymbol{V}_{j} \boldsymbol{K}\left(\boldsymbol{Z}_{j}\right)$
According to actual needs, different thresholds of $\ell$ can be set so that Z retains sufficient zj characteristics.
In the process of predicting favorable deep shale reservoirs, there are many complex parameters such as ϕ, TOC and Qg, which increase the difficulty of distinguishing geological, engineering and geophysical characteristics. Based on the nonlinear dimensionality reduction algorithm of KPCA, the features that are difficult to describe in the low-dimensional space are represented in the high-dimensional feature space by nonlinear mapping. After the redundant information is eliminated based on the correlation difference among parameters, the kernel principal component with the strongest correlation is used to replace the original high-dimensional feature information. This provides integrated and fused characterization data for the prediction of favorable deep shale reservoirs.
1.2. Prediction steps of favorable deep shale reservoirs based on machine learning
Combining multi-disciplinary knowledge such as geology, geophysics and machine learning, and following three methods such as the principle of parameter correlation characteristic analysis, CNN-based intelligent prediction method and nonlinear dimensionality reduction principle of KPCA, favorable deep shale reservoirs can be predicted based on machine learning, which mainly includes key links such as favorable reservoir characteristic identification, parameter prediction, and multi-parameter integrated evaluation. In practical application, the above three procedures are decomposed into five steps: (1) Calculate Pearson correlation coefficient matrix and construct Pearson correlation coefficient heat map by using core and logging data, and analyze the high-dimensional correlation characteristics of favorable reservoir parameters under multi-parameter conditions. (2) Combined with the core test data, KPCA is used to extract favorable reservoir characteristics from various logging data and analyze the main response laws. (3) Based on CNN deep learning method, train the model similar to the underground reservoir by logging data, and test the reliability of the model by core testing and logging data. (4) Use the model and seismic inversion data to run CNN-based favorable reservoir parameter prediction, which provides basic data for comprehensive evaluation of favorable reservoirs in geology, engineering and geophysics. (5) Based on the nonlinear dimensionality reduction principle of KPCA, carry out the integrated and fused characterization of favorable reservoir parameters to realize the comprehensive evaluation of favorable reservoirs, providing support for the selection of deep shale gas zones, layers and sections.
2. Prediction of favorable deep shale reservoirs in the Weirong shale gas field
2.1. Geological conditions in the Weirong shale gas field
The Weiyuan shale gas field is located in Weiyuan- Rongxian area in the southwest of the Sichuan Basin (Fig. 1 ), where the structures are simple, the Ordovician and Silurian structures are gentle, and there are no large-scale faults. In the area, the interval from the Wufeng Formation of the Upper Ordovician (O3w) to the Longmaxi Formation of the Lower Silurian (S1l) located at the bottom of Baimazhen syncline contains thick organic-rich shale of deep water shelf facies, which is the main production layer in the gas field. O3w includes upper and lower members. The upper member develops gray-black radiolarian carbonaceous graptolite shale, and the lower member develops gray-black to black-gray bioclastic limestone shale. S1l includes three members. The first member of the Longmaxi Formation (S1l1) is mainly composed of gray-black and black carbonaceous graptolite shale and carbonaceous radiolarian graptoliteshale, and is divided into eight sub-layers from S1l11 to S1l18. O3w-S1l1 covering the second member (S2l2) and the third member (S2l3) of Longmaxi Formation, with thick sandy shale and mudstone, are tight and have a strong sealing ability. The underlying Linxiang Formation (O3l) to Baota Formation (O2b) develop thick micritic limestone, nodular limestone and carbonaceous calcareous shale, with good sealing ability.O3w-S1l shale gas belongs to ultra-high pressure deep shale gas. The buried depth of the reservoir is about 3550-3880 m, with an average of 3702 m. It has excellent characteristics of moderate thermal maturity, high TOC, high porosity-permeability, high brittleness, high gas content, micro-fracture development, and so on. The average reservoir porosity is 6.08%, the average horizontal permeability is 0.196 3×10⁻³ μm2, and the average brittle mineral content is 56.07%. The type of organic mainly types I sapropelic kerogen, with an average thermal maturity of 2.26%, an average TOC of 2.28% and an average gas content of 6.17 m3/t. The reservoir space is dominated by pores, followed by micro-fractures such as oblique fractures, horizontal fractures and bedding fractures (Fig. 2 ). The reservoir has high pore pressure, small in-situ stress difference, and great fracturing potential. At present, there are still some problems, such as difficult selection of favorable reservoirs and low evaluation accuracy of fracturability, which are not conducive to horizontal well deployment, reservoir stimulation, increase of single-well production and ultimate recoverable reserves. In particular, it is urgent to improve the prediction method of favorable deep shale reservoirs.
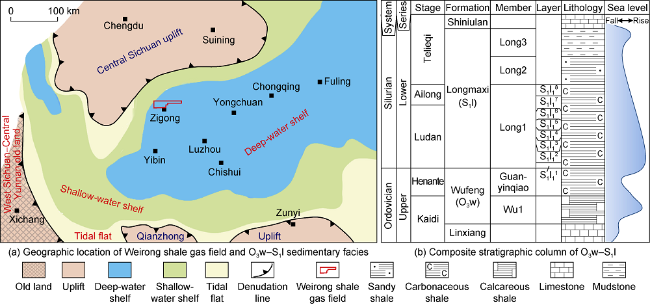
Fig. 1. Geographical location of Weirong shale gas field, Wufeng-Longmaxi formations sedimentary facies and composite stratigraphic column. |
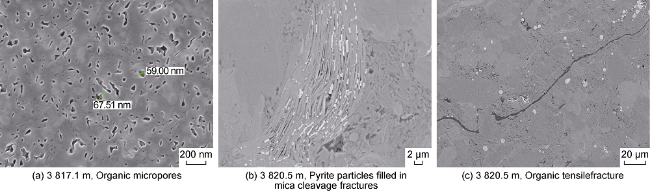
Fig. 2. SEM photographs of O3w-S1l cores taken in Well A in the Weirong shale gas field after argon ion polishing. |
2.2. Prediction of high-quality deep shale reservoirs parameters
For O3w-S1l deep shale gas reservoir, 369.93 m of coring has been carried out, and 201 groups of samples for petrological, geochemical and physical parameters, pore structures and gas bearing properties have been tested and analyzed. At the same time, abundant logging and seismic data such as vp, vs and ρ have been obtained, which laid a foundation for the analysis of favorable reservoir characteristics. By considering the core and logging data, the relationships among ϕ, TOC, Qg, Cbri, p, σmax, σmin and σdhsr of the deep shale reservoirs can be established. Taking Well A as an example, the shale gas flow of 38×104 m3/d was obtained from O3w2-S1l11, and the cores were drilled at 80.53 m. Core test results (Table 1 ) show that the O3w-S1l shale reservoir has extremely low ϕ, relatively high TOC, Qg and Cbri, and relatively low ρ and σdhsr, indicating the quality of the bottom reservoir is better. The logging results of Well A show that vp, vs and ρ are low, ϕ, TOC, Qg, Cbri and p are high, and σmax, σmin and σdhsr are low (Fig. 3 ). In addition, due to the influence of the testing environment, instruments and other factors, the consistency of ρ, TOC, Cbri and p from core data with those from logging data is high, while the differences of ϕ, Qg, σdhsr and other parameters are obvious.
Table 1. Partial statistics of O3w2-S1l18 core test data taken in Well A in the Weirong shale gas field |
| Strata | Depth/m | P/MPa | σmax/MPa | σmin/MPa | σdhsr | Cbri/% | TOC/% | Qg/(m3·t-1) | ρ/(g·cm-3) | ϕ/% |
|---|---|---|---|---|---|---|---|---|---|---|
| S1l18 | 3775.42 | 11.69 | 85.05 | 67.91 | 0.19 | 43 | 0.34 | 2.62 | 1.00 | |
| S1l17 | 3781.80 | 10.99 | 84.72 | 65.78 | 0.22 | 42 | 0.38 | 2.64 | 1.22 | |
| S1l16 | 3792.15 | 12.18 | 83.27 | 66.51 | 0.19 | 43 | 0.94 | 2.61 | 1.10 | |
| S1l15 | 3799.16 | 14.22 | 84.39 | 69.65 | 0.16 | 57 | 1.85 | 2.53 | 1.22 | |
| S1l14 | 3808.67 | 12.81 | 83.48 | 67.75 | 0.18 | 52 | 1.23 | 2.28 | 2.53 | 1.20 |
| S1l13 | 3815.92 | 15.66 | 86.43 | 70.64 | 0.17 | 49 | 2.33 | 3.28 | 2.51 | 9.76 |
| S1l11 | 3841.60 | 14.60 | 86.45 | 68.89 | 0.20 | 63 | 2.31 | 2.70 | 2.54 | 6.93 |
| O3w2 | 3849.50 | 13.53 | 82.62 | 67.58 | 0.17 | 69 | 3.59 | 1.38 | 2.56 | 6.81 |
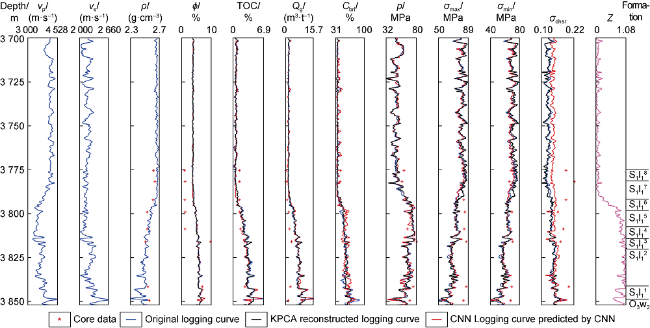
Fig. 3. Core data and logging curves of Well A in the Weirong shale gas field. |
Through Pearson correlation coefficient analysis of core and logging parameters, it is revealed that there is a positive correlation, negative correlation or not close correlation among favorable reservoir parameters. The analysis of the Pearson correlation coefficient based on core data from Well A shows that p is strongly negatively correlated with ρ, strongly positively correlated with ϕ and Qg, and positively correlated with TOC and Cbri. The analysis of the Pearson correlation coefficient based on logging data from Well A shows that p is strongly negatively correlated with vp, negatively correlated with vs and ρ, and strongly positively correlated with ϕ, TOC, Qg and Cbri; and Cbri is closely related to TOC, Qg, ϕ, σmax, σmin, σdhsr and other parameters. The analysis of the Pearson correlation coefficient based on core and logging data from Well A shows that TOC has a strongly positive correlation with ϕ and Cbri. However, the response laws of favorable reservoir parameters from the core data are also inconsistent with those from the logging data. For example, the core data show that p has a strong positive correlation with σmin and a strong negative correlation with σdhsr, but the logging data show that p has a very weak correlation with σmin and σdhsr. In addition, the Pearson correlation coefficient from the logging data shows that TOC is strongly positively correlated with Qg, ϕ and Cbri, and strongly negatively correlated with ρ, but the Pearson correlation coefficient from the core data is not. Such results have something to do with the geological environment, testing methods and instruments. Therefore, through Pearson correlation coefficient analysis of core and logging data, we can not only reveal the correlation characteristics among parameters, but also find redundant information and inconsistencies that need to be further studied.
Pearson correlation coefficient analysis based on core and logging data shows that favorable reservoir parameters are numerous and complex, and the consistency of response characteristics is poor. KPCA nonlinear dimensionality reduction can simplify the description of complex characteristics and realize multi-parameter integrated characterization. As shown in Fig. 3 , by using the nonlinear dimensionality reduction method of KPCA, eight parameters (Well A), including ϕ, TOC, Qg, Cbri, p, σmax, σmin and σdhsr, can be reduced to one KPCA parameter Z. Each parameter (blue curve) can be reconstructed by Z, and its coincidence with the original curve is extremely high, which indicates that Z effectively integrates the main features of various favorable reservoir parameters. From S1l18 to O3w2, the Z curve shows a gradually increasing "box-like" feature, and shows obvious anomalies in the favorable O3w2-S1l12 interval. It can be seen that KPCA nonlinear dimensionality reduction can effectively eliminate redundant information, realize integrated and fused characterization of complex features, and help understand favorable reservoir response laws.
Using core and logging data, we can accurately grasp the distribution law of favorable deep shale reservoirs, but the large-scale spatial prediction of favorable reservoirs depends on seismic data. However, at present, there is no direct method to calculate TOC, Cbri, Qg, p, σmax, σmin, etc., so we can only rely on empirical formulas and regression fitting to calculate indirectly. But it is restricted by factors such as uneven sampling, small numbers and wide distribution of core samples in different zones and intervals, which directly affects the empirical formula and fitting effect, and inevitably leads to the low prediction accuracy of favorable reservoirs.
Based on CNN deep learning method, it can avoid the current calculation methods of favorable reservoir parameters, reduce intermediate calculation links and directly predict favorable reservoir parameters. Using a CNN deep network, vp, vs, ρ are taken as the input layer, and favorable reservoir parameters such as ϕ, TOC, Qg, Cbri can be obtained at the output layer by processing the features of the convolution layer, the activation layer, the pool layer and the full connection layer. In the Weirong shale gas field, vp, vs and ρ of three wells were taken as training samples (about 37 800) in the CNN input layer to train favorable reservoir parameter models such as ϕ, TOC, Qg and Cbri, and then the reliability of the favorable reservoir models and CNN prediction parameters was verified by combining core and logging data. Fig. 3 shows the prediction result (red curve) of favorable reservoir parameters of Well A in the Weirong shale gas field. The favorable reservoir model used was obtained by CNN training from three deep shale gas wells B, C and D in the area. In the O3w2-S1l18 shale reservoir section of Well A, the prediction effect is generally ideal. Especially for the favorable reservoir section of O3w2-S1l12, the CNN-predicted curve and the original curve predicted by the conventional method show the characteristic trend of almost coincidence, and the CNN-predicted curve is more consistent with the core test results. It can be seen that the favorable reservoir model trained by CNN is closer to the geological model revealed by core and logging data, and the prediction accuracy of favorable reservoir parameters is higher.
The favorable reservoir parameter model based on logging data is the basis of seismic prediction. Taking vp, vs and ρ from seismic inversion as CNN input layers, and using the logging model and CNN deep learning method, favorable reservoir parameters such as ϕ, TOC, Qg and Cbri can be accurately predicted. Fig. 4 shows the spatial distribution characteristics of ϕ, TOC, Qg and Cbri predicted by CNN in the Weirong shale gas field. It can be seen that in the favorable reservoir section of O3w2-S1l12 shown in Fig. 4 a-4e, wells A-F are all distributed in zones with higher values. Fig. 4 f and Fig. 4 g show σmax and σmin have high or low values, with no clear law in each well site. Fig. 4 h shows that σdhsr has obvious low-value anomalies. Fig. 4 i and Fig. 4 j show the anomalies of Cbri and σdhsr profiles and characteristics along beddings, revealing that O3w2-S1l12 is the favorable reservoir section. It should be noted that wells B, C and D are model training wells, wells A, E and F are prediction wells, and wells E and F are new wells, whose characteristics are in good agreement with the shale gas open flow (Table 2 ). Among them, the shale gas open flow obtained from Well F is the highest, and the abnormal characteristics of ϕ, TOC, Qg and other parameters are very significant. The shale gas production of wells A, B, C and D is high, and the abnormal distribution areas of Cbri, p, σdhsr and other parameters are wide, which strongly confirms the huge development potential of deep shale gas in O3w2-S1l12.
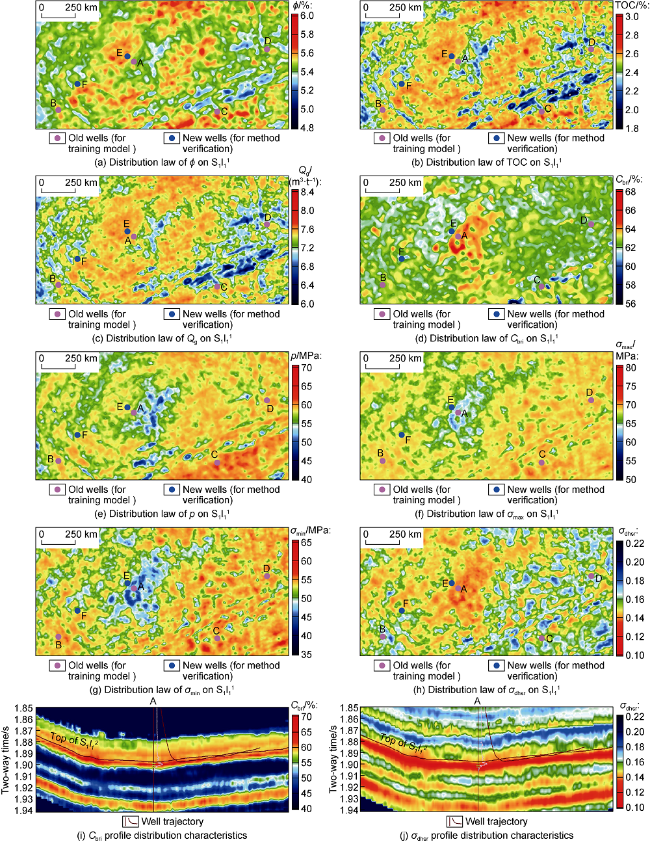
Fig. 4. Spatial distribution of O3w2-S1l12 favorable shale reservoir parameters in the Weirong shale gas field based on CNN prediction. |
Table 2. Statistical comparison between single-well shale gas open flow and favorable reservoir parameters in the Weirong shale gas field (average values of O3w2-S1l12) |
| Well | f/(104 m3•d-1) | ϕ/% | TOC/% | Qg/(m3•t-1) | Cbri/% | p/MPa | σmax/MPa | σmin/MPa | σdhsr |
|---|---|---|---|---|---|---|---|---|---|
| A | 38.0 | 5.55 | 2.56 | 7.61 | 67.9 | 57.9 | 66.7 | 49.3 | 0.19 |
| B | 28.0 | 5.57 | 2.61 | 7.63 | 62.3 | 61.6 | 76.4 | 59.7 | 0.15 |
| C | 18.0 | 5.59 | 2.76 | 7.49 | 63.0 | 68.7 | 79.1 | 65.0 | 0.13 |
| D | 23.0 | 5.55 | 2.58 | 7.46 | 62.6 | 63.3 | 78.9 | 63.7 | 0.15 |
| E | 33.0 | 5.83 | 2.92 | 8.32 | 61.9 | 61.6 | 69.8 | 54.7 | 0.18 |
| F | 42.5 | 5.58 | 2.94 | 8.33 | 62.3 | 61.3 | 69.8 | 54.9 | 0.17 |
For the deep shale reservoir of the Wufeng Formation to the Longmaxi Formation in the Weirong shale gas field, after predicting ϕ, TOC, Qg, Cbri, p, σmax, σmin and σdhsr based on CNN, the correlations between the parameters can be quantitatively analyzed by Pearson correlation coefficient thermal diagram, to effectively reveal the high-dimensional correlation characteristics between shale gas production and favorable reservoir parameters under multi-parameter conditions, and further discover the primary parameters controlling shale gas production. Open flow rate (f) is the key index of shale gas production. Based on the statistics of O3w2-S1l12 parameters and f (Table 2 ), the Pearson correlation coefficient method can be used to calculate the correlation coefficient matrix between open flow rate and favorable reservoir parameters, and establish a heat map to reveal the correlation characteristics, and visually show the correlation between shale gas production and favorable reservoir parameters. Fig. 5 is the heat map of the Pearson correlation coefficient between f and favorable reservoir parameters calculated by using the statistical data shown in Table 2 . As the higher the c, the darker the color of the heat map, and the stronger the correlation, so the correlation from strong to weak is between shale gas production and ϕ, Cbri, TOC, Qg, p, σdhsr, σmin and σmax in order.
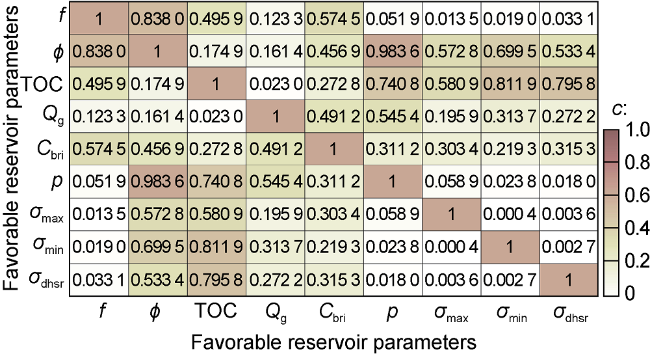
Fig. 5. Correlations between O3w2-S1l12 shale gas open flow and favorable reservoir parameters in 6 wells in the Weirong shale gas field. |
By using the heat map and the Pearson correlation coefficient matrix, the statistical characteristics between f and various parameters can also be obtained, which show the key factors controlling shale gas production more intuitively. Fig. 6 shows the histogram drawn by Pearson correlation coefficients, which intuitively shows the statistical relationship between favorable shale reservoir elements and shale gas production from O3w2-S1l12 in wells A, B, C, D, E and F in the Weirong shale gas field. It is revealed that the main parameters controlling shale gas production from O3w2-S1l12 of the Weirong shale gas field are ϕ, Cbri, TOC and Qg, and the secondary factors are p, σdhsr, σmin and σmax. Among them, ϕ, TOC and Qg are the main geological parameters which control the quality of the reservoir before stimulation, such as pore expansion, shale gas generation, shale gas storage and migration. Cbri is the most critical engineering parameter which plays an important role in controlling the reservoir stimulation effect and ultimate single-well production. The role of secondary parameters such as p, σdhsr, σmin and σmax cannot be ignored, and they also have an important influence on the safe well construction and efficient development of the Weirong shale gas field.
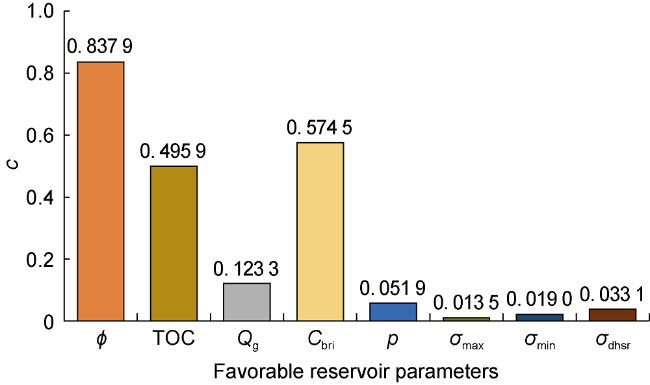
Fig. 6. Pearson correlation coefficients of favorable shale reservoir parameters with open shale gas flow from O3w2-S1l12 in 6 wells in the Weirong shale gas field. |
2.3. Multi-parameter fusion, characterization and a comprehensive evaluation of favorable reservoirs
Based on the interpretation of strata, sedimentation, structure, fracture, etc., to accurately evaluate the favorable deep shale reservoirs in the Weirong shale gas field, it is necessary to comprehensively analyze the distribution law of favorable reservoir parameters in combination with core, logging and seismic data. However, there are many parameters such as ϕ, TOC, Qg, Cbri, p, σmax, σmin, and σdhsr which should be known and increase the difficulty of evaluating favorable reservoirs. It is necessary to select key components from high-dimensional, redundant and complex big data to accurately understand the key characteristics of favorable reservoirs.
The KPCA multi-parameter nonlinear dimensionality reduction method does not need to set any parameter’s weight, thus avoiding human subjective factors. It can automatically select the big data features from various parameters, and integrate and fuse them into the kernel principal components to characterize favorable reservoir laws. As shown in Fig. 7 and Fig. 8 , the Z high-value anomaly of O3w-S1l is the result of fusing the advantages of ϕ, TOC, Qg, Cbri and p after KPCA processing, and it indicates the spatial distribution of favorable reservoirs. Fig. 7 is the result of fusing the ϕ, TOC, Qg, Cbri, p, σmax, σmin and σdhsr on Fig. 4 and realized multi-parameter dimensionality reduction. The Z high-value anomaly accurately indicates the vertical distribution characteristics of the favorable reservoir section in O3w2-S1l12 and the spatial distribution of the Z anomalies on the horizontal sections of wells A-F. In addition, Fig. 7 shows that the high anomalies of the training wells B, C and D from the CNN model are very clear, and the prediction well A and new wells E and F also have corresponding high Z anomalies. These anomalies are in good agreement with the open shale gas flows of the wells, reflecting that the KPCA method can accurately select the key characteristics of favorable reservoir parameters, and effectively characterizes the vertical distribution of favorable reservoirs in O3w2-S1l12.
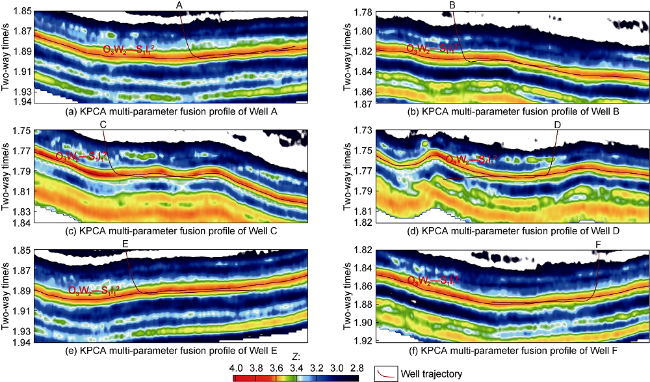
Fig. 7. KPCA multi-parameter integration and fusion to characterize favorable reservoir profile features of O3w2-S1l12 in the Weirong shale gas field. |
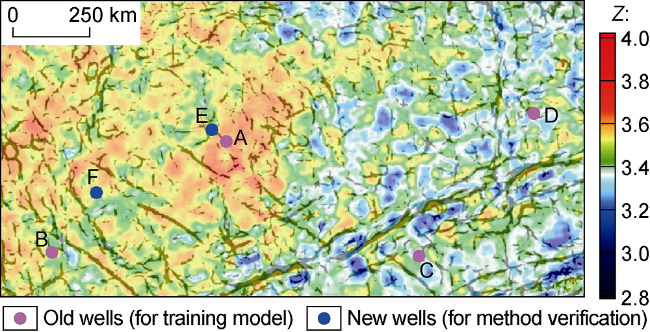
Fig. 8. KPCA multi-parameter integration and fusion to characterize favorable reservoirs of O3w2-S1l12 in the Weirong shale gas field. |
By further integrating KPCA multi-parameter nonlinear dimensionality reduction with fracture data, the integrated and comprehensive distribution characteristics of ϕ, TOC, Qg, Cbri, p, σmax, σmin and σdhsr of the O3w2-S1l12 reservoir after fusing with fractures can be obtained. As shown in Fig. 8 , the Z high-value anomalies are widely distributed along the O3w2-S1l12 strata, especially in wells A, B, C, D, E and F where shale gas industrial productivity is obtained, and the characteristics of Z high-value anomaly and fracture development are obvious. However, the degree of fracture development is not the only determinant of single-well shale gas production. For example, Well C and Well D are located at the edge of a low depression where faults are developed, but the shale gas production is relatively low, and the Z anomaly is not as significant as that in the central area of the low depression. In the low depression belt centered on Well A, micro-fractures are widely developed, which can play an important role in enlarging reservoir pores, shale gas seepage and fracturing stimulation. The Z value anomalies of different degrees in this area are in good agreement with the single-well shale gas open flow. Also, the distribution of the Z high anomalies is large, and highly consistent with the sedimentary environment with high ϕ, TOC, Qg, p and Cbri. It may be a target area for deep shale gas development in the future. These understandings have been confirmed by new wells E and F.
After obtaining the high-dimensional correlation characteristics of Pearson correlation coefficients of favorable deep shale reservoir parameters based on core and logging data, KPCA multi-parameter nonlinear dimensionality reduction is carried out to obtain the nonlinear characteristics of favorable reservoirs from core and logging data. Combining the traditional seismic inversion and CNN deep learning method, ϕ, TOC, Qg, Cbri, p, σmax, σmin, σdhsr and other favorable reservoir parameters are predicted, then the big-data characteristics are selected from various parameters using the KPCA method, and finally integrated to characterize favorable reservoirs. It should be pointed out that according to different geological or engineering targets, specific parameters can be selected for KPCA fusion, and the principal component data with clear characteristics can be quickly obtained to meet various geological and engineering requirements such as a comprehensive evaluation of shale gas geological targets, well location deployment and well trajectory design. Of course, the prediction method of favorable deep shale reservoirs based on machine learning also has certain applicable conditions. First of all, sufficient data are needed from core analysis, logging interpretation and seismic inversion, which contain favorable reservoir information. Secondly, prior information such as geological, engineering, logging and seismic data is very important, which not only helps to understand the correlations between core and logging data by Pearson correlation coefficient and the response laws, but also guides CNN to train favorable reservoir models and verify the accuracy of models. Thirdly, KPCA nonlinear dimensionality reduction and big data feature extraction should consider geological, engineering and geophysical data to obtain integrated and fused characterization and comprehensive evaluation of favorable reservoirs.
3. Conclusions
Prediction of favorable deep shale reservoirs based on machine learning is realized by the three methods of parameter correlation analysis, CNN intelligent prediction and KPCA nonlinear dimensionality reduction and the five steps of high-dimensional correlation analysis of favorable reservoir parameters based on Pearson coefficient, selecting logging features and analyzing response laws of favorable reservoirs based on KPCA, CNN reservoir model training, CNN favorable reservoir parameter prediction, and KPCA integrated and fused characterization and comprehensive evaluation on favorable reservoir parameters.
The Pearson correlation coefficient heat map formed by the Pearson correlation coefficient matrix can directly reflect the high-dimensional correlation characteristics of core and logging data. Combined with KPCA multi-parameter nonlinear dimensionality reduction, it can simplify the characterization of complex high-dimensional data, which is beneficial to efficiently and accurately reveal the core and logging response law of favorable reservoirs.
After training a model similar to the favorable reservoir based on logging data, the CNN deep learning method and parameters including vp, vs and ρ from seismic inversion can be used to intelligently predict favorable reservoir parameters ϕ, TOC, Qg, Cbri, p, σmax, σmin, σdhsr, etc., which can overcome the problems of many intermediate links, low efficiency and insufficient accuracy of favorable reservoir prediction caused by traditional methods relying on empirical algorithms and regression fitting formulas.
All kinds of parameters are mapped to high-dimensional feature space by KPCA, and the big-data features of these favorable reservoir parameters are selected through multi-parameter dimensionality reduction and complex redundant information elimination. The KPCA integrated and fused characterization data lays the foundation for the comprehensive evaluation of favorable reservoirs.
This method accurately identified the favorable shale reservoirs of the Wufeng Formation to the Longmaxi Formation in the Weirong shale gas field, and the result is highly consistent with the core, logging and open flow data. It has been proved that the method can provide effective technical support for deep shale gas exploration and development.
Nomenclature
a—serial number of eigenvalues, a = 1, 2,…, b, dimensionless;
b—the number of eigenvalues, b≤m, dimensionless;
c—Pearson correlation coefficient, dimensionless;
Cbri—brittleness index, %;
e—covariance of x and y, dimensionless;
f—shale gas open flow, 104 m3/d;
i—sample serial number, i = 1, 2,…, n, dimensionless;
j—sample group serial number, a = 1, 2,…, m;
k—Gaussian kernel function, dimensionless;
K—Gaussian kernel matrix, dimensionless;
m—group number of samples;
n—number of samples;
p—pore fluid pressure, MPa;
P—the characteristic parameter of pore fluid pressure, that is, the product of pore fluid pressure and effective stress coefficient, MPa;
Qg—gas content, m3/t;
s—standard deviation of x and y, dimensionless;
T—transposed operation symbol;
TOC—total organic carbon content, %;
vp—P-wave velocity, m/s;
vs —S-wave velocity, m/s;
V—the characteristic vector of K, dimensionless;
x—the standardized sample of core or logging data, dimensionless;
y—the standardized sample of core or logging data, dimensionless;
z—the standardized sample of core, logging or seismic data, dimensionless;
Z—the KPCA value kernel principal component, dimensionless;
Z—the KPCA value matrix of kernel principal component, dimensionless;
$\ell$—the ratio of sums of eigenvalues, dimensionless;
λ—the characteristic value of K, dimensionless;
ρ—density, g/cm3;
σmax—maximum horizontal stress, MPa;
σmin—minimum horizontal stress, MPa;
σdhsr—horizontal stress difference coefficient, dimensionless;
τ—the mapping of z in feature space, dimensionless;
ϕ—porosity, %;
ψ—covariance of τ, dimensionless;
Δt—acoustic time difference, m/s.