

Introduction
The shale oil and gas revolution in the United States has changed the world energy landscape and achieved "energy independence". The crude oil production of the United States in 2020 was 5.7×10⁸ t, of which shale oil production was 3.5×10⁸ t, accounting for about 61% [1-2]. The shale oil and gas revolution in the United States broke through the traditional concept of exploration and development in trap, promoted the progress of petroleum geology and development theory and technology, thus greatly expanding the field of exploration and development of oil and gas resources.
With the breakthrough of oil and gas geological theory and the innovation of engineering technology, significant progress has been made in the exploration and development of continental shale oil in China [3-4]. Industrial oil flows have been obtained in many areas, including the Triassic Yanchang Formation in Ordos Basin [5-6], the Permian Lucaogou Formation in Jimsar Depression [7] and Permian Fengcheng Formation in Mahu Depression [8] in Junggar Basin, the first member of Cretaceous Qingshankou Formation in Songliao Basin [9], the second member of Paleogene Kongdian Formation in Cangdong sag of Huanghua Depression in Bohai Bay Basin [10], the upper Sha 4 Member and lower Sha 3 Member of Paleogene Shahejie Formation in Jiyang Depression [11] in Bohai Bay Basin, and the third member of Paleogene Qianjiang Formation in Qianjiang sag in Jianghan Basin[12]. In addition, shale oil national demonstration areas have been established in Longdong of Changqing and Jimsar of Xinjiang. In 2021, the continental faulted lake basin shale oil national demonstration areas in Gulong of Daqing Oilfield and Jiyang of Shengli Oilfield successively passed the demonstration. By the end of 2021, the cumulative capacity of shale oil has exceeded 500×104 t, with an annual oil output of about 160×104 t, the exploration and development of shale oil in China has entered into a rapid development stage.
In China, the development cost of continental shale oil is generally more than US $50/bbl (1 bbl=0.159 m3), and the average daily oil production rate of a single well is generally less than 20 t. Compared with the marine shale oil in North America, the large-scale commercial development of continental shale oil in China faces many challenges: (1) The reservoir lithofacies are complex and diverse, with frequent phase transformations and strong heterogeneity, so it is difficult to analyze the enrichment mechanism and predict the favorable "sweet spot". (2) The clay content is high, the mineral composition of different basins varies greatly, and the fracturing stimulation and optimization of process parameters are difficult. (3) The production rate decline of horizontal well is fast, and the effective development supporting technology and reasonable development working system need further research. In view of the particularity and complexity of continental shale oil, the development evaluation technology research was carried out to clarify the enrichment mechanism, flow mechanism and fracture network fracturing mechanism, guide development area optimization and geological engineering integration technology optimization, improve the productivity and cumulative production, so as to promote the scale benefit development.
1. Geological and development characteristics of shale oil in China and North America
Continental shale rich in organic matter is developed in most petroliferous basins in China. These organic shales are both source rocks and reservoir rocks. There are great differences in geological and development characteristics between continental shale oil in China and marine shale oil in North America [13⇓⇓⇓⇓-18] (Table 1 ), mainly in the following six aspects.
Table 1. Comparison of shale oil geological and development characteristics between China and America |
| Shale oil field/ reservoir | Sedimentary environment | Organic geochemical characteristics | Reservoir characteristics | Fluid characteristics | Initial daily oil production/t | |||
|---|---|---|---|---|---|---|---|---|
| Ro/% | TOC/% | Porosity/ % | Pressure coefficient | Crude oil density/ (g·cm-3) | GOR/ (m3·m-3) | |||
| Bakken oilfield in America | Marine deep-water anoxia | 0.70-1.30 | 10.0-20.0 | 5.0-12.0 | 1.3-1.6 | 0.78-0.83 | 50-375 | 10-300 |
| Eagelford oil field in America | Marine deep-water anoxia | 0.50-2.00 | 4.0-7.0 | 6.0-12.0 | 1.3-1.8 | 0.77-0.79 | 90-850 | 10-300 |
| Jimsar sag, Junggar Basin | Shore shallow lake-semi deep lake | 0.60-1.10 | 3.0-6.0 | 5.0-18.0 | 1.1-1.8 | 0.88-0.92 | 17 | 15 (average) |
| Mahu sag, Junggar Basin | Semi deep-deep alkali Lake | 0.85-1.40 | 0.2-4.1 | 3.0-8.0 | >1.5 | 0.84-0.88 | 44 (Maye 1 well) | |
| Gulong sag, Songliao Basin | Freshwater lake basin | 0.70-1.13 | 1.4-4.5 | 1.4-8.7 | 1.2-1.6 | 0.78-0.87 | 30-800 | 31 (Guye Youping 1 well) |
| Cangdong sag, Bohai Bay Basin | Inland saline lake basin | 0.50-1.10 | 1.5-3.5 | 3.0-7.0 | 0.9-1.2 | 0.86-0.89 | 82-103 | 5-20 |
| Jiyang Depression, Bohai Bay Basin | Semi deep-deep saline lake basin | 0.50-1.00 | 0.6-16.7 | 1.7-12.0 | 1.2-1.8 | 0.77-0.93 | 0-100 | 6-44 |
| Chang 7 member of Ordos Basin | Semi deep lake- deep lake | 0.70-1.10 | 6.0-38.0 | 2.0-3.0 | 0.6-0.8 | 0.84-0.86 | 60-120 | 8-18 |
(1) Sedimentary environment. Continental shale in China is mainly formed in semi-deep to deep water lakes. And there are two types of source rocks: freshwater shale and semi-saline to saline shale [3,18]. The lacustrine sediments were significantly affected by climate. The distribution area of shale strata was small, and the types of lithofacies were diverse. Different lithofacies were roughly distributed in a circular belt around the geometric center of the basin. The sedimentary environment of marine shale in North America is relatively simple, which was mainly formed in the anoxic and low-energy marine sedimentary environment. The scale of marine water body was large, and it was less affected by climate. The shale formation had a large distribution area, good stability, and relatively single lithofacies type.
(2) Structural features. The tectonic environment of continental shale in China was generally unstable. Affected by orogenic and fault activities, there were many types and quantities of sedimentary basins with strong segmentation and late activity. Marine shale was mainly developed in foreland basins and craton basins. Its tectonic activity was relatively stable, which was conducive to the stable development and distribution of high-quality source rocks in a large area.
(3) Organic geochemical characteristics. The organic matter types of continental shale in China were mainly type I and type II, and the degree of thermal evolution was medium and low. The Ro value was 0.5%-1.4%, and the organic matter content varied greatly, with TOC value of 0.2%-38.0% [18-19]. The type of organic matter in typical shale series in North America was mainly type II, and the degree of thermal evolution was medium and high. The Ro value was 0.4%-2.0%, and the TOC value was generally high, with the value of 1.5%-20.0% [20-21].
(4) Reservoir characteristics. Affected by the sedimentary environment, diagenesis and structural transformation, the lateral heterogeneity of continental shale reservoirs in China was strong, and the porosity was 0.2%-19.0% [3]. The reservoir space was characterized by the coexistence of pores and fractures. Micron and nano inorganic pores were developed, while organic pores were not developed, making a small contribution to the reservoir space. The gas permeability was less than or equal to 0.1×10⁻³ μm2 [14], and its pressure coefficient varies widely, ranging from 0.6 to 1.8. Shale oil reservoirs in North America were relatively stable in distribution and relatively good in physical properties, with porosity of 5%-12%. The pore connectivity was good, the organic pores were developed and had a certain contribution to the reservoir space, and the pressure coefficient was 1.3-1.8 [20-21].
(5) Fluid characteristics. The formation time of continental basins in China was relatively late, and the degree of thermal evolution was low. Shale oil was mainly composed of heavy components, with high viscosity and low gas oil ratio. The crude oil density was 0.76-0.93 g/cm3. The gas oil ratio varies in different regions, generally less than 100 m3/m3, and the oil gas ratio of Gulong shale was higher, more than 100 m3/m3. Shale oil in North America was light, mostly condensate and light oil, with low viscosity, crude oil density of 0.77-0.83 g/cm3, and high gas oil ratio, generally 50-300 m3/m3 [13].
(6) Capacity characteristics. There are widely distributed "sweet spot" areas of continental shale oil in China, each with a small area. The initial production of single shale oil wells in Jimsar, Cangdong of Dagang, Gulong of Daqing and other regions in Xinjiang was mostly less than 30 t/d. Shale oil in North America was generally distributed in a large area, with an output of 10-300 t/d at the initial stage of a single well and a stable output of about 20-80 t/d.
Overall, the characteristics of the continental shale oil in China are large horizontal distribution changes, frequent phase changes, strong heterogeneity, low degree of thermal evolution, complex pore structure and types, high crude oil density, high viscosity, high wax content, poor flow capacity, and low daily and cumulative production of single wells. In order to achieve beneficial development, it is necessary to strengthen development evaluation and technical research.
2. Evaluation methods and techniques of continental shale oil development
After years of research and practice, evaluation methods and technologies of continental shale oil development in China have been preliminarily formed, which mainly include lithofacies evaluation, reservoir characterization, mobility evaluation, fracability evaluation, productivity evaluation and "sweet spot" analysis technology by geological modeling and numerical simulation integration.
2.1. Lithofacies evaluation technology
Lithofacies refers to rocks or rock combinations formed in a certain sedimentary environment. China has different sedimentary environments in continental basins and many lithofacies combinations. Lithofacies directly affects the reservoir property, occurrence state, oil-bearing property and fracability of shale oil. Diversity and differences of lithofacies lead to diversity of “sweet spot” [22]. Therefore, lithofacies evaluation is important in the development evaluation.
Continental shale oil reservoir is mainly characterized by interbedded lithofacies, mixed lithofacies and pure shale lithofacies in different basins in China. The interbedded type is the combination of mud shale lithofacies with thin fine sandstone, siltstone or carbonate lithofacies [23-24]. The thickness of single layer is thin and the physical properties are relatively good. The typical representative is Chang 7 Member of Triassic Yanchang Formation in Ordos Basin. The mixed lithofacies is composed of felsic minerals, clay minerals and carbonate minerals, with high content of brittle minerals, which are formed under the joint action of mechanical transport, biogenic chemical precipitation, volcanic eruption, hydrothermal upwelling and other geological factors. The typical representative is the Permian Lucaogou Formation in The Jimsar sag, Junggar Basin[25-26]. The pure shale type is deep-water fine sediment, with shale, argillaceous siltstone interbedded with thin-bedded siltstone and shell limestone. It is dominated by felsic shale lithofacies, with silty and calcareous (dolomitic) laminae and developing foliation fractures, and is typically represented by Qing 1 Member and Qing 2 Member of Gulong sag, Songliao Basin [27-28].
2.1.1. Classification of shale lithofacies
At present, there is no unified classification method for shale lithofacies [29-30]. In recent years, with the promotion of shale lithofacies research, considering more abundant data and more comprehensive factors, the classification methods of shale lithofacies are gradually becoming consistent. A classification method of continental shale lithofacies based on key lithofacies parameters such as rock composition, sedimentary structure, rock structure and organic matter has been developed in Shengli Oilfield [31⇓-33]: Quartz, feldspar, clay and carbonate minerals are quantitatively classified according to the mineral composition analysis of rock X-ray diffraction. Sandstone, mudstone and carbonate are regarded as three end-members of shale lithofacies, with contents of 25%, 50% and 75% as boundaries. Based on core and thin section observation, the sedimentary structures with laminar thickness less than 1 mm are classified as laminar, and those with laminar thickness greater than or equal to 1 mm are classified as bedding, and those without laminar development are classified as massive. As the characteristics of high content of gray matter and great difference of crystallization among shale formations in Jiyang Depression, coarse grain, fine grain and cryptic grain are classified according to the characteristics of rock structure. Finally, organic matter abundance greater than or equal to 2% is classified as rich organic matter, organic matter abundance less than 1% is classified as poor organic matter, and organic matter abundance between the two is classified as containing organic matter. According to the above classification scheme, 16 main lithofacies types can be divided in the upper Sha 4 Member and lower Sha 3 Member in Jiyang Depression. There are six common types (Fig. 1 ): organic rich sparitie laminar calcareous shale, organic rich cryptocrystalline laminar calcareous shale, organic rich cryptocrystalline laminar calcareous-argillaceous shale, organic rich cryptocrystalline layered calcareous-argillaceous shale, organic cryptocrystalline layered calcareous-argillaceous shale, organic cryptocrystalline massive calcareous-argillaceous shale.
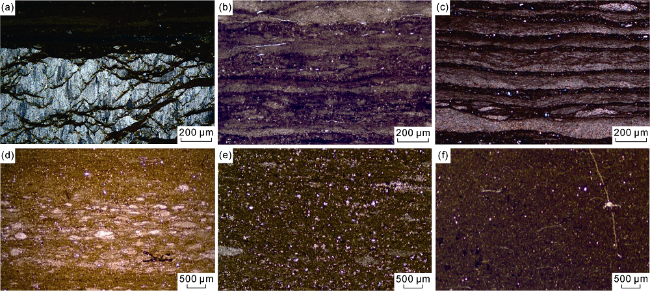
Fig. 1. Microscopic characteristics of common shale lithofacies types in Jiyang Depression. (a) Organic rich sparitie laminar calcareous shale; (b) Organic rich cryptocrystalline laminar calcareous shale; (c) Organic rich cryptocrystalline laminar calcareous- argillaceous shale; (d) Organic rich cryptocrystalline layered calcareous-argillaceous shale; (e) Organic cryptocrystalline layered calcareous-argillaceous shale; (f) Organic cryptocrystalline massive calcareous-argillaceous shale. |
2.1.2. Lithofacies identification technology
The most direct method to identify lithofacies is core observation and experimental analysis [34]. Rock slice, polarizing microscope observation, field emission environmental scanning electron microscope combined with backscattered electron diffraction imaging, X-ray energy spectrum analysis system, micro zone Mineral Quantitative Analysis (QEMSCAN) and other methods are usually used for lithofacies identification. Based on the experimental analysis data of shale cores, a lithofacies division scheme was established to clarify the mineral composition, content and lithological characteristics of different lithofacies, and establish lithofacies indicators. Correlation analysis between experimental analysis data and logging curves are conducted, calibration of logging data, optimization of sensitive curves, summarization of logging response characteristics of different lithofacies, and establishment of lithofacies fine division sections, so as to accurately identify formation lithofacies [35-36]. Fully combine the high-precision seismic data and the petrophysical response characteristics of existing wells. Through the close combination of logging, seismic, geological and reservoir disciplines, and on the basis of fine structural interpretation, the ancient landform during the deposition of the target horizon is restored. Combined with the core lithofacies profile established in the laboratory, the division of shale sedimentary facies zones is carried out, and the inversion model of sedimentary facies control constraints is established. Through the lithology inversion of multi-attribute fusion and sensitive curve reconstruction, the prediction of favorable lithofacies of shale oil is realized, which provides favorable support for accurately finding the target area of dominant shale oil “sweet spot”.
2.2. Reservoir characterization technology
Shale reservoirs are mainly composed of micro and nano pores, with multi-scale and multi-type micro-fractures developed. There are many methods to characterize shale reservoir space, including direct observation method, quantitative characterization method and logging method. Through multi-scale qualitative observation and quantitative evaluation, the shale reservoir space types, size, shape, distribution and connectivity are studied. It lays a foundation for studying the occurrence characteristics and mobility of shale oil.
Direct observation methods mainly include thin section, microfluorescence, scanning electron microscopy (SEM), transmission electron microscopy (TEM), field emission environment scanning electron microscopy (FE-SEM), small angle neutron scattering (SANS), micro/nano 3D computed tomography (CT) and other image analysis techniques. SEM, FE-SEM and CT scanning identify the lower limit of pore size as 2 nm. The pore structure parameters such as face rate, throat radius and coordination number can be calculated quantitatively by mathematical morphology and digital image processing. Quantitative characterization methods mainly include high-pressure mercury injection method, nitrogen adsorption method and nuclear magnetic resonance method, which can quantitatively characterize shale pore specific surface area, pore volume, pore size distribution and pore throat connectivity. Different quantitative characterization methods have certain limitations when applied to shale pore structure characterization (Table 2 ). In order to obtain a complete understanding of the multiscale pore-fracture structure, a combination of multiple analytical techniques is often used. The logging method has comprehensive data and high resolution, and is one of the major methods for shale reservoir evaluation. The application effect of nuclear magnetic resonance logging in shale porosity calculation is better, and the accuracy of porosity calculation combined with density logging, neutron logging and acoustic logging is higher. The imaging logging can identify the fracture information directly by high-resolution 2D images, and characterize the quantitative parameters of natural fracture formation, orientation, dip angle, density, opening, size, porosity and permeability, as well as the qualitative parameters of fracture genesis, mechanical properties, filling and effectiveness.
Table 2. Comparison of quantitative characterization techniques of reservoir space |
| Method | Advantage | Disadvantage |
|---|---|---|
| High- pressure mercury injection | Fast test, relatively simple principle and operation. It can obtain many important pore physical parameters such as porosity, pore size distribution, skeleton density, apparent density and specific surface area. It has certain advantages in studying the distribution of large pores and determining the effective porosity of shale. | The surface heterogeneity and liquid-solid interaction of rock samples will affect the measurement of surface tension and diffusion coefficient, and cause the measurement error of pore distribution. The actual mercury saturation is low and the data is incomplete. High pressure will open cracks in shale, resulting in measurement errors. Mercury injection method is used to measure the maximum pore opening size, so the pore throat makes the measurement result of pore size distribution deviate from the real value. |
| Nitrogen adsorption | No damage test method. The specific surface area, fractal dimension and pore size distribution can be obtained. It has certain advantages in studying micropore and mesopore of shale. | The test results are affected by the selected model and the accuracy varies greatly. Throat and pore cannot be distinguished in pore distribution measurement. The pore distribution and structural characteristics of macropores cannot be characterized. The porosity information of the sample cannot be obtained separately. Different working gases correspond to different test pore ranges. |
| NMR | No damage test method. It can accurately characterize the pore size distribution in the whole pore scale, such as porosity, permeability, fluid saturation. | Nanoscale pore relaxation time is short and difficult to be completely detected. Water and organic matter in shale pores are difficult to distinguish and their data interpretation are difficult. The transverse relaxation time curve can only reflect the distribution trend of pore size. They are not the absolute pore size, so the pore size should be calculated by mercury injection. |
2.3. Mobility evaluation technology
The occurrence state of shale oil is complex, usually coexisting in the form of free state, adsorbed state and mutual state. Shale oil mobility is controlled by reservoir physical properties (pore size, wettability), free oil content, fluid properties, lithology and other factors [37-38]. Shale oil mobility evaluation methods include NMR, digital core and molecular dynamics simulation.
The movable oil saturation and pore radius were calculated according to the NMR transverse relaxation time spectrum before and after centrifugation for NMR technology. The centrifugal force is the difference between the original formation pressure and the formation pressure at the end of shale oil development [14]. NMR technology, combined with physical simulation experiments such as elastic development, imbibition oil production, CO2 injection huff and puff, can analyze the production degree of shale oil and the production rate of pore crude oil of different scales under different production modes.
Digital core technology is an important means to obtain core pore structure characteristic parameters and study pore scale fluid flow law[39]. By means of focused ion beam scanning electron microscope or CT scanning, the real three-dimensional pore structure of shale core is reconstructed, the pore network model is extracted and established, and the flow simulation research is carried out. The seepage law of micro and nano pores in shale is very complex, and N-S equation and lattice Boltzmann equation are commonly used to characterize it. Considering wettability, slip and other factors, the mathematical characterization model of shale oil flow is established, and the dynamic law of single-phase and multi-phase flow of shale oil at pore scale is revealed through finite element calculation. At present, the mathematical representation model and calculation speed of shale oil digital core flow simulation analysis technology still need to be optimized and improved.
Molecular dynamics simulation evaluation of shale oil mobility is in its infancy, and the mineral structure model and large-scale solution method are not mature [40]. The complexity of shale reservoir increases the difficulty of molecular simulation. The influence of nitrogen/sulfur/ hydrogen and other functional groups in organic matter, the complexity of porous media structure, fluid solid interaction and the fluid phase state changes need to be considered. Due to the complexity of crude oil components, molecular dynamics simulation needs to simplify the molecular model and the simplified molecular model is different from the actual situation. At the same time, the selection of mineral model also restricts the accuracy of molecular scale simulation [41-42]. In order to improve the accuracy of molecular dynamics simulation, it is necessary to build a nano scale confined mass transfer theoretical system, clarify the physical and chemical properties of molecules, and establish a more accurate theoretical storage model.
2.4. Fracability evaluation technology
Currently, the most application of fracability evaluation method is brittleness index method based on the brittle mineral content or rock mechanical parameters. However, these two kinds of calculation methods are established for the rock minerals and mechanical parameters of the Barnett marine shale in North America[43]. Due to differences in influencing factors, it is difficult to effectively evaluate the fracability of continental shale.
Considering the reservoir rock characteristics and operation parameters, a new method for evaluating the fracability of continental shale is established in Reference [44]. Three kinds of evaluation parameters were selected: (1) Brittleness index, which is calculated based on fracturing pressure, construction displacement volume and other parameters, reflects the difficulty of formation fracture and the influences of formation temperature, pressure and other factors. (2) The ground stress characteristic parameters, including the minimum horizontal principal stress gradient, reservoir fracture pressure gradient and the difference coefficient of two horizontal stresses, reflect the formation fracture propagation and the probability of forming complex fractures. (3) Operation parameters, including comprehensive sand-liquid ratio, relative density of slippery water, proportion of medium sand and above, where the proportion of medium sand and above is 0.212-0.425 mm and 0.3-0.6 mm (40/70 mesh and 30/50 mesh) of proppant in total proppant dosage. The ratio of the propping dose to the amount of all fracturing fluid pumped into the formation reflects the difficulty of fracturing construction and reconstruction. The higher the ratio, the better the formation compaction. The above evaluation parameters were normalized and the weight of parameters was calculated by using the variation coefficient method. In the end, the comprehensive fracability index of shale was calculated.
2.5. Productivity evaluation
Productivity evaluation methods mainly include empirical method, modern production decline method, analytical method and numerical simulation method [45]. The calculation results of empirical method and modern production decline method are affected by the flow state of producing wells, resulting in unclear understanding of production decline law, which reduces the accuracy of productivity evaluation. Analytical method and numerical simulation method need more physical parameters and have poor field operability. In order to improve the prediction accuracy of shale oil production capacity, the shale oil research team of Shengli Oilfield established a production capacity evaluation method based on production data analysis and reservoir engineering methods.
2.5.1. Productivity evaluation based on production data analysis
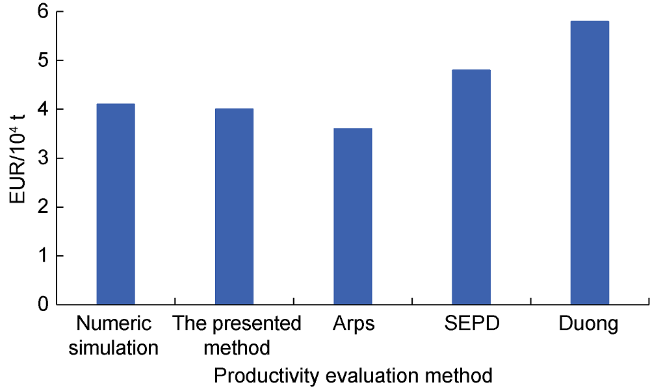
Considering the production and development characteristics and uncertain factors of shale oil, the shale oil team of Shengli Oilfield established a productivity evaluation method based on production data analysis. Based on the historical pressure data monitored by the micro-seismic test, the method conducts pre-fracture well test analysis, obtains reservoir parameters such as reservoir pressure, stress and permeability, and evaluates the seepage capacity of shale reservoirs. Based on the characteristic chart of material balance time and normalized production, the early linear flow, radial fracture flow, late linear flow and quasi-steady flow were diagnosed in the production process of shale oil horizontal wells, and the appropriate production decline model was selected according to the flow pattern. Combined with Blasingame and flow material balance and other production rate transient analysis (RTA) methods, parameters such as fracture half-length, recoverable reserves, and geological reserves are obtained to predict shale oil well performance. The presented method was used to predict the recoverable reserves of Well FYP1 in the Jiyang Depression of Shengli Oilfield, and the predicted recoverable reserves are 4.0×10⁴ t by using this method. Compared with the prediction results of Arps decline model, Duong model, and SEPD model (Fig. 2 ), the prediction is in good agreement with the numerical simulation results.
Fig. 2. Comparison of prediction results with different productivity evaluation methods. |
In order to improve the accuracy and reliability of the productivity evaluation method, the production characteristics of shale oil wells should be considered, and the appropriate analysis method should be selected through comparative evaluation.
2.5.2. Productivity evaluation based on reservoir engineering method
Considering the complex flow mechanism of matrix and fractures, the shale oil research group in the Shengli Oilfield established a productivity evaluation method for fractured horizontal wells. Firstly, the distribution of the aperture network in the matrix was clarified, and the nonlinear flow mathematical model of in matrix was established considering the flow characteristics of organic and inorganic pores. Based on the dual media theory, a quantitative characterization method of channel-flow coefficient between shale matrix and natural fractures was established. The fractal theory was used to quantitatively describe the complexity of the fracture network in the reconstructed zone, and the match-fracture cross- scale seepage equation was established. Based on the partition model, the fractured shale reservoir is divided into the modified zone, unmodified zone, and main fracture zone, and the production model of shale oil horizontal well is constructed by coupling the zonal seepage equation with the pressure conditions of each zone boundary. The Laplace transform is used to eliminate the influence of time variables, and the numerical solution of the productivity model is obtained by combining it with numerical inversion, so as to realize the dynamic prediction of shale oil well production.
Based on the established production predictive model, the influences of geological parameters, fracture parameters, matrix parameters, and other factors on production are further analyzed. By fitting the historical production characteristics of shale oil wells, matrix permeability, fracture half-length, drainage radius, and controlled reserves of the well are retrieved to evaluate the productivity and fracturing effect of horizontal wells. Thus, the development technology policy, fracturing design scheme, and production system of shale oil wells can be determined to improve the recovery factor.
2.6. "Sweet spot" analysis based on geological modeling and numerical simulation integration
Development evaluation is used to identify favorable development objects, namely "sweet spots". In order to improve the prediction accuracy of the "sweet spot", geological modeling-numerical simulation integration sweet spot analysis was carried out. Based on regional 3D seismic and horizontal well logging and other data, multi- parameter intersection analysis, discrete stochastic simulation and other methods are used to build fine 3D geological model and geomechanical model. Combined with the complex fracture network model, the unstructured meshing technology and the multi-scale flow coupled differential solution technology are used to carry out productivity simulation. Real-time updating reservoir dynamic monitoring data and production data and iteratively optimizing geological models, fracture models and reservoir models can greatly improve the quality and accuracy of models, thus guiding the optimal selection of shale "sweet spots".
2.6.1. 3D geological modeling
There are relatively few 3D geological modeling practices for shale oil, most of which follow the modeling ideas of conventional reservoirs, and use stochastic modeling methods such as sequential Gaussian simulation and sequential indication simulation to establish key parameter models of lithofacies, porosity, and permeability. For the vertical distribution of limestone and shale interbed, shale oil modeling mainly focuses on 3D geological characterization of complex lithofacies and multi-scale fractures[46⇓-48].
In terms of complex lithofacies modeling, researchers from Sinopec Shengli Oilfield carry out cluster analysis and optimized combination of different lithofacies characteristics of vertical limestone and shale interbed to form lithofacies assemblages based on lithofacies combination modes. Considering the shale thickness, physical properties, oil-bearing properties, mineral content, differences in vertical combination, distribution of interlayers such as tight limestone and pure mudstone of different lithofacies assemblages, the matrix modeling of shale is conducted taking lithofacies assemblages as basic unit. Guided by the distribution of lithofacies, the multi-point geostatistical modeling is used to solve the contact relations of complex facies transformation, and the stochastic simulation and deterministic modeling are combined to establish complex lithofacies models of continental shale, realize the 3D quantitative characterization of continental shale lithofacies and display the spatial structure of different lithofacies assemblages. The geological parameters and engineering parameters of different lithofacies assemblages have different distribution thresholds, so the stochastic modeling method with multi-factor constraints of facies control and attribute inversion is adopted to establish a property model of shale physical parameters, restricted by the shale lithofacies model, based on parameters such as mineral component, organic carbon content, free oil content, porosity, permeability and brittleness index of core analysis or logging evaluation, and taking the pre-stack and post-stack attribute inversion parameters of high precision development seismic as the macro-control conditions between wells.
Multiscale fracture modeling mainly focuses on bedding fractures and tectonic fractures. The discrete fracture network modeling technology (DFN) is often adopted in the modeling of natural structural fractures. Multi-technology fusion is used to describe the fracture distribution and discrete methods such as statistics or fluid flow are applied to integrate large-scale and small-scale fractures into a unified network to establish a discrete fracture network model. In terms of bedding fracture modeling, imaging logging, core and thin section observations are used to quantitatively describe the density, width and opening degree of bedding fractures in different lithofacies assemblages, statistically analyze the degree of correlation between bedding and bedding fractures in different lithofacies assemblages, determine the distribution space of bedding fractures in different lithofacies assemblages, which is equivalently converted into the strength of the bedding fracture, and the bedding fracture model is established by sequential Gaussian simulation.
2.6.2. Numerical simulation
Numerical simulation models for volumetric fracturing mainly include the Bi-wing model, orthogonal wire-mesh model, and unconventional fracture model. The planar symmetrical Bi-wing model can simulate simple multi-stage fractured horizontal wells. However, the geometric shape of seam mesh simulated by the orthogonal wire mesh model is ideal, and it has great limitations. The unconventional fracture model can accurately simulate the distribution and morphology of fractures and is the most widely used model in fracture simulation and modeling. Multi-scale pore and fracture structure features are complex in shale [49], and the three systems of the matrix, natural fracture, and artificial fracture are coupled, making it difficult to describe the regional distribution characteristics and interaction mechanism of multi-physical fields such as seepage field and stress field. Considering fracture network formation mechanism and multi-scale and multi-field coupling mechanism of shale reservoir, such as seepage field and stress field, the shale oil research team in Shengli Oilfield developed fracture network expansion simulation and fluid-solid coupling numerical simulation methods for shale oil volume fracturing horizontal wells.
According to the theory of mechanics and crack extension rule, the shale reservoir fracturing fracture propagation theory model is set up, conjointly with the distribution regularity of stress field and micro-seismic monitoring results, the model can quantitatively describe and characterize of the volumetric fracture network shapes and patterns, simulate the formation process of fracturing fracture network. Considering shale reservoir multi-scale aperture structure and reservoir deformation characteristics, coupling embedded discrete crack model and double medium model to set up the matrix, natural fracture, branch fracture, and the main multistage fracture network flow model. Then combined with effective stress and the stimulation zone flowing model, the seepage field and stress field cross-coupled dynamic flowing mathematical model were establish. Finally, an efficient and accurate multi-scale numerical simulation method for shale oil was established through the fully coupled finite element numerical solution of stress field and seepage field.
3. Challenges in the development of continental shale oil in China
Continental shale oil is an important strategic alternative resource for China's future oil and gas development. It is estimated that the technically recoverable shale oil resources are about 150×108 t [18]. Abundant shale oil resources are important to ensure the safety of national oil supply and support the crude oil stable production of 2×10⁸ t. However, compared with marine shale oil in North America, continental shale oil in China is characterized by diverse lithofacies types, strong heterogeneity, complex structural environment and geological characteristics, and low productivity and low productivity. There are still many challenges and problems in efficient exploration and development.
(1) Weak basic theoretical research. There are many types of continental shale oil in China, and the genetic mechanism, enrichment mechanism, occurrence mode and distribution mechanism in different petroliferous basins are different. The theory of differential reservoir formation and enrichment needs to be developed and improved. The reservoir space is complex, and the flow mechanism in multi-scale porous media under the coupling of multiple physical fields such as stress field, pressure field and temperature field still need to be further studied.
(2) Imperfect exploration and development technology system. Due to differences in geological development characteristics between continental shale oil and marine shale oil, the exploration and development technology of marine shale oil cannot be simply copied. It is necessary to explore and establish exploration and development technologies suitable for continental shale oil, such as “sweet spot” evaluation method, fracturing technology, development mode and development strategy. The reservoir characteristics and fluid characteristics of continental shale are quite different from those of conventional reservoirs, and the conventional experimental analysis technology is difficult to be fully applicable. It is better to innovate the experimental technology of continental shale to improve the accuracy of test data. The system identification and prediction technology of “sweet spot” has not been established, and the prediction accuracy and penetration rate need to be improved. It is needed to establish a multi-disciplinary, multi-method and multi-angle comprehensive prediction technology. After staged fracturing, the production rate of continental shale oil horizontal wells decreases rapidly, and the primary recovery is only 5%-10%, facing with the problem of supplementing energy and enhancing recovery.
(3) Large gap in engineering technology with foreign countries. The technical system of long horizontal well drilling and multi-stage dense cutting fracturing reconstruction of continental shale oil has been preliminarily formed in China, but the technical level is far from the advanced technology in North America. In terms of horizontal well drilling, there are many difficulties, such as high requirements for deflecting technology, difficult control of well trajectory, long construction period and so on. And in terms of fracturing reconstruction, the clay mineral content and fracability of different types of continental shale oil vary greatly, the situation of "unable to open, unable to support, low flowback and difficult to stabilize production" generally exists. Therefore, differential fracturing optimization design technology should be established.
(4) High development cost. Relying on technological progress, the breakeven cost of shale oil in North America has fallen to about US $40/bbl. In China, the development cost of shale oil with deep burial, poor physical properties and low production capacity is much higher than that in North America, which restricts the large-scale development. Continental shale oil development is a complex system engineering, which requires developing low-cost development technology and exploring management innovation and mode innovation to maximize cost reduction and efficiency increase, so as to promote the large-scale commercial development.
4. Trend of continental shale oil development
In view of the problems and development needs of continental shale oil development, it is necessary to further improve the accuracy of development evaluation through geology and engineering integration, big data and artificial intelligence applications, and make breakthroughs in shale oil enhanced oil recovery technologies to improve development effects and benefits.
4.1. Geology and engineering integration
There are many types of continental shale oil in China, and the geological characteristics and development disciplines are complex. It is difficult to evaluate the development of shale oil through a single method, it is necessary to carry out comprehensive research on the integration of geology and engineering for different types of shale oil[50]. For interbedded shale oil, the physical properties of the reservoir are relatively good, so it is necessary to focus on the research of "sweet spot" prediction and establish a fine 3D model covering the "geology + engineering" attributes of all elements of high production, so as to achieve quantitative description of high-quality reservoirs. For pure shale oil, the reservoir conditions are relatively poor, the reservoir plasticity is strong, and the engineering transformation is difficult, so the optimization of differential drilling and fracturing stimulation technology should be focused on. The mixed-type shale oil has a high content of brittle minerals, and it is necessary to strengthen the research on geophysical prediction technology of favorable lithofacies and fractures, and focus on the fracture network volume fracturing technology.
At the same time, it is necessary to strengthen the construction of geological engineering integration database and platform, build a geological engineering integration knowledge graph, establish a knowledge base for shale oil development evaluation, and establish a relationship between knowledge and data for understanding shale oil and developing shale oil. In addition, it is necessary to carry out statistical learning and data deterministic analysis based on the characteristics of shale oil development and strengthen data mining and application to discover physical laws from data and establish corresponding mathematical models.
4.2. Big data and AI applications
Seismic data, well data, and development dynamic data of continental shale oil exploration and development are relatively few and uncertain. Therefore, the application of big data and artificial intelligence technology in development evaluation should be strengthened to efficiently improve the prediction accuracy of the "sweet spot" [51].
Intelligent analysis, evaluation, and optimization technologies based on big data and deep learning should be developed. In terms of shale lithofacies recognition, core CT scan image data is used as the training data set of machine learning to train the convolutional neural network (CNN) and improve the accuracy of lithofacies prediction [52]. In terms of test interpretation, the intelligent interpretation model of reservoir physical parameters and rock mechanics parameters is established by using big data and artificial intelligence technology to improve the accuracy and efficiency of logging interpretation. In the field of geophysical exploration, the research of seismic waveform classification, seismic phase recognition, and seismic data reconstruction and interpolation based on deep learning is explored to improve the efficiency of seismic data processing and interpretation accuracy. In terms of fracturing, methods for improving fracturing effectiveness and efficiency are explored, and artificial intelligence systems using big data are established to maximize the use of well seismic and production data to optimize drilling and completion parameters. In the field of development, needs to develop accurate calculation in aspects of the productivity prediction model and decision system, using big data analysis means mining shale oil horizontal well production capacity and engineering, the relationship between geological and production factors, building capacity intelligent prediction model of fracturing horizontal well, optimization of shale oil and development technical policy parameters of horizontal well pattern deployment.
4.3. Enhanced shale oil recovery technology
Exploring different types of enhanced shale oil recovery technologies is conducive to improving the development benefits. CO2 has the functions of expanding pore volume, increasing energy, reducing viscosity and replacing crude oil. CO2 assisted fracturing technology can effectively improve the effect of reservoir reconstruction and development [53⇓-55]. However, the basic scientific questions of supercritical CO2 fracturing, such as fracture mechanism, enhanced production mechanism, reservoir multi-scale and multi-phase coupling flow mechanism, have not been solved. At the same time, the adaptability evaluation, fracturing technology, tracking and control, supporting equipment and other key technologies of supercritical CO2 fracturing also need to be further researched and optimized. Through the pilot test of injecting with natural gas or CO2, focusing on the feasibility and production mechanism of injecting natural gas or CO2 displacement and huff and puff development, and optimizing the technical policies such as reasonable injection timing, well soaking time and cycle times, so as to form the continental shale oil differential natural gas injection or CO2 injection displacement and huff and puff enhanced oil recovery technology.
5. Conclusions
Although the reserves of continental shale oil in China are large, there are great differences in geological conditions, resource quality and development characteristics compared with marine shale oil in North America. Based on the geological and development characteristics, development evaluation technologies such as favorable lithofacies identification, reservoir characterization, mobility and fracability evaluation, geological modeling and numerical simulation integrated sweet spot analysis and productivity evaluation have been preliminarily formed, which have promoted the scale benefit development of continental shale oil in China.
In China, the large-scale and efficient development of continental shale oil still faces a series of important difficulties, such as weak basic theoretical research, imperfect exploration and development technology system, large gap in engineering technology and high development cost. It is needed to strengthen the geological engineering integration and the application of big data and artificial intelligence technology, improve the accuracy and efficiency of technical prediction, and reduce technical cost. And it is also necessary to research key technologies to enhance oil recovery, improve the benefits, and then promote the "continental shale oil revolution".