

Introduction
Multi-seam co-production technology can effectively develop rich coalbed methane (CBM) resources in multi- seam areas. But with a large span, commingled production coal seams (CPCS) have differences in permeability, fluid property and reservoir pressure, resulting in inter-layer fluid flow interference, which in turn induces interlayer energy interference and reduces development efficiency [1⇓⇓-4]. According to the experience of previous CBM co-production projects in China, neighboring aquifers may recharge the CPCS during the drainage process, leading to limited range or propagation path change of pressure drop, and high water production and low gas production [5⇓⇓-8]. For example, in the southern part of the Qinshui Basin, Shanxi Province, China, the CBM co-production of the Taiyuan Formation and Shanxi Formation in the Upper Paleozoic is susceptible to communicating with the karst aquifer in the Taiyuan Formation, which may have negative effect on the co-production capacity and result in low development efficiency [9⇓-11]. The Changxing Formation to Longtan Formation in the Upper Permian of western Guizhou area have multiple coal seams with high gas content. But CBM co-production of these coal seams is susceptible to interference of shallow groundwater and surface water, and the span of the CPCS is negatively related to the gas production [12-13].
Numerous studies have focused on the identification of interference in CBM co-production interference, involving numerical simulation [14⇓⇓-17], physical simulation [18⇓⇓⇓-22], geochemical analysis of produced water [9,10,23⇓⇓ -26], and quantification of gas production contributions of different seams [27-28]. Although good in theory and scientificity, these methods have limitations in practicality and timeliness, which would postpone the timing of interference identification, thus increasing the time and economic cost of co-production wells. Given that the production data is the most readily available data in CBM field and contains rich information, if an interference discrimination method and related indexes can be constructed based on the production data, it will significantly improve the efficiency and field operability of co-production interference detection, and has the potential of promotion and application.
The western Guizhou area is an important replacement area for CBM exploration and development in China with abundant CBM resources. The Upper Permian coal- bearing strata formed in a typical marine-continental transitional environment consist of mainly fine-grained clastic rocks, and multiple sets of carbonate rocks and coal seams, with frequent sedimentary cycles and superimposed CBM-bearing systems (SCS) [29]. CBM co-production tests of CPCS in different SCS of this area had poor effect in general [30]. Based on geochemical analysis of the produced water, the authors pointed out that the surface water interference was an important factor limiting the CBM co-production capacity in the Zhijin block of western Guizhou area, and constructed a template for the identification of co-production interference and water source based on geochemical characteristics of the produced water [12-13]. In order to further improve the identification efficiency of co-production interference and promote CBM development, this study introduces production characteristic curves based on experiment and production data of the CBM co-production projects in this area, explores the dynamic response characteristics of aquifer interference on the production characteristic curves and extracts critical indexes, aiming at constructing a new method for identifying CBM co-production interference based on production characteristic curves.
1. Principle and methods
The produced water sources of CBM wells can be divided into internal water and external water. Internal water refers to the limited hydrostatic water present in the coal reservoir, as well as its floor and roof, and the output of internal water will promote reservoir depressurization and CBM desorption. External water is aquifer or surface water outside the CPCS, that is a cross-flow (cross-layer) water source with good recharge conditions and is classified as dynamic water. Mass production of external water will inhibit the effective depressurization of the reservoir, resulting in high water production and low gas production [31].
Production indication curve (PIC) is widely used in conventional oil and gas reservoir engineering, including oil reservoir PIC and gas reservoir PIC. Based on the material balance principle, it can be used to analyze the relationship between cumulative oil/gas production and reservoir pressure drop to diagnose oil/gas well production status, identify the type of energy driving the reservoir, and calculate dynamic reserves and recovery factor, etc. [32]. The PIC is rarely used in the production of CBM currently, as CBM is dominated by adsorbed gas and thus differs significantly in production behavior from free gas, so it is not appropriate to use the gas reservoir PIC for CBM production analysis. The depressurization and drainage process of CBM wells is similar to the production process of conventional gas and oil, that is the reservoir depressurizes by releasing the fluid’s own elastic energy in the drainage process. The production of fluid is accompanied by a decrease in reservoir pressure, which is a basic characteristic of the release of fluid elastic energy in oil and gas reservoirs. As a result, the PIC analysis method of unsaturated oil reservoir driven by elastic energy can be used to analyze the water production process of CBM wells, particularly the water production at the early stage of drainage. The drainage status and water source of a CBM well can be figured out from the shape and key parameters of its PIC. The difference is that CBM desorption in the reservoir will produce the gas-water two-phase flow, reducing the elastic water release capacity and causing the PIC to deviate from the original trend, which can also provide information for production analysis. Additionally, subsurface volume is typically used to plot the PIC; however, given the shallow depth of CBM wells in general and the low compressibility of water, this study ignores the effects of temperature and pressure on water volume and instead conducts its analysis using surface volume (i.e., water production).
The specific analysis steps are: (1) Gather data on water production and bottom hole pressure (BHP) since the CBM wells put into production. Remove unstable data at the beginning of water production, such as data points with differences of 10 m3/d or more in daily water production between adjacent points, non-monotonic fluctuation of BHP, and water production but no pressure drop, etc., to eliminate the influence of non-geological factors as much as possible. (2) Accumulate the daily water production to obtain the cumulative water production. Take the bottom boundary of the CPCS as the baseline, calculate the initial static pressure based on the pre-drainage wellbore fluid surface height, and deduct the BHP during drainage (including the liquid column pressure and casing pressure) from the initial static pressure to obtain the production pressure difference (PPD) (Eq. (1)). Without taking into account the pressure spread and desorption behavior in the reservoir, PPD refers to the pressure drop in the wellbore that results from the combined effect of producing both gas and water from the reservoir. (3) Plot the cumulative fluid production and PPD into a Cartesian coordinate system since the start of production to obtain the PIC [33] (Eq. (2)).
$Δp=p_{i}-p$
$Q=JΔP$
The PIC is a straight line in the early stage of drainage, representing the process of releasing the elastic energy of water within the CPCS, according to the material balance equation of a closed unsaturated elastically driven oil reservoir [33]. The line’s slope represents the elastic liquid production index, which reflects the magnitude of the elastic energy. The greater the slope, the greater the elastic energy, consequently, the higher the liquid production per unit pressure drop will be. In the later stage of drainage, the curve may deviate from the original trend in two ways: One is that the curve is concave-up due to the entry of external water, in this case the production of water can’t promote depressurization, similar to the change of oil reservoir from elastic driving to water driving; the other is that the curve is down concave, which occurs when there is no external water intrusion, and the large amount of gas production limits the water production, similar to the change of oil reservoir from elastic driving to dissolved gas driving.
It is important to note that the PIC appears as a straight line not only in the single water phase drainage stage, but also may in gas and water two-phase flow stage. This is because although the accumulation of gas in the wellbore makes the amount of water produced decrease, it also slows the PPD’s rate of growth, maintaining the relative balance between the two to some extent and forming a straight line segment. Furthermore, the injection of fracturing fluid would alter the reservoir’s original water content and pressure state. The unstable flowback stage of fracturing fluid is addressed in the preceding analysis step (1). The stable flowback fluid can be analyzed together with in-situ groundwater production, as it will cause reservoir pressure drop, and can be considered as finite elastic fluid production. Before the initial linear segment of the PIC, if there is a local nonlinear segment, it is most likely the result of engineering factors like fracturing and is not taken into account during fitting, which can reduce the influence of external fluids like fracturing fluid on the analysis results.
Based on the principle of PIC analysis, the elastic liquid production capacity of coal reservoir can be reflected by the water production per unit pressure drop, indicating the type of water source, and providing basis for co-production interference analysis. Two parameters were introduced: daily water production per unit drawdown of producing fluid level and water production per unit differential pressure. The daily water production per unit drawdown of producing fluid level is the ratio of the daily water production to the daily drop of producing liquid level (the data points with daily drop of producing fluid level less than or equal to 0 were deleted). The water production per unit differential pressure is the ratio of cumulative water production to cumulative PPD. The variation curves of the two parameters with time can be obtained by plotting the two parameters and the drainage time, respectively, into a Cartesian coordinate system, i.e., curve of daily water production per unit drawdown of producing fluid level with time (CDWP) and curve of water production per unit differential pressure with time (CWP), which are referred to as the production characteristic curves in this study along with the PIC. The three production characteristic curves are comprehensive reflections of hydrogeological parameters and drainage performance, and can objectively reflect the production status of CBM wells as well as the CPCS’s hydrogeological information. Furthermore, with the curves, the problems of comprehensive acquisition of layered hydrogeological parameters of commingled wells and direct detection of interlayer hydraulic connection can be solved. These curves provide a new method for analyzing the productivity and interference of CBM wells.
2. Key parameters
The Zhijin block is located in the Zhina coalfield of western Guizhou area. Since 2009, East China Oil & Gas Company, SINOPEC, has been conducting CBM exploration and development tests in this block, and has achieved successive breakthroughs in CBM production capacity. Six CBM wells in this area were chosen as research objects (Table 1 ), and geological and drainage data, including the CPCS, water production, gas production, casing pressure, producing liquid level, BHP, and so on, were collected and analyzed systematically. Also the pumping test data of coalfield geological exploration in the Zhijin block was gathered. The CBM wells are mainly distributed in the Zhucang and Santang sub-synclines in the Yanjiao syncline of the Zhijin block, of which Well Z-1 is located at the southern margin of the Qianxi syncline to the north of the Yanjiao syncline (Fig. 1 ). All the wells are vertical ones and developed by multi-seam separated-layer fracturing and commingled production. Based on the previous geochemical analysis of the produced water from CBM wells in the study area, the authors found that the recharge of shallow active water had an impact on the second production stage of Well Z-2 (Well Z-2-2), Well Z-1, and Well Z-S1 [23]. The Zhijin block has undulating topography, abundant precipitation, and Triassic limestone exposing to surface in large areas, which has led to the development of karst caves and underground rivers. The groundwater in this area has features like shallow circulation and short runoff distance, and is strongly affected by atmospheric precipitation [24]. The Changxing Formation in the upper part of the Upper Permian coal-bearing strata develops several limestone karst strong aquifers with a unit water inflow greater than 0.1 L/(s·m) and is in direct contact with the Triassic. The acquifers in Changxing Formation are directly recharged by precipitation, and thus the wells have seasonal variations of water level. As a result, the CBM development from the upper part is susceptible to interference from surface water. In contrast, Longtan Formation, composed of mainly fine-grained clastic rocks and interbedded limestone and coal seams, is tight and low in water content. With unit water inflows of 0.01 to 0.10 L/(s·m) and 0 to 0.01 L/(s·m), respectively, the Longtan Formation generally developed weak aquifers and relative aquifuges [34].
Table 1. Information of CBM wells in the Zhijin block |
| Well number | Fracturing and production coal seams | Geometric parameters of the production coal seams/m | Average daily production/m3 | Peak gas production/ (m3·d-1) | |||
|---|---|---|---|---|---|---|---|
| Burial depth | Maximum span | Total thickness | Water production | Gas production | |||
| Z-1 | 9, 10, 23—24 | 214-376 | 162 | 14.1 | 3.81 | 305 | 428 |
| Z-2-1 | 20, 23, carbonaceous mudstone | 407-432 | 25 | 3.2 | 0.56 | 1650 | 2772 |
| Z-2-2 | 6-1, 7, 8, 10, 12, 14, 17 | 240-389 | 149 | 6.8 | 3.51 | 387 | 770 |
| Z-3 | 14, 16 | 697-737 | 40 | 4.7 | 0.80 | 817 | 1137 |
| Z-4 | 6, 7, 17, 20, 23, 27, 30 | 283-531 | 248 | 11.7 | 1.98 | 798 | 2465 |
| Z-5 | 16—17, 20, 23, 27 | 355-426 | 71 | 7.6 | 0.85 | 1433 | 2806 |
| Z-S1 | 8—10, 14—17, 19—23, 26—27 | 270-453 | 183 | 18.4 | 23.08 | 5 | 68 |
Notes: Z-2-1 represents the first production stage of Well Z-2 (0-263 d), and Z-2-2 represents the second production stage of Well Z-2 (266-814 d); the number in the column of fracturing and production coal seams represents the coal seam number |
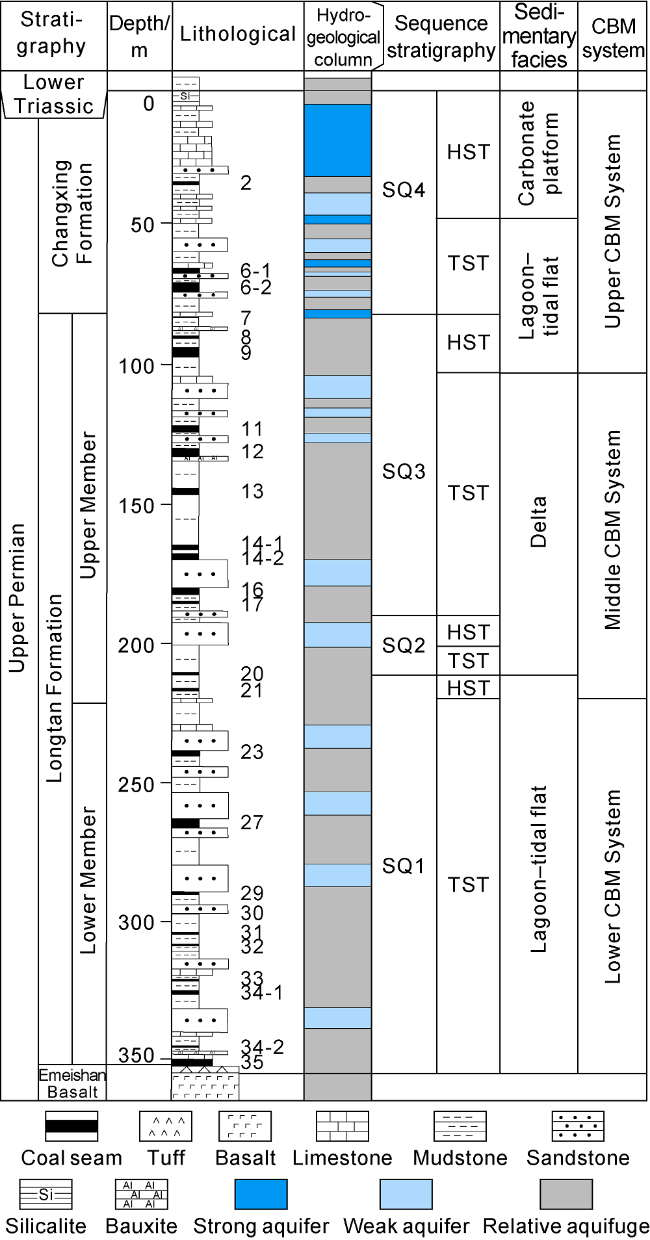
Fig. 1. Stratigraphic column of the Zhijin block (data in lithological column is the coal seam number; TST— transgressive systems tract; HST—highstand system tract; SQ—sequence). |
The maximum sea flooding surface of the third-order sequence stratigraphic framework creates tight water- and gas-barrier layers, according to the examination of the sequence stratigraphic structure and physical property cycle of the Upper Permian coal-bearing strata. The coal-bearing strata are divided into three sets of SCS, namely No. 1-9 coal seams (upper CBM system), No. 10-21 coal seams (middle CBM system), and No. 22-35 coal seams (lower CBM system), with the tight layers as boundaries [13]. Previous study has shown that the middle and lower CBM systems have good co-production compatibility [13]. The lower CBM system is referred to both the middle and lower CBM systems jointly in this study. According to previous coalfield exploration, the consumption of drilling fluid was prone to abruptly increase when drilling into the No. 6 coal seam floor and No. 7 coal seam roof, where the rocks are mostly limestone and fine sandstone, indicating strong hydrodynamic conditions of the upper CBM system.
The PIC primarily depicts the relationship between PPD and cumulative water production, with slope J denoting water production per unit differential pressure. J of a constant indicates elastic driving characteristics, a variable J reflects non-elastic driving characteristics. It is hard to gather all the hydrodynamic parameters of various horizons and precisely define the distribution of aquifers and aquifuges in mixed intervals in CBM development. The water inflow when the water level in the wellbore drops by 1 m is known as the unit water inflow of the pumping interval, which represents the total influence of the hydrodynamic factors in the interval and can be regarded as the theoretical value of the water production under the initial formation conditions. By converting the unit of unit water inflow of the coal- bearing strata with Eq. (3), the in-situ water production capacity of a CBM well not affected by hydraulic fracturing can be estimated. In Eq. (3), d1/d2 represents the ratio of the borehole’s water inlet area with the same thickness of water supply interval; and under the same water supply capacity (flow rate), the larger the water inlet area, the greater the water production is.
$P_{w}86.4q(d_{1}/d_{2})$
When the pumping test interval is dominated by coal seams, Pw can directly reflect the liquid supply capacity of the coal seams. Since the filter tube of the pumping test borehole and the production casing of CBM wells in western Guizhou are 91 mm and 132 mm in inner diameter in general, respectively, the d1/d2 value in this region is typically 1.45. The Pw was determined and relevant graphs were compiled using the unit water inflow data of the coal-bearing strata in the Zhijin block.
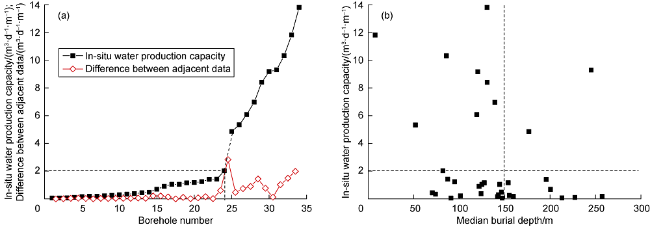
Fig. 2. The increasing sequence of in-situ water production capacity (a) and the relationship with burial depth (b). |
3. Production characteristic curves
3.1. Curve of daily water production per unit drawdown of producing fluid level with time
The CDWP demonstrates that the daily water production per unit drawdown of producing fluid level is lower than the critical value of 2 m3/(d·m) for wells Z-2-1, Z-3 and Z-5, and is higher than the critical value for wells Z-2-2, Z-1 and Z-S1 (Fig. 3 ). Wells with water production above the critical value have gas production not ideal, whose peak gas production all lower than 800 m3/d, indicating that the water production capacity has been increasing due to the recharge of external water; the wells with water production below the critical value have better production capacity with peak daily gas production higher than 1000 m3/d, indicating that reservoir water elastic energy has been attenuating in the absence of water recharge (Table 1 ).
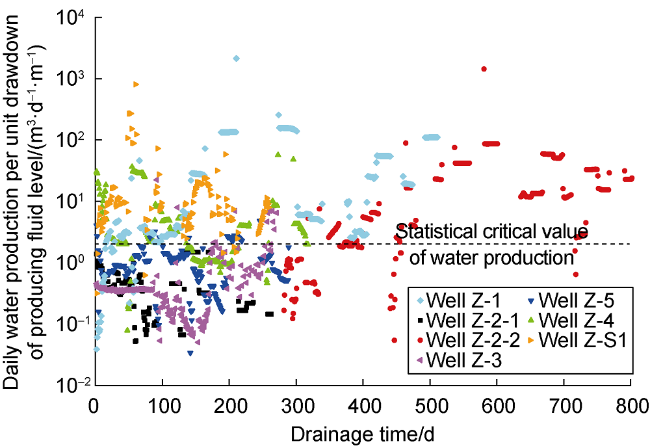
Fig. 3. Daily water production per unit drawdown of producing fluid level of CBM co-production wells. |
3.2. Production indication curve
The PIC of each CBM well is presented in Fig. 4 . PIC of Well Z-2-1 is linear (Fig. 4 a), indicating that the entire production period has a characteristic of elastic water production from a closed system, and the slope of the fitted line is 34.69 m3/MPa. PIC of Well Z-2-2 shows an obvious up-concave trend, reflecting external energy supply. Fitting of the initial linear section of the PIC of Well Z-2-2 resulted in a slope of 214.73 m3/MPa, which is much higher than that of Well Z-2-1, implying higher elastic water energy and storage volume. The curve then deviates from the linear section and upwarps, indicating that the reservoir depressurization rate slows down due to the intrusion of external water, and inhibits gas production.
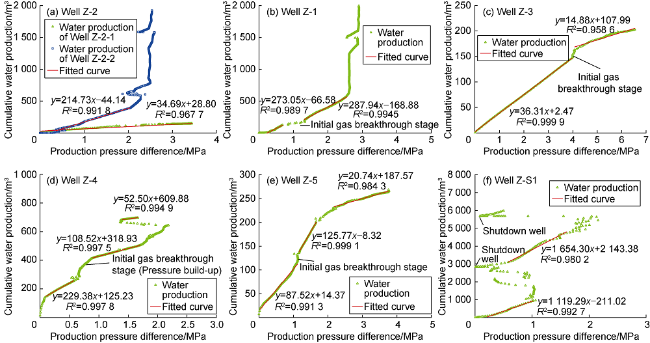
Fig. 4. Production indication curves of CBM co-production wells. |
The PIC of Well Z-1 also shows an up-concave characteristic (Fig. 4 b). Linear fitting of the straight section at the early stage of production was performed. The first section of fitted line (13-50 d) corresponds to the single- phase drainage stage before gas breakthrough, whereas the second section of fitted line (66-135 d) represents the stage of stably increasing gas production after gas breakthrough. The section between the two fitted straight lines represents the initial gas breakthrough stage. The two fitted linear sections have little difference in slopes of both greater than 200 m3/MPa, similar to that of Well Z-2-2, indicating a strong liquid supply capacity and substantial elastic energy of reservoir internal water. The curve that follows the second linear section rises steeply, with the water production maintained at more than 3 m3/d, and the gas production maintained at roughly 300 m3/d. The pressure drop cannot spread effectively due to an external energy supply, and the desorption range and gas supply capacity are limited.
The PIC of Well Z-3 has a two-stage feature (Fig. 4 c), of which the first section of fitted line corresponds to thesingle-phase drainage stage before gas breakthrough and the second section of fitted line corresponds to the stage after gas breakthrough. The second section of fitted line has weaker linear correlation and down-concave characteristic, which is caused by a decrease in the water-phase permeability due to gas output, similar to the stage of dissolved gas separating out after the pressure drop below saturation pressure in a closed oil reservoir. The section between the two fitted lines represents the initial gas breakthrough stage. The two fitted lines have lower slopes both less than 50 m3/MPa, indicating that the elastic energy of the water is limited. The slope of the second section of fitted line is lower than that of the first section of line, indicating a reducing water production capacity after gas breakthrough. The production coal seams of Well Z-3 are characterized by deep burial depth, small number and small spacing between each other, and no aquifer interference.
The PIC of Well Z-4 is complicated due to the large span and quantity of the CPCS. The PIC shows three stable fitted line sections, with slopes decreasing in turn (Fig. 4 d). The first section of fitted line corresponds to the single-phase drainage stage before gas breakthrough, while the second and third sections of fitted line correspond to the low (421 m3/d) and high (1979 m3/d) gas production stages, respectively. The sharp decline in the PPD before the third section of fitted line (299-311 d) is due to an abrupt rise in casing pressure. Combined with the production history analysis, the producing fluid level was 293 m at 300 d of drainage, and the No. 6 and No. 7 coal seams were already exposed and the gas and water output was limited. At this point, the increase of casing pressure and fluctuation of the PPD were originated from strong desorption of the lower coal seams, and then the well reached the peak gas production of 2465 m3/d. The first section of fitted line of Well Z-4 has a slope similar to that of wells Z-2-2 and Z-1, reflecting the high elastic water energy and water storage capacity of the upper system with the characteristic of higher water production. The third section of fitted line has a slope close to that of Well Z-2-1, reflecting the characteristics of the lower CBM system with strong closure degree, low water production and high gas production. Although CPCS of this well straddle the upper and lower CBM systems, the lower CBM system is dominant, and the main part of the CPCS is over 300 m deep. As a result, the aquifer’s interference is constrained. Additionally, the geochemical analysis of the produced water revealed that coal seam water was the source water in the latter stage of drainage (which corresponds to the third section of fitted line) [13]. Moreover, the lower CBM system directly entered into the sensitive desorption stage following initial desorption, leading to a sharp increase in the gas production rate, which is a common production characteristic of the shallow CBM wells in western Guizhou Province[36].
The PIC of Well Z-5 has three fitted line sections (Fig. 4 e): the first one corresponds to the single-phase drainage stage before gas breakthrough; the second one corresponds to the slow increase stage of gas production, where the gas production is less than 400 m3/d, and the casing pressure is kept at about 0.5 MPa; and the third one represents the high- and stable-gas production stage, where the peak gas production reaches 2806 m3/d with gradually decreasing casing pressure. The slope of the first section of fitted line is less than 100 m3/MPa, and the water production of this well is less than 2 m3/d. The slope of the second section of fitted line increases, due to the gradual increase in gas production at this stage, and casing pressure holding leads to a slowdown in the increase of PPD. The third section of fitted line has a low slope, with gas production more than 1000 m3/d, and drastic drop of water production to less than 1 m3/d. The PIC of this well presents a down-concave shape and has a slope less than 200 m3/MPa for each linear segment, indicating the produced water comes from the elastic water storage inside the coal-bearing strata without recharge by aquifers.
The PIC of Well Z-S1 fluctuates sharply (Fig. 4 f), and the well was shut down twice during the production process. Both the slopes of the two sections of fitted lines are above 1000 m3/MPa, and the slope of the second sections of line is 1654 m3/MPa, which indicates that the production is extremely unstable and the drainage is out of control. The intrusion of external water is significant during drainage, resulting in the ineffective spread of pressure drop and extremely low gas production.
3.3. Curve of water production per unit differential pressure with time
Calculated with cumulative data, the CWP can effectively weaken the fluctuation of single-day production and interference of engineering factors, making the curve clearer in shape and geological implications (Fig. 5 ). Assuming that the pressure of a 100 m water column is about 1 MPa, the critical value of the in-situ water production capacity of the coal seam established based on the pumping test corresponds to the critical value of water production per unit differential pressure of 200 m3/MPa. The CWP of wells Z-2-1, Z-3, and Z-5 are essentially below the critical value and exhibit a declining tendency over time. In contrast, the CWP of wells Z-2-2, Z-1, and Z-S1 are essentially above the critical value and exhibit an increasing tendency over time. The CWP of Well Z-4 is generally above the critical value, but shows a decline trend on the whole. As previously mentioned, Well Z-4 has the features of a dual gas production stage, and the first stage of production is much longer than the second stage, resulting in the overall high water production. With the prolong of the gas production time of the second stage, it is anticipated that its water production per unit differential pressure will drop below the critical value.

Fig. 5. Curves of water production per unit differential pressure of CBM co-production wells. |
3.4. Classification of production characteristic curves
The PIC responds well to different production stages and can successfully differentiate the drive types and produced water sources, but it is unable to reflect the impact of drainage time. The CDWP and CWP can directly reflect the evolution characteristics of water production and its energy over time. The former one has more obvious responses to single-day production fluctuations and engineering disturbance, while the latter one is more beneficial in illustrating the overall dynamics of drainage and has a clearer curve form, enabling the accurate identification of wells with and without external water interference.
Based on the CWP shapes, co-production wells can be divided into two groups: (1) up-concave type, including wells Z-2-1, Z-3, Z-4, and Z-5; and (2) down-concave type, including wells Z-2-2, Z-1, and Z-S1 (Fig. 5 ). The up-concave type curve shows that the water production per unit differential pressure progressively declines over time and then stabilizes at a low level, signifying the gradual consumption of water energy. For wells with this type of curve, the produced water comes from the CPCS’s limited elastic water storage, which facilitates the pressure drop expansion. These wells have an average gas production higher than 800 m3/d, a peak gas production higher than 1000 m3/d, and an average water production lower than 2 m3/d. The down-concave curve shows that the water production per unit differential pressure gradually rises over time and tends stable at a high level, signifying the energy replenishment of active water source outside the CPCS, which is not conducive to pressure drop expansion. The wells with this type of curve have an average gas production less than 400 m3/d, a peak gas production less than 800 m3/d, and an average water production higher than 3 m3/d.
The gas production and water production per unit coal thickness of co-production well can better characterize the production release degree and multi-seam co-production efficiency. The wells with down-concave curves have a lower limit of average water production per unit coal thickness of 0.25 m3/(d·m), while the wells with up-concave curve have lower average water production per unit coal thickness than this value. The wells with up-concave curve have a lower limit of average gas production per unit coal thickness of 70 m3/(d·m), while the wells with down-concave curve have a gas production per unit thickness lower than this value (Fig. 6 ).
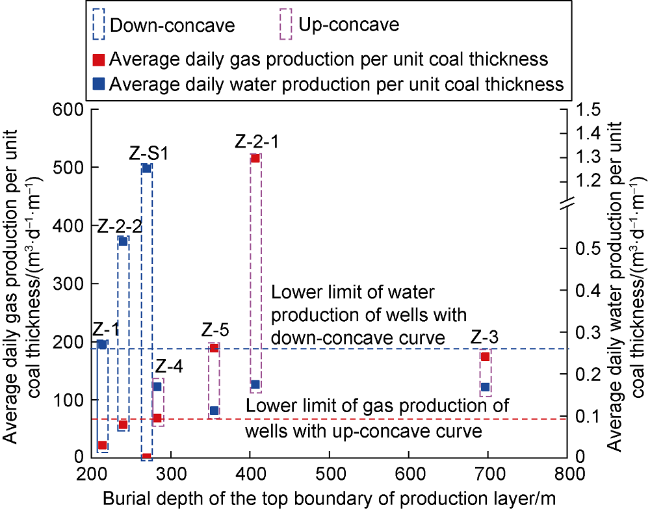
Fig. 6. Gas and water production per unit coal thickness of different types of co-production wells. |
In general, the down-concave PIC corresponds to the up-concave CWP, with fitted linear sections decreasing in slope in turn, representing non-interference well producing internal water; the up-concave PIC corresponds to the down-concave CWP, with fitted linear sections increasing in slope in turn, representing interference well producing external water. The maximum PPD of interference wells is less than 3 MPa, and that of non-interference wells is greater than 3 MPa. According to this trend, the PPD of the third section of fitted line of the PIC for Well Z-4 will likely surpass 3 MPa with the prolong of drainage period. It can be seen that the production of external water will limit the pressure drop, increase the abandon pressure, and reduce the CBM recovery factor.
4. Discrimination of co-production interference
The discrimination method and critical indexes of aquifer interference of CBM co-production based on the production characteristic curves are shown in Table 2 . The critical values of water production indexes in this table are only applicable to the Zhijin block in western Guizhou province, as different regions have different hydrogeological conditions and elastic water supply capacity. Critical values for interference discrimination in other regions need to be further explored according to the method proposed in this study. By contrast, the morphological types of PIC and CWP have certain universality for the discrimination of aquifer interference, which can provide reference for other regions.
Table 2. Discrimination method and critical indexes of CBM co-production interference |
| Types | qw/ (m3·d-1·m-1) | PIC | CWP | ||
|---|---|---|---|---|---|
| Shape | k0/(m3·MPa-1) | Shape | J/(m3·MPa-1) | ||
| Non-interference well | ≤2 | 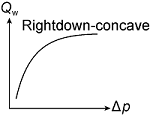 | Right down-concave ≤200 | 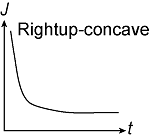 | Right up-concave ≤200 |
| Interference well | >2 | 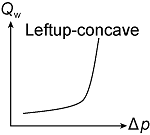 | Left up-concave >200 | 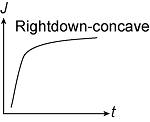 | Right down-concave >200 |
In order to verify the rationality of the critical indexes, the slope of the initial linear section of the PIC and the average daily gas production per unit coal thickness are put into a scatter plot and then nonlinear fitted to get a negative exponential relationship curve (Fig. 7 ). The fitted curve’s curvature equation and its first derivative were calculated, and the maximum point (stagnation point) of the curvature equation was obtained, which denotes the inflection point of the fitted curve. The fitted curve tends to be stable and remains at a low level beyond this point. The slope of the initial linear section of the PIC and the average gas production per unit coal thickness corresponding to this point are 196.20 m3/MPa and 70.70 m3/(d·m), respectively, which are highly consistent with the critical values of the above discrimination indexes, confirming the rationality of the method and the indexes mathematically.
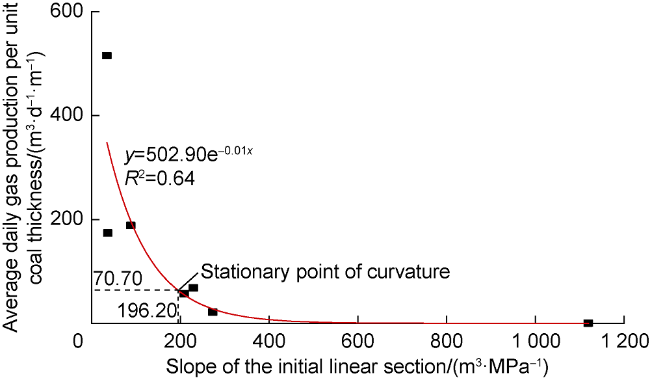
Fig. 7. Rationality proof of critical indexes for interference discrimination of CBM co-production. |
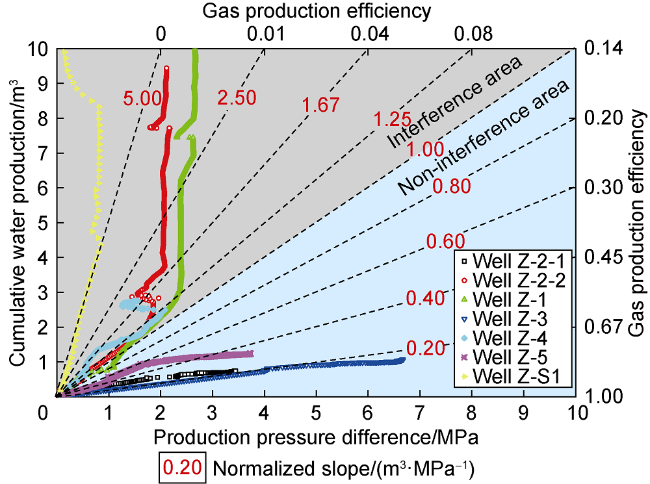
A discrimination template was constructed to improve the application efficiency of the research results. The cumulative water production was divided by 200, to make the critical value of the slope of the initial linear section of the PIC be 1 m3/MPa. Accordingly, the template can be divided into interference area with a slope greater than 1 m3/MPa and non-interference area with a slope less than 1 m3/MPa. The average daily gas production per unit coal thickness corresponding to each normalized slope in the template can be predicted by the fitted equation in Fig. 7 . In addition, the upper limit value of gas production per unit coal thickness can be determined from the fitted equation at 502.90 m3/(d·m). The predicted value of average daily gas production per unit coal thickness corresponding to each normalized slope was divided by this upper limit value to obtain the corresponding gas production efficiency (Table 3 ). The maximum value of gas production efficiency is 1, which represents the theoretical value when the slope is 0, and means the optimal daily gas production per unit coal thickness in an absolute ideal state when no water is produced. However, the actual gas production efficiency is definitely lower than this value [37]. Finally, the discrimination template of CBM co-production interference is formed, which also can be used to predict gas production (Fig. 8 ). The gas production efficiency in the interference area is less than 0.14 because the strong invasion of external water prohibits the gas production capacity. The data of the CBM wells were projected into the template, and the curves in the interference area and non-interference area show two morphological types with the slope of 1 m3/MPa as boundary: up-concave and down-concave. The classification results are basically consistent with those in Fig. 6 . Due to the characteristics of the dual gas production stage, Well Z-4 has an exception, which is speculated that the curve of its second gas production stage will enter into the non-interference area with drainage going on.
Table 3. Gas production efficiencies corresponding to different slopes |
| Normalized slope/ (m3·MPa-1) | Actual slope/ (m3·MPa-1) | Predicted gas production per unit coal thickness/ (m3·d-1·m-1) | Gas production efficiency |
|---|---|---|---|
| 0 | 0 | 502.90 | 1.00 |
| 0.20 | 40.00 | 337.10 | 0.67 |
| 0.40 | 80.00 | 225.97 | 0.45 |
| 0.60 | 120.00 | 151.47 | 0.30 |
| 0.80 | 160.00 | 101.53 | 0.20 |
| 1.00 | 200.00 | 68.06 | 0.14 |
| 1.25 | 250.00 | 41.28 | 0.08 |
| 1.67 | 334.00 | 17.82 | 0.04 |
| 2.50 | 500.00 | 3.39 | 0.01 |
| 5.00 | 1000.00 | 0.02 | 0 |
Fig. 8. Template for discriminating interference of CBM co-production (red data represents the normalized slope). |
In the actual discrimination, it indicates that the drainage is abnormal when the early stable water production data is located in the interference area of the template. And it represents the invasion of external water when the later stage curve is further upturned. The gas production efficiency can be determined based on the slope of the initial linear section, to judge the severity of aquifer interference, and then CBM development plans such as the CPCS alteration and water plugging can be timely adjusted accordingly. If the curve is downturned in later stage, it indicates that the abnormality of water production weakens or even disappears and no further invasion of external water takes place. This may be due to the limited recharge capacity of aquifer, or the alteration of gas producing system (e.g., Well Z-4), and or the full backflow of fracturing fluid. Wells with these features are likely to have high gas production in the future, and the current production plan can be maintained for further observation. The end point of the initial linear section is the key to the discrimination, and the deviation form of the subsequent curve can be used as the exact basis for the diagnosis of water invasion and dynamic development plan adjustment.
The gas production efficiency in the template is only applicable to the study area. When the template is applied to other regions, the data normalization processing should be carried out first based on the analysis of the in-situ water production capacity when the template is applied to other regions. Then the relation between the slope of the initial linear section of PIC and the average daily gas production per unit coal thickness should be determined in light of the specific geological conditions. Finally, the gas production efficiencies corresponding to different slopes can be predicted. The method proposed in this study has good applicability in areas with frequent transitions of sedimentary facies in coal-bearing strata, complex reservoir-caprock assemblages and hydrogeological structure, and multiple SCS. It can effectively identify water intrusion caused by differences in hydrodynamic systems and the influence degree on CBM production efficiency.
5. Conclusions
A comprehensive analysis method of CBM production characteristic curves, including PIC, CDWP and CWP, has been constructed. Based on the unit water inflow data of pumping test boreholes, it is determined that the critical value of in-situ water production capacity of CBM wells in the study area is 2 m3/(d·m). It indicates that the drainage is interfered by external water when the daily water production per unit drawdown of producing fluid level of CBM well is higher than 2 m3/(d·m) for a long time, which will affect the CBM co-production efficiency. Different CBM wells are significantly different in the morphological type and slope of the initial linear section of PIC, reflecting different water production states and energy driving types. Two types of water sources can be distinguished in coal-bearing strata based on the critical value (200 m3/MPa) of the slope of the initial linear section of PIC: internal water and external water. The CWP can be divided into two types according to their shapes. The up-concave type represents the non-interference well, which produces internal water within the reservoir; the down-concave type represents the interference well, which produces external water from aquifers.
The method and critical indexes for identifying CBM co-production interference based on the production characteristic curves have been established. A template for discriminating interference of CBM co-production has been made combined with the gas production efficiency analysis, which also can be used to predict production. It can provide a scientific basis for the optimization of CBM co-production in the Zhijin block of western Guizhou, and can also provide references in ideas and methods for the efficient development of CBM in other areas. The critical indexes have regional limitations, while the morphological types of production characteristic curves have higher universality in indicating aquifer interference. Efficient discrimination of CBM co-production interference for specific geological conditions in different areas can be realized by combining the critical indexes and the curve shapes. The application effect and applicability of the method in other regions should be further tested and optimized in the future.
Nomenclature
d1—CBM wellbore diameter, m;
d2—pumping borehole diameter, m;
J—fluid production per unit differential pressure, m3/MPa;
k0—slope of the initial linear section of production indication curve, m3/MPa;
p—measured bottom-hole pressure during drainage, MPa;
pi—initial static pressure before drainage, i.e. the original reservoir pressure, MPa;
Pw—daily water production when the producing fluid level of CBM well drops by 1 m converted from the unit water inflow, m3/(d·m);
q—unit water inflow, L/(s·m);
qw—daily water production per unit drawdown of producing fluid level, m3/(d·m);
Q—cumulative fluid production, m3;
Qw—cumulative water production, m3;
t—drainage time, d;
Δp—production pressure difference, MPa.