

Introduction
According to the thermal maturity of organic matter, continental shale oil can be divided into medium-high mature shale oil and low-medium mature shale oil [1]. The enrichment of medium-high mature shale oil depends on the quantity and quality of retained hydrocarbons in the shale, which is closely related to thermal maturity of organic matter, hydrocarbon expulsion efficiency of source rocks and the preservation conditions of the shale roof and floor (also known as sealing). The moderate thermal maturity of organic matter (Ro of shale in freshwater lacustrine facies is more than 0.9%, Ro of shale in saline lacustrine facies is more than 0.8%), the quantity of retained hydrocarbons (S1) is more than 2 mg/g (the best is more than 4 mg/g), intervals with gas-oil ratio (GOR) is more than 80 m3/m3 (the best is more than 150 m3/m3), medium-high mature shale oil enrichment economy is good[2]. Low-medium mature shale oil is re-lated to the super-rich accumulation degree of organic matters (TOC>6%, preferably more than 8%), the proportion of untransformed organic matters and the continuous distribution scale of organic matter super-rich shale. The higher abundance of organic matter and the greater proportion of untransformed organic matter, the stronger material basis for transformation into hydrocarbons under in-situ heating conditions, the larger amount of "artificial" petroleum (including light oil and natural gas), and the higher the economic exploitation value.
For the Chang 73 shale of Triassic Yanchang Formation in the Ordos Basin, the total organic carbon (TOC) is high, mainly 5%-25%, with a maximum of 38% and an average of 13.8%; the organic matter is mainly type I-II1, with Ro of 0.7%-1.2%, which is in the range of oil window stage. The favorable distribution areas of rich organic matter shale is 4.3×10⁴ km2, with the maximum thickness of 60 m and average thickness of 16 m, which have favorable conditions for forming shale oil resources of medium-high mature shale oil and low-medium mature shale oil [2⇓-4]. Exploration and research [5-6] have shown that the seventh member of Triassic Yanchang Formation (Chang 7 Member) in the Ordos Basin is the main source rocks of discovered and undiscovered oil reserves, and a large amount of oil reserves are accumulated in sandstone with low porosity and low permeability in Chang 4-Chang 9. By the end of 2021, the total proved reserves were 72.08×10⁸ t in the basin. Close to the main source rock of Chang 7, Chang 6 and Chang 8 have the largest discovered reserves, and the proven reserves are 42.27×10⁸ t accounting 58.6% of the total proved reserves. In addition, the Qingcheng Oilfield was discovered in the tight sandstone of Chang 71-2 close to the Chang 73 organic-rich shale, with the proved reserves of 10×108 t. These reserves were mainly expelled from the major source rock of Chang 7, especially Chang 73. Therefore, the hydrocarbon expulsion efficiency has great impacts on the quantity and quality of retained hydrocarbons and the economic recoverability of shale oil in the Chang 73 shale, and it must be considered in the evaluation of medium-high mature shale oil zone.
Although a large quantity of petroleum hydrocarbons have been expelled to form large-scale reserves, the Chang 73 shale is so abundant in organic matter to enable it to form "artificial" oil and gas through in-situ heating when the organic matter transformation ratio is low, that is, there are still considerable untransformed organic matters in the shale. This is the so called low-medium mature shale oil, or "underground refinery" [7]. Obviously, the organic matter transformation ratio is also an important control factor for evaluating the major enrichment type of shale oil.
In addition, the sealing conditions of the Chang 73 organic-rich shale play an important role in the expulsion of petroleum hydrocarbons, the quantity and quality of retained hydrocarbons, and especially the maintenance of light hydrocarbon components. It is an important factor controlling the major enrichment type of shale oil, but has not been fully studied. The hydrocarbon expulsion efficiency of the Chang 73 organic-rich shale in the Ordos Basin has been discussed in many studies [8⇓-10], but its control on the major enrichment type of shale oil has been rarely reported and evaluated. In this paper, the organic matter transformation ratio, hydrocarbon expulsion efficiency and preservation conditions of shale roof and floor (sealing conditions) are analyzed. Then, the major enrichment types of shale oil in the Chang 73 are evaluated in order to identify the major types of shale oil as early as possible in the early stage of exploration, so as to reduce exploration costs.
1. Geochemical characteristics of Chang 73 shale
During the deposition of Chang 7, a set of sedimentary association dominated by black shale and mudstone of semi-deep to deep lake facies was developed, mainly spreading from northwest to southeast in the lake basin center (Fig. 1 a), with an area of approximately 6.5×10⁴ km2. This sedimentary association is characterized by large area, large thickness and stable distribution. Two types of source rocks, black shale and dark mudstone, are developed in Chang 73 [4,11], which are significantly different in abundance, type of organic matter and fabric of rock, allowing their different positions in shale oil resources. The Chang 73 organic-rich shale contains lamellation [12] and has a high abundance of organic matter (TOC of 5.1%-38.4% or 13.8% on average), which are mainly type I-II1, with S1 of 1.5-15.6 mg/g (avg. 5.6 mg/g), S2 of 8.9-128.4 mg/g (avg. 54.7 mg/g), a hydrogen index (HI) of 130-707 mg/g (avg. 356 mg/g), and Ro of 0.7%-1.2%, indicating the stage of oil generation peak. According to the geochemical indexes, the Chang 73 shale has the basic conditions for forming medium-high mature continental shale oil. The dark mudstone in the same interval has a low TOC value (2%-5%, or 3.75% on average) and the organic matters of mainly type II1-II 2, with S1 of 1-4 mg/g (avg. 2.2 mg/g), S2 of 4-20 mg/g (avg. 9.5 mg/g), average HI of 300 mg/g, and presence of massive bleeding. In summary, the abundance and type of organic matter, the amount of retained hydrocarbon and the proportion of untransformed in dark mudstone are lower than those in black shale, and lamellation is unrich in ark mudstone, therefore it is not the best lithology for shale oil resources, no matter the medium-high mature shale oil and low-medium mature shale oil[13]. Additionally, different from Chang 71-2, Chang 73 is rich in shale but not rich in sandstone or siltstone, with the shale oil sourced from and preserved in the same set of black shale, showing the characteristics of in-situ retention. We term this kind of shale oil with the source rock and reservoir in the same set of shale and existing in organic-rich shale as pure shale oil [2].
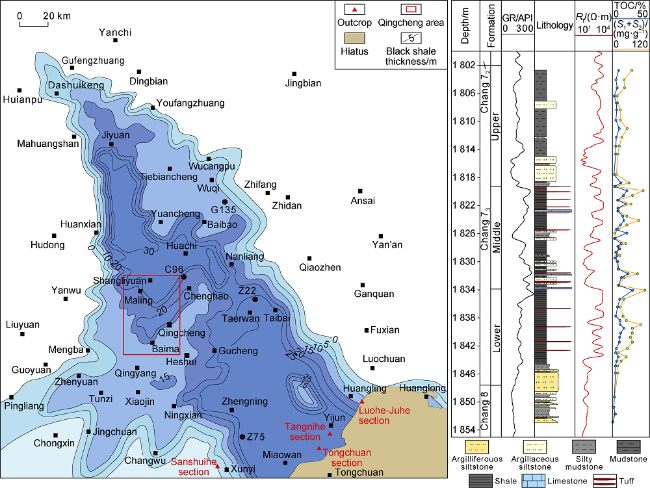
Fig. 1. Distribution of organic-rich shale [4] (a) and stratigrpahic column (b) in Chang 7, Ordos Basin. |
The distributions of organic matter abundance and type and retained hydrocarbon content of the Chang 73 shale vary greatly in different areas of the Ordos Basin (Table 1 and Fig. 2 ). Overall, both TOC and S1 increase towards the south, while HI is high in the north and south and low in the middle. The organic matter is mainly type I and II1 in the north and south, and type II 1 in the middle. The degree of thermal evolution also varies in different areas: Ro is generally lower than 0.7% in the northeast and southwest, and ranges from 0.7% to 1.2% in most parts of the central area [14-15].
Table 1. Geochemical characteristics and mineral composition of Chang 73 shale in different areas of the Ordos Basin |
| Area | TOC/% | S1/ (mg·g-1) | S2/ (mg·g-1) | HI/ (mg·g-1) | Mineral composition/% | Ro/% | Organic matter type | |||
|---|---|---|---|---|---|---|---|---|---|---|
| Felsic mineral | Carbonate | Pyrite | Clay | |||||||
| Dingbian- Jiyuan | 5.1-17.0 (9.2) | 2.0-4.8 (3.3) | 12.6-75.7 (30.3) | 130-707 (366) | 18.3-51.4 (38.2) | 0-14.8 (5.1) | 0-19.3 (5.3) | 37.6-73.4 (51.4) | 0.50-1.06 (0.83) | I—II1 |
| Huanxian- Qingcheng | 6.1-29.4 (15.5) | 1.5-6.7 (3.6) | 8.9-94.7 (39.5) | 136-403 (245) | 7.9-92.3 (42.6) | 0-45.4 (5.3) | 0-29.9 (6.1) | 3.9-83.1 (46.0) | 0.75-1.21 (1.00) | II1 |
| Heshui- Zhengning | 5.3-38.4 (17.0) | 2.3-15.6 (8.3) | 16.4-128.0 (75.7) | 169-639 (443) | 33.0-66.0 (40.5) | 0-10.2 (3.7) | 0-32.3 (12.3) | 16.1-60.4 (41.2) | 0.68-0.87 (0.76) | I—II1 |
| Tongchuan outcrop | 5.5-35.3 (15.8) | 0.6-8.5 (3.9) | 18.5-221.0 (105.8) | 331-767 (564) | 37.0-76.0 (51.2) | 0-6.6 (1.1) | 0-19.6 (10.6) | 20.7-40.3 (36.2) | 0.46-0.56 (0.49) | I—II1 |
Note: The numbers in the brackets are the average values. |
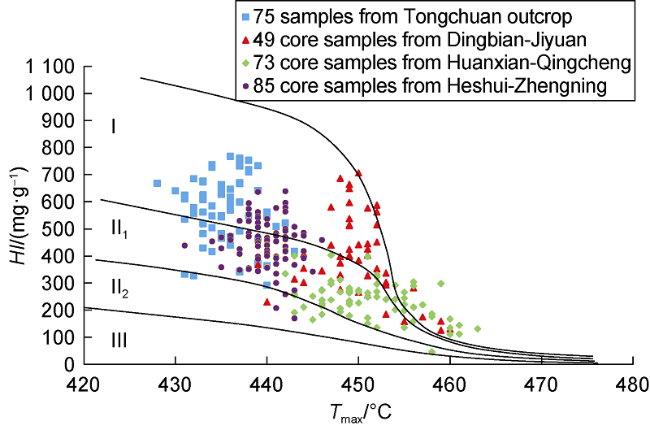
Fig. 2. Correlation between HI and Tmax of Chang 73 in different areas of the Ordos Basin. |
2. Hydrocarbon transformation ratio of Chang 73 shale
The transformation ratio is used to measure the proportion of organic matter converted to hydrocarbons during thermal maturity, which means that the percentage of organic matter converted into hydrocarbons in the total organic matter. It can be expressed by the proportion of the amount of generated hydrocarbons to the total hydrocarbon amount of the source rock [16]. Generally, the transformation ratio increases with the increase of maturity and sapropel maceral content, which means that the amount of the unconverted organic matter becomes less and less. Since it is difficult to accurately recover the amount of the original organic matter, the transformation ratio is usually represented by the ratio of the amount of generated hydrocarbons to the total amount of hydrocarbons generated through complete conversion.
Alternatively, it can be expressed by the petroleum potential (S2) relative to the initial petroleum potential (S). In this paper, the material balance method is utilized to calculate the transformation ratio. This method considers the unconvertible carbon, and uses the weight loss correction factor to modify the calculation and ensure more objective results [17⇓-19].
${{T}_{R}}=\frac{S-{{S}_{2}}{{\delta }_{cf}}}{S}\times 100 \%=\left[ 1-\frac{HI\left( 1200-\frac{H{{I}_{0}}}{1-{{\delta }_{pi0}}} \right)}{H{{I}_{0}}\left( 1200-\frac{HI}{1-{{\delta }_{pi}}} \right)} \right]\times 100 \%$
According to the pyrolysis data of Chang 73 shales with different maturities collected from outcrops and downhole, the relationship between the hydrogen index and Tmax can be established (Fig. 2 ), so as to obtain the original hydrogen index (HI0) of type I and II1 organic matters, as well as its corresponding δpi0 value. Then these values are substituted into Eq. (1) to calculate the transformation ratio. The outcrop samples were taken from Tongchuan (Table 1 ), with Ro values ranging from 0.46% to 0.56%; HI0=820 mg/g and δpi0= 0.03 for Type I source rock, while HI0=591 mg/g and, δpi0= 0.06 for Type II1 source rock.
The transformation ratio is calculated for samples from Well G135 in the north, Well C96 in the middle and Well Z75 in the south of the Ordos Basin (Fig. 3 ). To ensure the representativeness of the calculation results, 33-36 data points were determined for each well, and samples were taken at 0.5-1.0 m intervals. There are 106 data points in total. Generally, the transformation ratio ranges from 20% to 80%. It increases rapidly with the increase of maturity in the low maturity to oil window stage, and grows slowly in the high maturity stage (Tmax>455 °C, corresponding to Ro>1.0%). In the low maturity stage (Tmax<440 °C, corresponding to Ro<0.7%), the transformation ratio is low, mainly 20%-40%, with an average of 30%. In the oil window stage, the rate changes greatly, mainly 25%-65%, with an average of 45%. From the per-spective of regional distribution, the transformation ratio is also quite different from area to area. In Wuqi in the north, where Ro is 0.75%-0.90%, the rate is 41%. In Huachi-Qingcheng in the middle, where Ro is relatively high (0.8%-1.1%), the average transformation ratio is 65%. In Heshui-Zhengning in the south, where Ro is 0.65%-0.80%, the average transformation ratio is 35.3%. In the south, the shale is thick (avg. 20-25 m), with a high abundance of organic matter (avg. 15.3%), a large distribution area and a high proportion of shale volume. The Chang 73 shale exhibits the average Ro of 0.7%-0.9% and the overall transformation ratio of less than 45%, meaning that more than 50% of the organic matters have not been converted into oil and gas and mostly exist as solid to semi-solid hydrocarbons in shale. This indicates that the Chang 73 shale has a huge potential for forming "artificial" oil and gas through in-situ conversion. It deserves high attention in evaluation on enrichment type and exploration potential of shale oil.
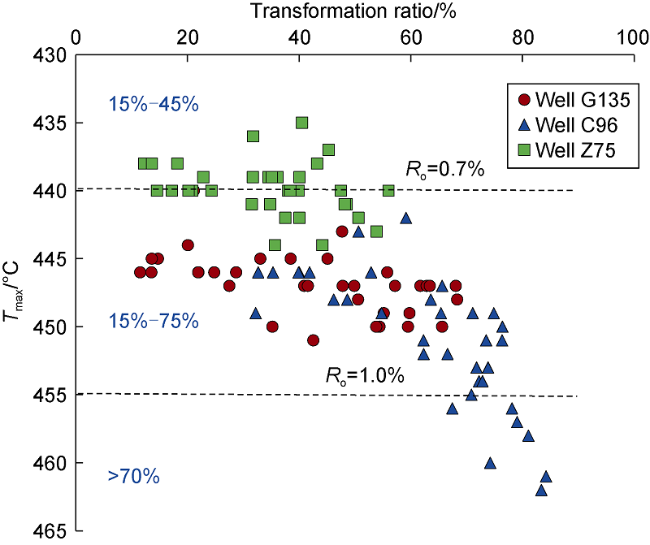
Fig. 3. Correlation between organic matter transformation ratio and Tmax in Chang 73 shale, Ordos Basin. |
3. Hydrocarbon expulsion efficiency of Chang 73 shale
Hydrocarbon expulsion efficiency (E) is an index to measure the expulsion capacity of hydrocarbons from the source rock, and a parameter reflecting the conversion capacity of organic matters in the source rock [9,20 -21]. The factors that determine the hydrocarbon expulsion efficiency include the type, abundance and thermal maturity of organic matters, as well as the assemblage of source rock and reservoir and the preservation conditions of the roof and floor of source rock. The hydrocarbon expulsion efficiency directly affects the quantity of retained hydrocarbons in the source rock. Under the same conditions, the lower the hydrocarbon expulsion efficiency, the greater the quantity of retained petroleum hydrocarbons, and the greater the shale oil resource potential is [22⇓-24]. The hydrocarbon expulsion efficiency is an important item in the evaluation of the "sweet spot" area/interval of shale oil.
Scholars have reported different calculation methods of hydrocarbon expulsion efficiency [8-9,15,25⇓⇓⇓⇓ -30]. Chen et al. [9] calculated the hydrocarbon generation potential and expulsion efficiency of major source rocks in several basins in China using the material balance method based on the conventional pyrolysis analysis data, and expressed the hydrocarbon generation and expulsion characteristics of the source rocks with the cumulative hydrocarbon expulsion efficiency (El) and the relative hydrocarbon expulsion efficiency (Ex). The former refers to the ratio of the quantity of hydrocarbons expelled cumulatively to the total hydrocarbon generation potential, which is of great significance to the assessment of retained hydrocarbons in the source rock and the remaining hydrocarbon generation potential. The latter refers to the ratio of the quantity of hydrocarbons expelled cumulatively to the total quantity of petroleum hydrocarbons generated under the current maturity, which is of great significance to the evaluation on the contribution of generated oil and gas to reservoir formation.
Chen et al. [9] pointed that, for lacustrine source rocks containing type I-II organic matter, when Ro=0.9%-1.0% (covering the Chang 7 source rocks in the Ordos Basin), the cumulative hydrocarbon expulsion efficiency is 50%- 60%, and the relative hydrocarbon expulsion efficiency is 60%-90% (Table 2 ); when Ro>1.3%, these two parameters are 80% and >90%, respectively. This result is on the high side, for the reason that the lost hydrocarbon has not been recovered. We made pyrolysis gas chromatography (PY-GC) on the Chang 73 shale, showing that lots of C2-8 light hydrocarbon components occur in the shale. Qian et al. [31] performed experiment on the shale core and confirmed that C14- components are significantly lost in half a year, with the loss up to 30%-80% and increasing with time.
Table 2. Hydrocarbon expulsion efficiency of Chang 7 shale in Ordos Basin |
| Ref. | Method | Sample | Hydrocarbon expulsion efficiency/% | Influence factor |
|---|---|---|---|---|
| [8] | Simulation experiment | Excellent source rock, TOC>5%, Ro=0.90%-1.15% | 60%-90%, avg. 80% | TOC |
| Others, TOC<5%, Ro=0.90%-1.15% | 30%-70%, avg. 43.7% | |||
| [25] | Simulation experiment | Organic-rich shale, TOC≥6% | Avg. 77.3% | Lithology, TOC |
| Mudstone, TOC<6% | Avg. 42.7% | |||
| [9] | Material balance | Ro=0.9%-1.0% | El=50%-60%, Ex=80%-90% | TOC, OG type and Ro |
| Ro=1.3% | El=75%-85%, Ex>90% | |||
| [15] | Material balance | Ro=0.8%, Type I | 35% | Ro |
| Ro=0.8%, Type II | 20% | |||
| Ro=1.1%, Type I | 65% | |||
| Ro=1.1%, Type II | 56% | |||
| [27] | Material balance | TOC>10% | Avg. 80% | TOC |
| TOC=2%-10% | Avg. 60% | |||
| [30] | Material balance | TOC=1.9%-17.2%, avg. 6.7% | Avg. 80% | Lithology, TOC |
| [28] | Hydrocarbon- generation potential method | Ro=1.0% | ˃60% | TOC, Ro |
| [29] | Hydrocarbon- generation potential method | TOC=0.4%-9.6%, avg. 2.4% | Avg. 42.5% | Lithology, Ro |
Zhang et al. [8] calculated the cumulative hydrocarbon expulsion efficiency of Chang 7 shale by simulation experiment, and indicated that the cumulative hydrocarbon expulsion efficiency of organic-rich shale (TOC>10%) could reach 80% on average. Although the simulation experiment can be done to directly obtain the quantity of hydrocarbons generated and expelled from source rock in order to directly calculate the hydrocarbon expulsion efficiency, the high temperature during the experiment will result in evaporation effect, which will change the hydrocarbon usually in liquid phase underground into gas phase. This change of phase will lead to an overestimation.
Guo et al. [28] used the hydrocarbon generation index to calculate the hydrocarbon expulsion efficiency of Chang 7 shale. With this method, the hydrocarbon expulsion threshold and quantity are analyzed depending upon the variation of the ratio of (S1+S2)/TOC with maturity. Their results show that the average hydrocarbon expulsion efficiency is 60%. This method does not consider the loss of light hydrocarbons in S1. Furthermore, data sets obtained from samples of different wells and depth should be normalized to deal with the differences in the organic matter type and thermal maturity; otherwise, the results can only reflect the general change trend [32].
In this paper, the material balance method is used to calculate the hydrocarbon expulsion efficiency of the Chang 73 shale, considering the available pyrolysis parameters and the probability to eliminate the calculation error by calculating the hydrocarbon expulsion efficiency of each sampling point to understand the difference of hydrocarbon expulsion efficiency under geological conditions. According to the definition of hydrocarbon expulsion efficiency mentioned above, three main parameters, i.e. initial hydrocarbon generation potential (S), quantity of retained hydrocarbons (S1*) and quantity of residual hydrocarbons (S2), are required to calculate the cumulative hydrocarbon expulsion efficiency and relative hydrocarbon expulsion efficiency. The current quantities of hydrocarbons generated and expelled can also be obtained by the three parameters. Specifically, S and S2 can be obtained by Rock-Eval, while S1* needs to be calculated by recovering the quantity of lost hydrocarbons on the basis of Rock-Eval data.
In order to acquire the amount of hydrocarbon retained in underground shale, a sealed coring well of Chang 73 shale in the north of Heshui was selected. Its average Ro is 0.9%, representing the real maturity of this area. After the core samples were taken from the well, they were immediately frozen with -196 °C liquid nitrogen and transported to the laboratory. Then, the samples were crushed with a hermetic pulverizer at 5 °C. Meanwhile, the gaseous hydrocarbon (Sg) was detected. The crushed samples were pyrolyzed in multiple temperature steps, and the quantities of volatile hydrocarbons (S0), light hydrocarbons (S1-1) and medium hydrocarbons (S1-2) were measured at 90, 200 and 300 °C, respectively. Finally, these four values were added to obtain the amount of retained hydrocarbon (S1*) (Fig. 4 a).
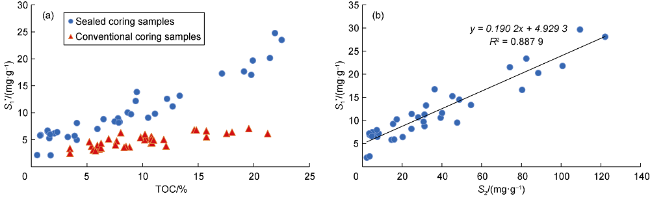
Fig. 4. Correlation between pyrolysis data, TOC and S2 of sealed coring samples and conventional coring samples of Chang 73 shale. (a) Correlation between retained hydrocarbons and TOC obtained by different methods. (b) Correlation between S1* and S2 during pyrolysis of sealed coring samples. |
Comparison shows that S1* obtained by the above method is 1.5-4.0 times of S1 obtained by the conventional pyrolysis on cores, and the hydrocarbon loss increases with the increase of organic matter abundance. For shale with TOC<5%, the calculation results in this paper are similar to those obtained by conventional pyrolysis method, with a hydrocarbon loss about 0.5 times of the conventional pyrolysis value. For shale with TOC> 10%, the maximum hydrocarbon loss can reach 5-15 mg/g, 2.5 times of the conventional pyrolysis value. The quantity of retained hydrocarbons under the formation conditions corresponding to Chang 73 shale with average TOC of 13.8% can reach 13.3 mg/g. The loss has a great influence on the calculation of quantity and efficiency of hydrocarbon expulsion (Fig. 4 a).
A linear relationship between the residual hydrocarbon generation (S2) and the retained hydrocarbons (S1*) was established considering the abundance of organic matter to recover the hydrocarbon loss in conventional pyrolysis analysis (Fig. 4 b), showing the square of correlation coefficient of 0.89. This relationship can be used to calculate the quantity of original hydrocarbon retained in shale of other wells with similar maturity.
According to the maturity of Chang 73 shale in the deep lake, the representative wells G135 and C96 with full coring in the Chang 73 are selected to calculate the hydrocarbon expulsion efficiency of the Chang 73 shale by Eqs. (2) and (3). And the hydrocarbon generation potential per unit of organic carbon is used to calculate the hydrocarbon expulsion efficiency [9-10,21] in order to avoid the impact of organic matter abundance on the calculation and ensure a better understanding of the role of organic matter types in hydrocarbon expulsion. The results are shown in Fig. 5 .
${{E}_{l}}=\frac{{{Q}_{p}}}{S}=\frac{S-{{S}_{2}}-{{S}_{1}}^{*}}{S}$
${{E}_{x}}=\frac{{{Q}_{p}}}{{{Q}_{s}}}=\frac{S-{{S}_{2}}-{{S}_{1}}^{*}}{S-{{S}_{2}}}$
where Qp is the quantity of hydrocarbons expelled and Qs is the quantity of hydrocarbons generated. The calculation shows that the El of Chang 73 shale is generally low, mainly 10%-40%, with an average of 27.5%, and the Ex is generally high, mainly 40%-80%, with an average of 60% (Fig. 5 ). The calculation results are lower than those reported in the previous studies, because the proposed method takes the lost hydrocarbon into account, which ensures more objective calculation of the hydrocarbons actually retained in the formation. This result is consistent with the previous understanding that the transformation ratio of Chang 73 shale is relatively low.
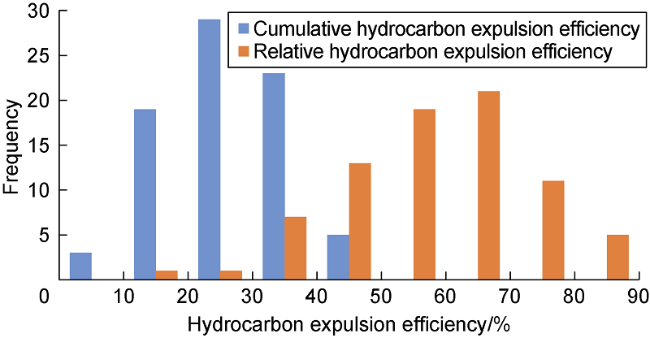
Fig. 5. Histogram of cumulative and relative hydrocarbon expulsion efficiencies of Chang 73 shale. |
4. Effect of sealing conditions of Chang 73 shale on the quantity and quality of retained hydrocarbons
As mentioned above, the El of Chang 73 shale is less than 30% on average, and the average transformation ratio of organic matter is less than 50%, which indicates that more than 70% of total amount of original organic matter (including unconverted organic matter and transformed residual hydrocarbons) is still left in the source rock. Because the TOC of Chang 73 shale is very high (greater than 13.8% on average), the total quantity of organic matters left in the formation is very large. If appropriate in-situ conversion process is adopted, the quantity of "artificial" petroleum hydrocarbons formed can be very large. Given the calculated Ex (40%-80%, or 60% on average) of Chang 73 shale, the quantity of hydrocarbons retained in the source rock can reach 40% of the quantity of hydrocarbons generated. Therefore, if the remaining hydrocarbons are all left in the source rock, the potential of medium-high mature shale oil cannot be underestimated. In fact, the factors determining the recoverability of retained hydrocarbons in source rocks are not only the quantity of retained hydrocarbons, but also the quality and occurrence of retained hydrocarbons.
The lithological combinations consisting of source rock and reservoir play an important role in controlling the hydrocarbon expulsion efficiency, and have an important impact on the quality of retained hydrocarbons (mainly the quantity of light and medium components of hydrocarbons). Pure shale exhibits poor porosity and permeability, and unsmooth channels for hydrocarbon expulsion [33]. In particular, the hydrocarbon expulsion efficiency in the middle of thick shale is lower. For example, the two intervals (1819-1826 m and 1835-1844 m) in the middle-lower section of Chang 73 shale of Well G135 are thick (greater than 7 m) and pure shale, with El of only 15%-25% and Ex of only 40%-55% (Fig. 6 ). The 1825-1833 m shale in the middle section of Chang 73 is interbedded with siltstone, with El of 30%-40% and Ex of 50%-75%, 15%-20% higher than that of pure shale. The same results were reported by many other scholars. Li [34] studied the hydrocarbon expulsion of the Paleogene mudstone in Huanghua Depression, Bohai Bay Basin, and suggested that the thick lacustrine mudstone is not conducive to hydrocarbon expulsion, and exhibits the oil expulsion efficiency of generally 25%-40%. Hou et al. [33] investigated the hydrocarbon expulsion efficiency of Shahejie Formation shale in Dongying Depression, and also found that the thicker the shale is, the lower the hydrocarbon expulsion efficiency is.
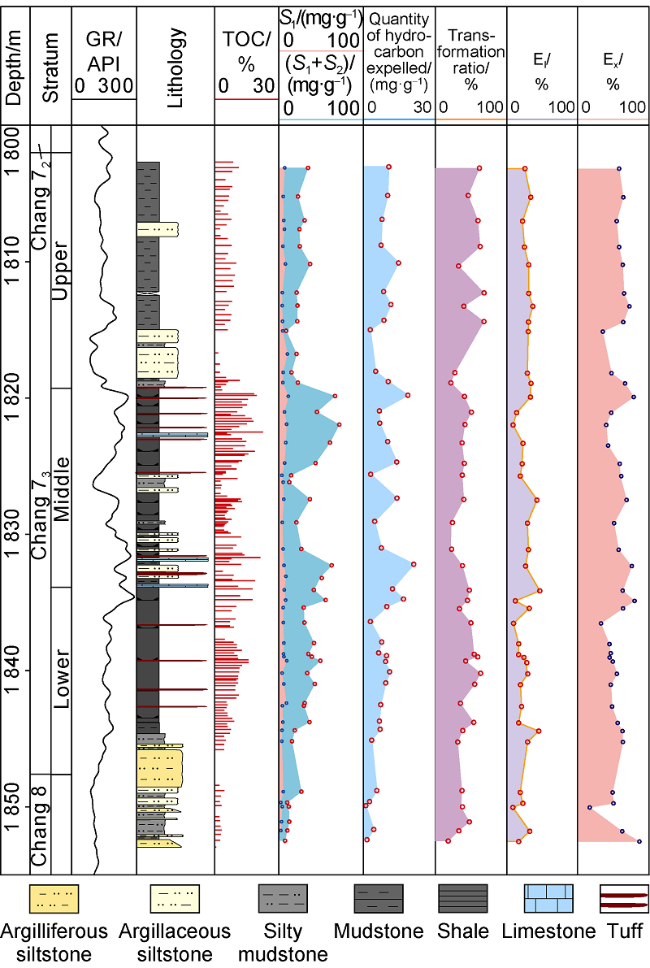
Fig. 6. Pyrolysis geochemical parameters and hydrocarbon expulsion efficiency of Chang 73 shale of Well G135. |
The existence of faults and fractures in shale is another important factor controlling the hydrocarbon expulsion efficiency. It plays an important role in the retention of hydrocarbons in shale, especially light hydrocarbons. This is well illustrated by the statistical analysis of Well Z22 in the middle of the basin. According to the interpretation of cross-well seismic profile, Well Z22 is located near the fault zone, and some faults have broken through the Jurassic stratum. Previous studies show that the peak period of hydrocarbon generation and expulsion in Chang 73 shale occurred from late Jurassic to early Cretaceous, which is basically consistent with the fault activity period. The calculation shows that the hydrocarbon expulsion quantity and efficiency of Chang 73 shale of Well Z22 are relatively large. Among the three wells G135, C96 and Z22, Well Z22 has the highest hydrocarbon expulsion quantity, which is twice that of the other two wells given the same TOC. The Ex also shows similar characteristics. Well Z22 has the highest Ex, with an average of 85% (Fig. 7 ), which is significantly higher than the other two wells. This shows that the existence of faults and fractures will destroy the sealing of shale, thereby improving the amount and efficiency of hydrocarbon expulsion from shale.
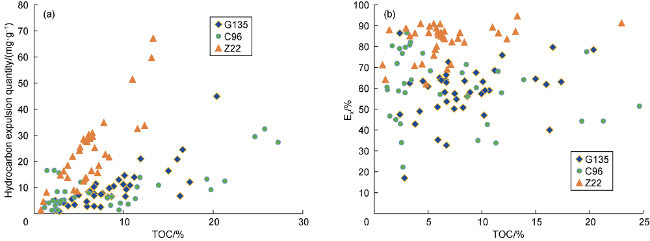
Fig. 7. Quantity (a) and relative efficiency (b) of hydrocarbon expulsion vs. TOC at different locations in Chang 73 shale. |
The above analysis shows that the sealing conditions of shale play an important role in the quantity of retained hydrocarbons, but also have great impact on the composition of retained hydrocarbon, that is, the quality of retained hydrocarbons. The roof and floor of Chang 73 shale in the Ordos Basin are respectively Chang 71-2 and Chang 8 tight sandstones, with the overlying Chang 6 sandstone with larger distribution range and thickness. Large-scale oil reservoirs have been formed in the areas with good porosity and permeability conditions, which mainly come from the Chang 73 shale. The thickness of organic-rich shale, the existence of faults and fractures, and the formation pressure in the Chang 73 shale were analyzed to comprehensively judge whether the Chang 73 shale has the enrichment conditions for medium-high mature shale oil. According to 3D seismic data, Qingcheng area, where tight oil is developed in Chang 71-2, has multiple groups of fault systems mainly in NE direction and NW direction. The NE trending faults are unevenly distributed in a "forest belt" shape (Fig. 8 ), which is the main channel for a large number of hydrocarbons generated in Chang 73 shale to migrate to Chang 71-2 reservoirs and the overlying Chang 6 and even Chang 4+5 to form oil reservoirs. On the one hand, the hydrocarbon expulsion conditions of Chang 73 shale are very good, which can ensure the formation of considerable tight oil reserves. On the other hand, the sealing conditions of the roof and floor of Chang 73 shale are poor, which could cause more movable hydrocarbons to be difficult to maintain in the shale, and is unfavorable to the enrichment and economic recoverability of pure shale oil.
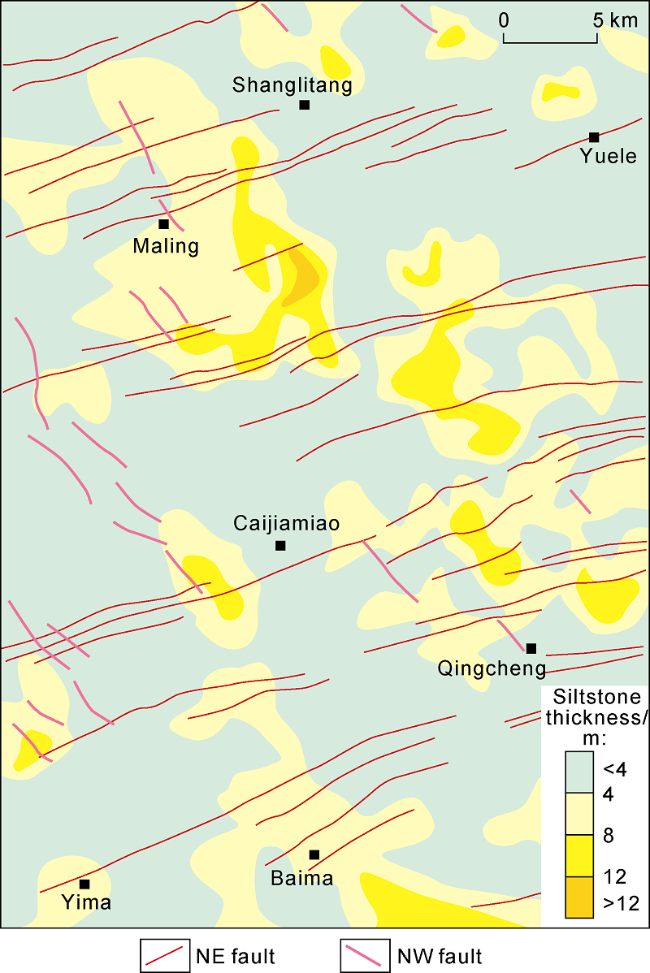
Fig. 8. Faults and siltstone distribution of Chang 7 and Chang 73 in Qingcheng area, Ordos Basin (see |
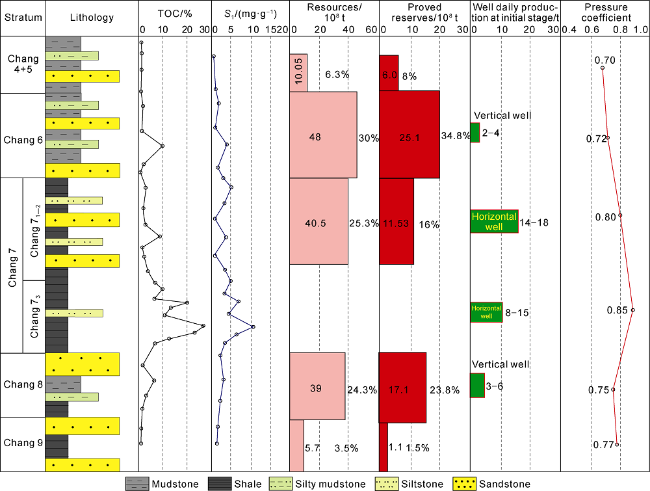
According to the current analysis on the hydrocarbon composition of shale oil in Chang 73, although the proportion of light and medium components is not low, the main peak carbon is C11-C15 (Fig. 9 a), which is mainly due to the high abundance of organic matter in the shale and the large amount of hydrocarbon adsorption. The Chang 73 shale has high organic matter abundance (average TOC of 13.8%), which could greatly adsorb light and medium hydrocarbon. Therefore, in the absence of good sealing conditions, a certain proportion of light and medium hydrocarbon could remain in the shale. On the one hand, the evidence supporting this understanding comes from a large number of rock pyrolysis and extraction data. Although the organic-rich shale core (TOC>10%) of Chang 73 shale has been stored for nearly 10 years, the hydrocarbon component of S1 from core pyrolysis is still dominated by C5-C12. In the total hydrocarbon chromatography of shale extract, normal alkanes smaller than C15 are dominant (Fig. 9 b). If these light components are free hydrocarbons, it is possible that light hydrocarbons smaller than C8 have been lost. By contrast, the hydrocarbon components from core pyrolysis and extract of shale with low organic matter abundance (TOC<6%) are mainly C12-C28, and there is basically no light hydrocarbon with carbon number smaller than C8, indicating that the light components have been lost due to relatively weak adsorption of low organic matter content. In addition, the shale pyrolysis S1 of Cretaceous in Gulong of Daqing Oilfield and Paleogene in Shengli Oilfield also mainly consists of C10+ [36⇓-38], and the light free hydrocarbon has been lost. Furthermore, statistics show that the Chang 73 shale is generally under negative pressure, with the pressure coefficient of 0.80-0.85, and the pressure of other formations is lower (Fig. 10 ), which indicates that the sealing of the roof and floor in Chang 73 shale is not good. From the perspective of hydrocarbon expulsion efficiency and the quantity of retained hydrocarbons, the Chang 73 shale should have abnormal high pressure. The negative pressure anomaly of Chang 73 shale is mainly attributed to two aspects. First, there are many faults and fractures in the shale layer, which have destroyed the sealing of the shale roof and floor. Second, the uplifting at the end of the Cretaceous period caused the denudation of the stratum to be 1000-2000 m [39]. The uplifting also led to the unloading of formation pressure, which causes a large number of free light hydrocarbons to be lost due to volume expansion. In addition, the thickness of the organic-rich shale concentration section of Chang 73 shale is only 20-30 m (Fig. 1 ), and the upper and lower parts are permeable sandstones (Fig. 10 ). This lithological combination is very conducive to the formation of oil reservoirs in the sandstones near the roof and floor, but not conducive to the retention of considerable movable hydrocarbons, especially light to medium hydrocarbons, in the source rock of Chang 73 shale. A part of light to medium petroleum hydrocarbons can only be retained by the adsorption of organic matter, and their mobility is not good. These factors will affect the single well production and cumulative oil recovery of shale oil in Chang 73, which must be considered when evaluating the main enrichment type of shale oil in Chang 73.
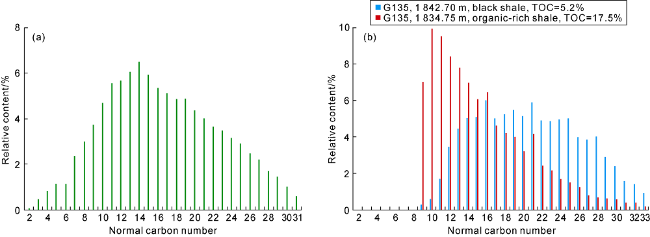
Fig. 9. Chromatogram of normal alkanes in (a) shale oil and (b) shale extract of Chang 73 in Qingcheng area, Ordos Basin. |
Fig. 10. Geochemical characteristics, resources and proved reserves of tight oil-shale oil in Yanchang Formation of Ordos Basin. |
5. Main enrichment type of shale oil in Chang 73
As described above, pure medium-high mature shale oil in Chang 73 is not the main enrichment type. In order to achieve a high well production and cumulative recovery, tight sandstone reservoir areas in Chang 6, Chang 8 and Chang 71-2 should be avoided, and wells should be arranged in the areas where faults and fractures are not developed and the roof and floor conditions are good. According to the discovered oil reservoirs, the tight oil fields of Chang 6 and Chang 8 are mainly distributed in Qingcheng, Jiyuan and Huachi, while the tight oil shale oil of Chang 71-2 is mainly distributed in Heshui-Qingcheng and northern Wuqi. According to the statistics of shale oil testing results of Chang 7, some vertical wells in West Huachi-Gengwan area have obtained high oil production, about 4.5-21.7 t/d (avg. 12.5 t/d). However, in this area, oil reservoirs are not recovered in other formations, and Chang 7 contains very thick (larger than 30 m on average) organic- rich shale, suggesting relatively favorable sealing conditions. It is a favorable area for exploration of pure shale oil.
Although a large quantity of petroleum hydrocarbons has been formed and discharged from the Chang 73 shale, and considerable oil reserves have been formed in several intervals of the Yanchang Formation, a large amount of petroleum hydrocarbons and untransformed organic matter are still retained in the shale [1-2]. The calculation results in this paper show that more than 50% of the organic matters in the Chang 73 shale have not been converted into hydrocarbons, and nearly 70% of the organic matters and retained hydrocarbons are still in the shale formation, indicating that the main enrichment type of shale oil in Chang 73 is mainly medium-low mature shale oil, especially in areas with large shale thickness, high TOC and relatively low thermal maturity, such as Heshui-Zhengning area in the south. It is necessary to research a development mode different from the horizontal well plus volume fracturing, and make use of the underground in-situ heating transformation to strive to a commercial breakthrough. Based on the evaluation of laboratory analysis data, the total technically recoverable quantity of "artificial" petroleum for underground in-situ conversion of Chang 73 shale is about (350-400)×108t, showing a huge resource potential. It is urgent to actively prepare the in-situ conversion technology through pilot tests and find out the resource recoverability and the distribution of enrichment areas. In 2016, Shell in-situ transformation laboratory completed two sets of thermal simulation experiments for Chang 73 shale. For the core samples, which have TOC of 23.7%, Ro of 0.82%, and HI of 347 mg/g, the simulation results show that the oil production of 1 t shale is 36 kg, and the gas production is 22.5 m3. For the outcrop samples, which have TOC of 24.7%, Ro of 0.51%, and HI of 405 mg/g, the simulation results show that the oil production of 1 t shale is 52 kg, and the gas production is 26 m3. The oil products are light oil. In addition, the in-situ conversion pilot test on Colorado Green River shale by Shell was successful, which not only verified that the manufacturing process of underground in-situ conversion heater was mature, the production process was complete and the technology was feasible, but also verified the rationality of laboratory parameters and the feasibility of resource prediction. All these indicate that the underground in-situ heating development of medium-low mature shale is technically feasible, and the generated pollutants are basically left underground, facilitating environmental protection. Due to poor sealing conditions of pure medium-high mature shale oil, the hydrocarbons remaining in the shale mostly exist in an adsorbed state, with poor liquidity. It is difficult to predict the cumulative recovery of a single well with good economy. In the future, it is necessary to explore the shale with good sealing conditions in Chang 73, avoiding the known oil and gas accumulation areas, fault zones and fracture areas of Chang 71-2, Chang 8 and Chang 6.
6. Conclusions
By the material balance method, the transformation ratio of organic matter in Chang 73 shale is calculated to be 20%-80%, with the average larger than 50%. The lower the maturity, the lower transformation ratio is. The results show that more than 50% of the organic matters have not transformed to hydrocarbons, that is, more than 70% of the organic matters are still in the shale. Thus, the Chang 73 shale has a great potential to form "artificial" oil.
By the sealed coring, the retained hydrocarbons in underground shale are determined to be 5-15 mg/g, with an average of 13.3 mg/g, 1.0-2.5 times of the conventional pyrolysis value. For Chang 73 shale, the El obtained by the material balance method ranges from 10% to 40%, with an average of 27.5 mg/g, and the Ex ranges from 40% to 80%, with an average of 60 mg/g, which are lower than the results in previous studies. This indicates a huge quantity of retained hydrocarbons in Chang 73. However, due to the high organic matter abundance and poor sealing conditions, the retained hydrocarbons in the shale are mostly in an adsorbed state, with poor liquidity, which will affect the economic recoverability
The Chang 73 shale is characterized by porous and permeable sandstones at the roof and floor, the existence of faults and fractures, poor sealing conditions and negative formation pressure, which are not conducive to the enrichment of shale oil with good mobility. It is determined that pure medium-high mature shale oil is not the major enrichment type. It is recommended to explore the shale areas with large thickness and good sealing conditions, avoiding the known oil and gas accumulation areas, fault zones and fracture areas of Chang 71-2, Chang 8 and Chang 6. For example, the West Huachi-Gengwan area is a favorable area
Low-medium mature shale oil is the major enrichment type of shale oil in Chang 73. It is urgent to strengthen the basic theoretical research and pilot test of in-situ conversion and confirm the resource availability and enrichment areas/intervals, so as to contribute the future large-scale development and utilization of resources.
Acknowledgements
We appreciate the Exploration and Development Research Institute of PetroChina Changqing Oilfield Company for providing many research materials and help in this work.
Nomenclature
E—hydrocarbon expulsion efficiency, %;
El—cumulative hydrocarbon expulsion efficiency, %;
Ex—relative hydrocarbon expulsion efficiency, %;
GOR—gas-oil ratio, m3/m3;
HI—hydrogen index, mg/g;
HI0—original hydrogen index, mg/g;
Qp—hydrocarbon expulsion quantity, mg/g;
Qs—hydrocarbon generation quantity, mg/g;
Ro—thermal evolution degree, %;
S—initial petroleum potential, mg/g;
S0—quantity of volatile hydrocarbons in multiple temperature step pyrolysis, mg/g;
S1—quantity of retained hydrocarbons in conventional pyrolysis, mg/g;
S1-1—quantity of light hydrocarbons in multiple temperature step pyrolysis, %;
S1-2—quantity of medium hydrocarbons in multiple temperature step pyrolysis, %;
S2—quantity of residual hydrocarbons in conventional pyrolysis, mg/g;
S1*—quantity of retained hydrocarbons in multiple temperature step pyrolysis with sealed coring and low-temperature hermetic pulverization, %;
Sg—quantity of gaseous hydrocarbons in low-temperature hermetic pulverization, mg/g;
TOC—total organic carbon, %;
Tmax—maximum temperature in pyrolysis, ℃;
TR—organic matter transformation ratio, %;
δcf—weight loss correction factor, dimensionless;
δpi—S1/(S1+S2) value in the current maturity condition, dimensionless;
δpi0—S1/(S1+S2) value in the original maturity condition, dimensionless.