

Introduction
Natural gas hydrates (NGHs), also referred to as combustible ice, are ice-like crystalline supramolecular clathrate compounds composed by natural gas and water molecules at high pressure and low temperature. They mainly occur in continental permafrost areas, polar areas, and marine sediments where water depth is over 300 m[1⇓-3]. NGHs are characterized by extensive distribution, tremendous amount of resources and clean combustion, so they are regarded as the unconventional energy resource with the highest development prospects. Globally proven NGH reserves are estimated to be (1.8-2.1)×1016 m3 of methane [1⇓⇓⇓-5]. It is estimated that the potential of NGH exploration in China’s offshore areas is tremendous. In the 11 potential NGH development zones in the South China Sea, the conservative estimate of NGH resources is about 680×108 t [2].
NGH reservoirs are characterized by shallow burial, unconsolidation, and low cementation, and their occurrences are complex, which brings great challenges in quantitative evaluation and safe exploitation. In recent years, China has made rapid progress in experimental simulation, geophysical prospecting, and developement of gas hydrates. Qingdao Institute of Marine Geology, and Guangzhou Institute of Energy Conversion, Chinese Academy of Sciences have built geophysical simulation and experimental apparatus for gas hydrates, and have conducted early investigation to the acoustic characteristics and hydrate saturation of hydrate-bearing sediments[6⇓⇓⇓-10]. The research team of CNOOC led by Academician Zhou Shouwei, studied the occurrence form and reservoir-forming characteristics of NGHs in the deep-water area of the South China Sea and invented a novel NGHs exploitation approach - solid fluidization recovery of NGHs [3], which represents a vital breakthrough to production test of marine NGHs.
As one of the key geophysical prospecting techniques, well logging is undoubtedly an effective approach for both qualitative identification and quantitative evaluation of NGH reservoirs. Numerous studies have been performed by global researchers in recent years to develop well-logging techniques for interpretation and evaluation of NGHs. Collett et al. and Manabu et al. analyzed the NGH responses in resistivity, AC and GR logs[11-12]. Tian et al. developed the well-logging response characteristics of various NGH accumulation types, such as hydrate-rich, self-generation and self-storage coal-type, pore-type, and bedding-type models [13], based on the well-logging data from the test wells for the NGH scientific drilling program in Qilian Mountain permafrost. Wang et al. calculated the NGH saturation on Site SH2 in the Shenhu area using resistivity log, and discussed the calculated errors of NGH saturations when the electrical parameters a, m, and n are taken different values [14]. Hesse et al. and Schulz et al. proposed to identify NGH reservoirs and compute NGH saturation in accordance with the anomaly of chloride ion mass concentrations[15-16]. Lee et al. investigated NGH saturation estimation based on nuclear magnetic resonance (NMR), resistivity, and formation water salinity of NGHs well-logging and core data from Alaska northern continental slope, and analyzed the differences in the calculation results with different methods[17]. Mo et al. further developed the NGH saturation calculation method based on chloride ion concentrations and proposed to first compute the apparent formation resistivity via the Archie equation, then the chloride ion mass concentration using the apparent formation resistivity, and at last, the NGH saturation using the chloride ion concentration [18]. Ma et al. simulated and analyzed the variation of parameters of the NGH saturation model, with the help of the digital core technique [19]. Chen et al. experimentally investigated the electrical characteristics of gas hydrates using the hydrate formation generation and resistivity measurement system independently designed by Guangzhou Institute of Energy Conversion, and found the obvious non-Archie feature of the saturation-resistivity relation of hydrate-bearing sediments [20]. Furthermore, Chen et al. further studied the resistivity characteristics of NGH-bearing sediments via numerical simulation based on the fractal pore model [21]. Tang performed research on the resistivity of samples including natural cores collected from Qilian Mountain permafrost and manmade cores, based on synthetic gas hydrate experiments. Lin et al. and Zhao et al. studied the reliability of calculating natural gas saturation using sonic data [22-23]. Moreover, the same method has been applied to the quantification of hydrate saturation by Yang et al. [24]. Xie et al. analyzed the formation models of NGHs in different types of pores using NMR data and quantified NGH saturation using the Indonesia equation [25].
Based on literatures of NGH saturation calculation, two conclusions could be drawn. One is that hydrate saturation evaluation based on resistivity log is the most fundamental method applied most widely, although various other NGH saturation calculation methods have been developed, e.g., the ones based on chloride ion concentration and NMR log. The other is that core experiment, numerical simulation, and theoretical analysis demonstrate the electrical characteristics of NGH reservoirs are highly non-Archie in most cases, due to complex states and spatial distribution of hydrates in reservoirs. Consequently, fully taking into consideration the non-Archie behavior of hydrates, developing a precise saturation calculation model, and accurately determining the model parameters are the key to improving the precision of well-logging evaluation of NGH saturation.
We started the research on the well-logging evaluation method for NGH saturation as early as 15 years ago, and “the method and device for determining saturation of NGH reservoirs” was patented (No. ZL201310512178.X). Moreover, the first author of this paper delivered a presentation titled “Logging interpretation model and equation of gas hydrate saturation” in the international seminar of “Fine-grained sedimentary system and unconventional resource” held by AAPG in 2013 and published our research results in the form of abstract [26]. To perfect our theoretical method, in-depth research on the electrical conductivity mechanism of NGH reservoirs and analysis, interpretation, and evaluation method based on experimental data was further carried out. As a result, quantitative evaluation methods were presented for NGH saturations in different occurrence states, and effectively improved the precision of both well-logging interpretation and NGH reserve estimation. By investigating the differences between our developed equation and conventional equations (e.g., Archie equation), we can accurately determine the occurrence state of NGHs. This provides a well-logging analysis basis for determining the development method of hydrate at the later stage.
1. Experiments and data analysis
It is commonly known that hydrocarbon saturation, defined as the percentage of the pore volume occupied by hydrocarbons to the total pore volume, directly determine the reserve of oil and gas. Therefore, hydrocarbon saturation is one of the key parameters for well-logging evaluation. For conventional reservoirs of sedimentary rocks (clastic rock, carbonate rock, and shale) and magmatic rocks (volcanic rock and igneous rock), the experimental method to measure rock saturation is summarized below: First, the core sample is displaced by pumping into oil and gas after fully saturated with formation water. Then the resistivity index grows with hydrocarbon saturation increasing. The practice for assessing saturation is just the opposite. In other words, saturation is calculated from the resistivity index measured through well logging. For NGHs in pores of consolidated sandstone, the NGH saturation is defined to be the percentage of NGH volume to pore volume, which is consistent with hydrocarbon saturation. However, in most cases, NGH reservoirs are characterized by shallow burial, unconsolidation, and low cementation. In addition, NGHs occur in different forms, such as dispersed, layered. The analysis result of natural NGH samples shows that the distribution of NGHs in reservoirs is greatly different from conventional oil and gas distribution. The greatest difference is that oil and gas completely store in rock pores, but NGHs may pack into rock matrix.
The largest challenge in investigating NGH saturation is that NGH samples would be gasified and decomposed rapidly under aboveground conditions, so that one cannot experimentally correlate the resistivity index with the NGH saturation by conventional core flooding. Over a decade, numerous new experimental strategies have been proposed [10-11,20], and measurement devices capable of generating NGHs in the simulated low-temperature and high-pressure environment and measuring the variation of resistivity index with NGH saturation have been developed. These devices are generally composed of a reaction system, a temperature control system, a pressure control system, and a measurement system (Fig. 1 ). The main component of the reaction system is a high-pressure container in which samples are placed. The temperature control system maintains the temperature required by the hydrate experiment. The pressure control system consisting of components such as pump, pressure gauge and safety valve, maintains constant pressure in the reaction system. The measurement system includes main components such as control PC, digital electric bridge, and temperature and pressure sensors, which acquires real-time sample resistivity and experimental parameters such as temperature and pressure. With the help of these devices, the resistivity variation in different growth forms of hydrates can be measured, and the resistivity index at different hydrate saturations can be obtained then. Another contribution of these devices is that they enable us to clearly observe the growth and distribution of hydrates, and their increasing process of resistivity.
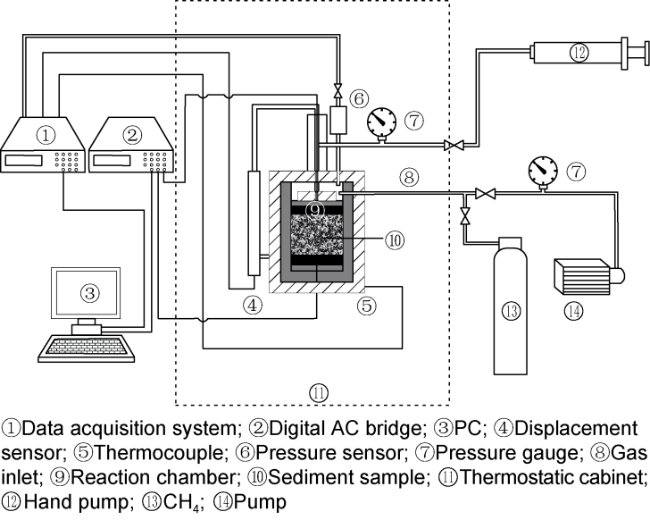
Fig. 1. Schematic diagram of devices for hydrate formation and resistivity measurement under simulated low-temperature and high-pressure conditions. |
Core observation and analysis of related experiment results demonstrate that at different saturation, the distribution of hydrates in reservoirs may be grouped into the following types (Fig. 2 ): (1) When hydrates initially occur in reservoirs at low saturation, they are dispersed in the pores just like oil and gas in reservoirs (Fig. 2 a). (2) With continuous generation, the hydrate saturation gradually increase, and hydrate particles start to locally support the rock matrix in grain form (Fig. 2 b). (3) When hydrates are massively generated and the hydrate saturation reaches a certain threshold, hydrates accumulate to form layers and become a part of the formation matrix and bear the overburden pressure together with matrix particles (Fig. 2 c). It should be noted that considering that hydrates are solid hydrocarbon, their volume can be defined to be the same to pore volume, in the presence of hydrates as matrix-supporting or layers. Hence, under such circumstances, the hydrate saturation is still the percentage of the hydrate-occupied pore volume to the total pore volume. When the hydrate saturation increases, the variation of experimental measured resistivity is generally as shown in Fig. 3 - a monotonic increase with the increasing in hydrate saturation in the log-log coordinate system. For consistency with conventional expression, the horizontal axis in Fig. 3 is still water saturation (Sw), which satisfies Sho=1-Sw (Sho represents hydrate saturation).
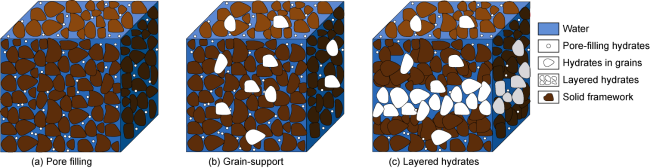
Fig. 2. Distribution states of hydrates in reservoirs at different saturation. |
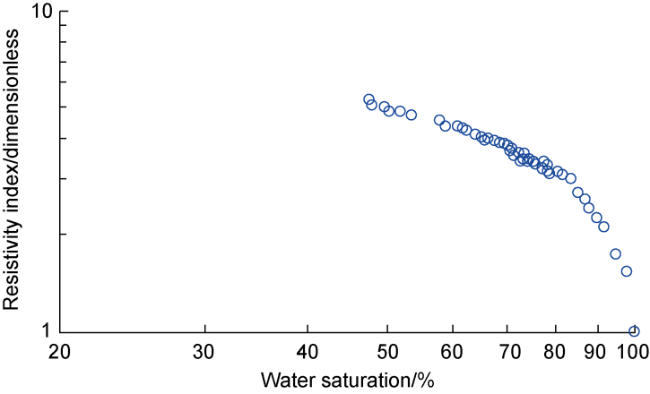
Fig. 3. Experimental results of hydrate saturation vs. resistivity index. |
2. Saturation model and its physical meaning
2.1. Derivation of saturation equation
In 1989, the first author of this paper, for the first time, proposed a homogenous anisotropic 3D model for well logging interpretation (Fig. 4 ) [27] and derived the general form of the correlation between resistivity index and hydrocarbon (oil or gas) saturation (Eq. (1)):
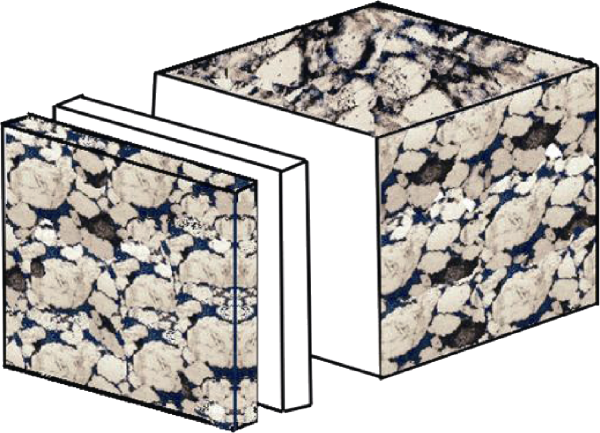
Fig. 4. Homogenous anisotropic 3D model for well-logging interpretation. |
The saturation models of conventional sandstone and heterogeneous fractured-vuggy reservoirs are both the special forms of the above general form [28].
For the convenience of understanding, the above general form of resistivity index versus oil/gas saturation can be regarded as the “general solution”, while the different truncated forms can be considered “special solutions” of the “general solution”.
For the experiment relation of hydrate saturation versus resistivity index in Fig. 3 , the analysis results show that in the log-log coordinate system the composition of the three lines (Fig. 5 a), (Fig. 5 b) and (Fig. 5 c), completely coincides with the experimental data (the red curve in Fig. 5 d). In fact, this fitting adopts the following truncated version of the general form (in other words, the following “special solution” of the “general solution”):
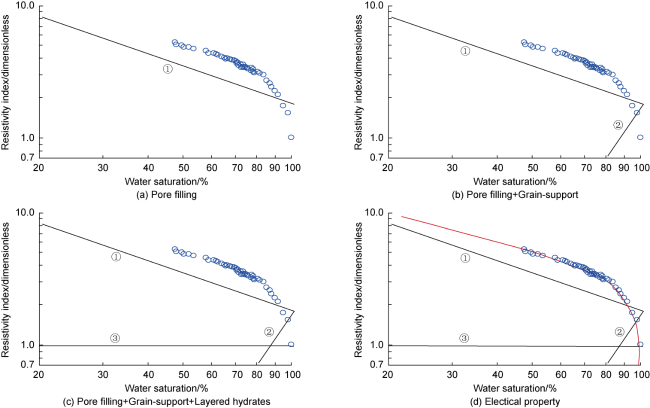
Fig. 5. Hydrate saturation vs. resistivity index of NGHs in various forms of occurrence.① ; ② ; ③ |
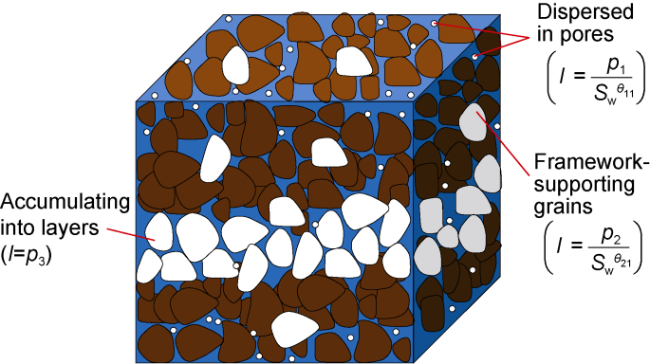
Fig. 6. Physical implications of Eq. (3). |
The equation accounts for the different forms of NGHs and can be used as the basic equation of hydrate saturation calculation with resistivity index. Xie et al. applied the following equation for quantification of hydrate saturation.
The above equation can be transformed as follows:
Obviously, it is the Indonesia equation that proposed by Poupon et al. (1971).
Compared with several truncated versions of the general form of resistivity index versus oil/gas saturation listed above, Eq. (5) is obtained by extracting two terms in the denominator on the right side, which means the Indonesian equation is the special form of the general saturation equation in the case of higher shale content.
2.2. Physical implications of Eq. (3)
Eq. 3 consists of three terms. Research shows (1) when NGH particles are completely dispersed in reservoir pores, the hydrate saturation can be calculated in a way similar to that to compute oil/gas saturation in pores of conventional sandstone reservoirs, and Eq. (3) can be simplified to the Archie equation (namely, the first term of Eq. 3, ). (2) When NGH particles are not only dispersed in pores but also function as particle support, an extra term needs to be added into the Archie equation, namely the second term of Eq. (3), . (3) When NGH particles massively accumulate into layers, besides particle support the formation framework, another extra term should be added to the Archie equation, namely the third term of Eq. 3, .
Precise evaluation of NGH reservoirs is significant for its high-efficiency development. In accordance with the typical classification of NGH reservoirs (Fig. 7 ) [6] and the presented hydrate saturation calculation equation (Eq. (3)), the types of NGH reservoirs can be effectively identified with well logging method. Specifically, there are four cases. (1) If the hydrate saturation can be accurately estimated using Eq. (3) with only the Archie term, the NGH reservoir is a “polar sandstone reservoir” or “marine sandstone reservoir”. (2) If only the third term of Eq. (3) is required for accurate estimation of hydrate saturation, the NGH reservoir is “vein-like/blocky hydrates”. (3) If both the first and the second terms of Eq. (3) are needed to accurately calculate hydrate saturation, the NGH reservoir is a “marine non-sandstone reservoir”. (4) In the case that all of the three terms in Eq. (3) are needed for hydrate saturation calculation, the NGH reservoir is “fine-grained sediments”.
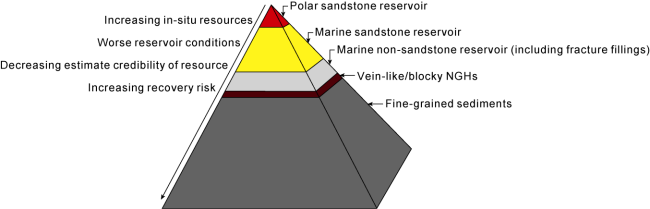
Fig. 7. Classification of NGH reservoirs. |
3. Application Case
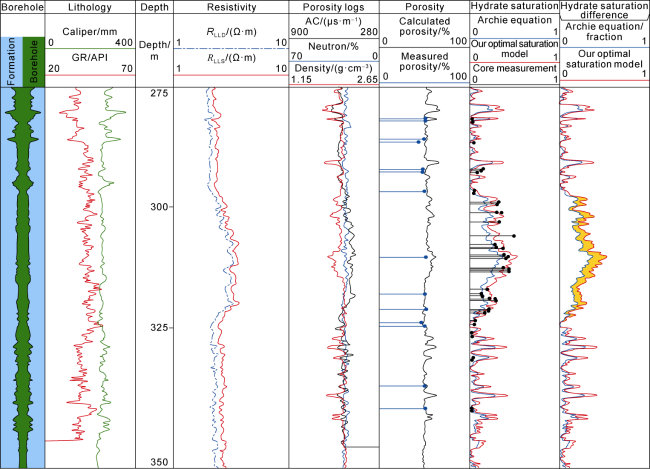
The measured hydrate saturation of the sample collected from a well in the South China Sea is compared with the well logging result (Fig. 8 ). From left to right, the first track represents the borehole status; the second track shows the borehole diameter and GR log; the third is the well depth; the fourth is the electrical resistivity; the fifth is porosity; the sixth is the comparison between calculated porosity and measured core porosity; the seventh is the comparison of the hydrate saturation calcu-lated using the conventional Archie equation and Eq. (3) in this research with hydrate saturation by core testing; the eighth shows the difference between the hydrate saturation calculated by traditional Archie equation and that of Eq. (3). The horizontal lines and dots in these tracks represent the results of core testing.
Fig. 8. Comparison between NGH saturations of calculated results from logging and core testing in a well in the South China Sea. |
The analysis shows that well-logging responses at the NGH reservoir interval (at 300-325 m) are significantly different from those of normal formations. With the increase in the hydrate saturation, the formation resistivity gradually increases. In the meantime, as the pore volume originally occupied by water is gradually filled with solid NGHs, the acoustic velocity of the formation grows and the time difference considerably reduces. The comparison of the calculated hydrate saturations with different methods reveals that the conventional Archie equation underestimates the hydrate saturation, while the hydrate saturation calculated using our equation is more consistent with core testing. The difference between the two results of the new method and core testing is about 10%. Furthermore, by comparing the hydrate saturation at main depth points calculated with the Archie equation and our equation, and the core testing results, it indicates that the saturation values calculated with optimization model proposed in this paper lie on both sides of the core testing, with the relative error about 10%; the saturation values calculated with the Archie equation are all below the core measurements, with the relative error about 40%.
Provided that the effective reservoir thickness is 20 m, the porosity is 50%, and the favorable exploration area of NGHs is 10 km2, an error of hydrate saturation of 10% can lead to equivalent hydrate reserves of 10×106 m3. Clearly, the reliability of hydrate calculation has vital effects on region NGH resource evaluation and the design of the development plan.
4. Conclusions
The general form of the correlation between resistivity and hydrocarbon saturation is applicable not only for the oil/gas saturation calculation of conventional reservoirs but also for those with natural gas hydrates (NGHs).
For NGH reservoirs, the truncated version of the general form with three terms can satisfy the requirement for accurate evaluation of hydrate saturation. In terms of the physical meaning of these terms, they are the resistivity index attributed to three different forms of NGHs, namely NGH particles completely dispersed in pores, particle support, and separate stratification.
For marine NGH reservoirs classification, Eq. (3) with only the first term (namely the Archie equation) is applicable for NGH saturation calculation of “polar sandstone” or “marine sandstone”; the one with only the third term, applicable for “vein-like/blocky NGHs”; the one with the former two terms, applicable for “marine non-sandstone” containing NGHs; the one with all three terms, applicable for “fine-grained sediments” containing NGHs. This law can be reversely used to determine the reservoir type of NGHs.
Sincere thanks to Prof. Mo Xiuwen with Jilin University for the data of natural gas hydrate reservoirs.
Acknowledgments
Sincere thanks to Prof. Mo Xiuwen with Jilin University for the data of natural gas hydrate reservoirs.
Nomenclature
I—resistivity index, dimensionless;
N—the equivalent quantity of cascade thin sections of reservoir rock;
li—the total quantity of the i-th type conductive minerals;
Sho—hydrate saturation, f;
Sw—water saturation, f;
pi, hik, θik—parameters to be determined;
Vsh—clay volume, f;
Rsh—resistivity of mudstone, Ω·m;
Rt—formation resistivity, Ω·m;
Rw—formation water resistivity, Ω·m;
R0—resistivity of formation saturated with water, Ω·m;
ϕe—effective porosity, f;
a—lithology factor, dimensionless;
m—cementation index, dimensionless;
n—saturation index, dimensionless;
d—constant.