

Introduction
Stratigraphic deposition and formation are often affected by tectonic movements of multiple stages, and different directions and intensities. Compared with conventional reservoirs, tight reservoirs are more brittle and prone to fracture, so fracture network systems are often developed in tight reservoirs, which are composed of natural fractures with different occurrences [1-2]. The fracture network is important reservoir space and provides effective flowing channels for tight oil and gas [3-4], which affects tight oil and gas enrichment, single-well productivity and development effect [5-6]. Research on fracture prediction is of great significance for tight oil and gas exploration and development [7].
The fracture prediction of tight reservoir involves single-well fracture identification, interwell fracture trend prediction, construction of interwell fracture density models, multi-group fracture network modeling and fracture property equivalence. Among them, single-well fracture identification is the basis, interwell fracture trend prediction is the guarantee, interwell fracture density model is the coupling and upgrading of prediction results of single-well and interwell fracture trends, and three-dimensional (3D) fracture network modeling is an integration of fracture information in multi-source isomerous data with different scales [8-9]. How to accurately and efficiently predict the development degree of single-well and interwell fractures, how to obtain interwell fracture density models that can efficiently constrain fracture modeling, and how to comprehensively use fracture information in multi-source isomerous data of different scales, such as core, logging, and seismic data, to build a 3D fracture network model are the key problems to be solved in fracture network prediction of tight reservoirs [10]. The fracture prediction for tight reservoirs based on artificial intelligence is expected to break through the limitations of current theory and technology by deep mining and comprehensive utilization of geological and geophysical multi-source information, and provides effective technical support for efficient development of tight oil and gas [11]. This paper focuses on single-well fracture identification, interwell fracture trend prediction and construction methods of interwell fracture density models for tight reservoir fracture prediction.
Single-well fracture development can be evaluated by core data and logging (borehole imaging logging, conventional logging) data [12]. Core fracture description gives the firsthand information of fracture development at well trajectory, but the cost for coring in underground reservoirs is high, and generally there is less core data available. Borehole imaging logging can directly obtain the geometry and distribution of fractures around the borehole wall, but the logging cost is high and the data is often limited [13]. Conventional logging methods are extensively applied in most wells for oil and gas exploration and development. The changes in reservoir physical properties in a fracture development zone show certain responses on conventional logging curves, which present the fracture development law in the whole target reservoir. However, conventional logging responses to fractures are weak and extremely complex, resulting in ambiguity of fracture identification from conventional logging data. How to extract the logging responses caused by fractures from labeled conventional logging data after calibrated by a small number of cores (or borehole imaging logging), establish a nonlinear prediction model between conventional logging curves and fracture development, and reduce the ambiguity of single-well fracture information is very important for conventional logging fracture identification [10,14]. Artificial intelligence makes a breakthrough to conventional logging fracture identification [15]. At present, popular artificial intelligence methods for logging fracture identification include conventional methods (Bayesian discriminant analysis [16], K-Nearest Neighbor, etc.), kernel methods (support vector machine (SVM), kernel Fisher discriminant analysis (KFD), multi-kernel Fisher discriminant analysis (MKFD) [17], Laplace support vector machine (LapSVM) [14], etc.), ensemble learning methods (random forest (RF), gradient boosting decision tree (GBDT), adaptive boosting algorithm (AdaBoost), etc.) [18] and neural network methods (BP neural network, convolutional neural network (CNN), recurrent neural network (RNN), etc.) [19-20]. Artificial intelligence methods mainly use core fracture description or borehole imaging logging fracture interpretation to guide conventional logging fracture identification.
The interwell fracture trend prediction can be realized by reservoir geomechanical numerical simulation or seismic data interpretation. The formation of underground fracture systems is affected by tectonic movements. The numerical simulation analyzes the stress and fracture formation process in reservoirs through the finite element numerical simulation of continuous media and rock failure criterion. It is applicable to the macroscopic understanding of the distribution of interwell fractures, especially fault-related fractures [21-22]. The fractured rock in underground reservoirs will produce the anisotropy of seismic wave propagation, which can be shown to a certain extent in the seismic data [23]. Since seismic attributes contain more detailed information about interwell fracture development zones, they can be used to predict fracture development zones. However, seismic responses to fractured reservoirs are affected by lithology, fluid and other factors, so seismic prediction of fracture development zones are very ambiguous. In recent years, more and more artificial intelligence algorithms have been used for fracture prediction based on seismic attributes. The representative methods are kernel method (such as SVM), ensemble learning method (such as RF), etc. The SVM method uses a kernel function replacement trick to map low-dimensional, linear and indivisible seismic data onto high-dimensional feature space, so as to realize the extraction and utilization of the nonlinear characteristics of fractures [24]. The RF model for fracture identification consists of many base prediction models so as to obtain low uncertainties [16].
Fracture density is a termination condition for fracture network simulation, and it has a great influence on the connectivity of a fracture network model. An interwell fracture density model is the most effective data for constraining fracture network modeling, but it is difficult to obtain. Alternatively, single-well fracture density or outcrop fracture density in the same formation is selected as a constraint condition for fracture network simulation[9-10]. However, the lack of interwell fracture development information inevitably leads to the decline of fracture modeling accuracy. It is very important to improve the precision of fracture modeling to build a constraint that conforms to the density of interwell fractures in actual reservoirs.
This paper makes full use of multi-source and multi- scale data such as cores, conventional logging, borehole imaging logging, seismic data. Additionally, on the basis of the original framework of tight reservoir fracture prediction, and through single-well fracture identification and interwell fracture trend prediction upgraded by artificial intelligence, we established an intelligent method for predicting fractures in tight carbonate reservoirs to improve the accuracy of reservoir fracture prediction. Intelligent improvements on fracture prediction method proposed in this paper include: (1) Integrating three artificial intelligence algorithms (SVM, MKFD and RF) into the conventional fracture identification method (fracture indicating parameter method), improving the identification model from three aspects including small sample classification, multi-scale nonlinear feature extraction and decreasing variance of prediction model, and comprehensively identifying the development of single-well fractures to reduce the uncertainty of identification; (2) Through numerical simulation to reservoir geomechanics and prediction of seismic attributes, the development trend of interwell fractures can be obtained. Seismic inversion of interwell fracture trend forms a more stable fracture prediction model through artificial intelligence ensemble learning algorithm (GBDT); (3) An interwell fracture density model that can be used to directly constrain fracture network modeling is built based on single-well fracture identification and interwell fracture trend. In addition, for fracture network modeling, many factors such as fracture system, the development intensity of each fracture system, and stratigraphic controls are considered to establish a fracture network model that is more consistent with actual reservoir conditions.
1. Intelligent logging identification of single-well fractures
1.1. Basic principle
The comprehensive intelligent identification method of fractures is shown in Fig. 1 , which integrates the methods of fracture indicating parameter (FIP) method, SVM, MKFD and RF, and reduces the uncertainty of single-well fracture identification. It not only inherits the advantages of fractal and curve reconstruction in conventional fracture identification methods, but also makes full use of the ability of artificial intelligence to deeply mine information. The results (Fi) of different fracture interpretation methods are integrated into F function through Eq. (1). The numerical range of F function is 0-1, which reflects the probability of fracture development. The closer the numerical value is to 1, the greater the probability of fracture development.
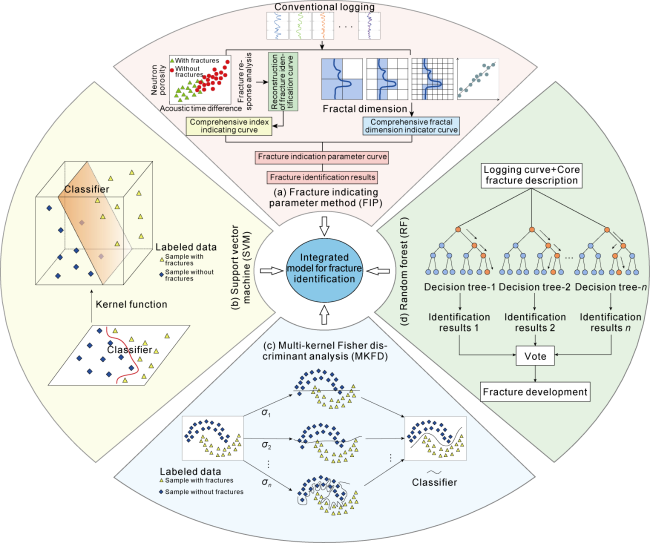
Fig. 1. Schematic diagram of intelligent single-well fracture identification methods. |
1.2. Conventional and artificial intelligence methods used for intelligent identification
1.2.1. Fracture indicating parameter method
The fracture indicating parameter (f) consists of two parts, i.e., comprehensive index (c) and fractal dimension (d) [25], as follows:
f=ac+bd
In view of the weak response of logging curves to fractures, comprehensive index c can reconstruct several logging curves reflecting the probability of fracture development, and assign different weights to amplify the response characteristics of fractures, which to some extent offset the effects of porosity, lithology and other factors [26]. Fractal dimension d describes the complexity of the geometric shapes of logging curves and reflects fracture development. The more developed the fractures in the tight reservoir, the greater the fluctuation of the logging curve, the more obvious the relative amplitude abnormality of the shape, and the greater the fractal dimension.
1.2.2. Support vector machine algorithm
SVM is a kernel method based on statistical theory [27]. Its basic logic is to map the sample space to a higher dimensional vector space through a kernel function for linearly indivisible samples in a low dimensional space. The optimal classifying plane in feature space is determined by maximizing the interval for nonlinear classification [28].
1.2.3. Multiple kernel Fisher discriminant analysis
MKFD analysis is an improvement of single kernel Fisher discriminant analysis [17,29]. Through the kernel function replacement trick, KFD can map the original logging curves to a high-dimensional nonlinear feature space according to fracture development, and then reduce dimensions and extract the effective features of fractures through the linear discriminant analysis, so as to mine the effective fracture identification information from weak logging responses. KFD only uses the information of one feature space, and there is much information beneficial to fracture identification in feature spaces of different scales [29]. MKFD realizes more comprehensive and in-depth utilization of fracture identification information on multi-scale nonlinear feature space.
1.2.4. Random forest algorithm
RF votes the final prediction results according to the prediction results of multiple sub-classifiers (decision trees), which is an ensemble learning algorithm based on decision trees and Bagging method [30]. The randomness is embodied in random sampling of samples and features. The former ensures that the sub-classifier uses different samples, and the later guarantees that the sub-classifier uses different features to analyze fracture development from different physical response characteristics [16]. The error of the fracture identification model is mainly composed of the variance and deviation of the prediction model. This method reduces the variance of the model through two “randoms” and integrated voting method to improve the accuracy of fracture identification.
2. Construction of interwell fracture density model
The geostatistics method is used to couple single-well fracture information with interwell fracture trend to establish a 3D fracture density model, which is the basis of fracture network modeling. In addition, interwell fracture trend can be obtained through numerical simulation to reservoir geomechanics and interwell fracture trend prediction based on seismic attributes.
2.1. 3D fracture density prediction method integrating the development trend of single-well and interwell fractures
The 3D fracture density prediction method proposed in this study includes the following three steps: (1) The spatial distribution of fracture development intensity is obtained by integrating the numerical simulation results of reservoir geomechanics and artificial intelligent fracture prediction based on seismic attributes, which is used as the interwell fracture trend. The interpretation of single-well fractures is expanded to 3D space through co-sequential Gaussian simulation to obtain 3D fracture development intensity (Fig. 2 ). This 3D geological model can reflect the spatial distribution of fracture development, but it cannot be directly applied to the subsequent fracture network modeling, so it’s necessary to convert it into a 3D fracture density (such as P3,2) model. (2) Convert the fracture development intensity into the fracture linear density P1,0. Image logging fracture interpretation P1,0 calibrates single-well fracture interpretation results from conventional logging data, and converts fracture development intensity into a P1,0 3D model. (3) Convert P1,0 into a P3,2 3D fracture density model. There is a positive correlation between P1,0 and P3,2, which can be obtained by using the relationship between fracture occurrence and well trajectory [31], so that the 3D fracture development intensity can be converted into a 3D fracture density (P3,2) model.
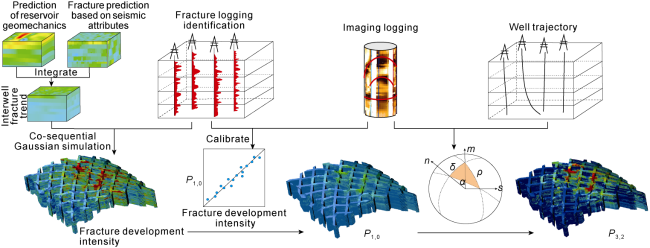
Fig. 2. Basic principle of 3D fracture density prediction method. |
The 3D fracture trend model based on numerical simulation to reservoir geomechanics is relatively smooth, and it provides good prediction for fault-related fractures. The artificial intelligence supported fracture trend model based on seismic attributes requires more details than the former, and has better response characteristics for non-fault-related fractures. Both can reflect interwell fracture trend to a certain extent, and can complement each other. Therefore, this study takes the two as soft data, uses the identification results of single-well fractures as hard data, and integrates two kinds of data into a 3D fracture intensity constraint through the geostatistical collaborative interpolation method in Step (1), which integrates the advantages of reservoir geomechanical numerical simulation on the prediction of fault-related fractures, the details of the prediction of artificial intelligence supported interwell fracture trend based on seismic attributes, and the calibration by hard data (i.e., single-well fractures). The determination of simulation termination condition is a challenge in modeling fracture network. Although the fracture intensity constraint established by numerical simulation of reservoir geomechanics and seismic attribute prediction can reflect the interwell fracture trend, it cannot be directly used to determine the termination condition of fracture network simulation. It needs to use the auxiliary information such as single-well fracture density or the fracture density of the whole area. Therefore, the 3D fracture intensity model is finally converted into a P3,2 model that can be directly used for fracture network modeling through steps (2) and (3), which can be more conveniently used for 3D fracture network modeling.
2.2. Prediction of interwell fracture trend based on numerical simulation to reservoir geomechanics
The numerical simulation of reservoir geomechanics simulates the stress process in the study area. Taking the tectonic evolution background as the basis, it considers the control factors on fracture development to approximately simulate the fracturing process of rocks during tectonic movements, and calculate the failure index of the rocks in each formation in the study area. The spatial distribution of fractures can be obtained by calibrating the simulation results through single-well fracture interpretation.
The numerical simulation of reservoir geomechanics needs to comprehensively consider geological, mechanical and mathematical factors [22,32]. The fracture prediction process is shown in Fig. 3 . The main steps are as follows: (1) First, determine the overall tectonic morphology in the study area by analyzing the tectonic evolution, and analyze the spatial distribution characteristics of the 3D geological bodies based on the actual 3D structural framework data of the study area. On the basis of the lithofacies in the study area, the 3D geological bodies are divided into several geological bodies, and the geological model of the study area is established [21]. (2) Then the geological model is combined with the rock mechanical parameters of each formation to endow different geological bodies with corresponding actual rock mechanical properties and form a mechanical model. Then the 3D mechanical model is discretized and gridded into finite elements according to the characteristics of each geological body [33]. The elements are in line and surface contact and connected by nodes. The geostress analysis of the whole geological body can be transformed into the geostress analysis of element nodes. (3) Finally, the model is calculated and verified, and the element node with a large error is debugged repeatedly to finally obtain the3D geostress distribution in the study area, thus reflecting the distribution change of the stress field of the whole geological body [34].
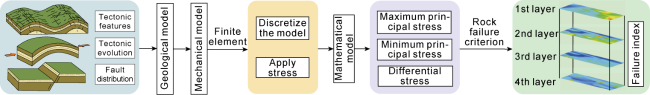
Fig. 3. Flow chart of fracture prediction based on reservoir geomechanics. |
2.3. Prediction of interwell fracture trend from seismic attributes based on artificial intelligence
Post-stack seismic attributes are often used for sedimentary microfacies analysis, identification of fault and fracture development zones, etc. Fault and fracture development zones show small changes and distortions of seismic events on seismic profiles, and have certain responses to curvature, variance and other seismic attributes [35]. In recent years, the rapid development of artificial intelligence algorithms has provided a good opportunity for the integration of multiple seismic attributes to predict fracture development zones. Seismic features in fracture development zones are weak and complex. How to effectively extract fracture information and reduce uncertainty and ambiguity is a difficult problem to be solved. This study uses the seismic data calibrated by single-well fracture density obtained from well logging interpretation, and introduces the fracture prediction method from seismic attribute based on artificial intelligence (i.e., GBDT) to solve the above problems, so as to realize the prediction of interwell fracture development (Fig. 4 ).
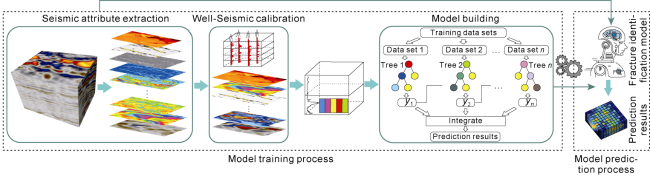
Fig. 4. Schematic diagram of intelligent prediction of fractures based on seismic attributes. |
GBDT is an ensemble learning algorithm, which is composed of a series of decision tree models. The fitting error of each decision tree model favors the improvement of next decision tree model. The algorithm approximates the real value through gradual fitting (Fig. 4 ). The error between the established model and the real fracture prediction is reduced through ensemble learning, thus effectively reducing the uncertainty of fracture prediction based on seismic attributes.
3. Fracture prediction based on fracture network modeling
3.1. 3D fracture network modeling
Discrete fracture network (DFN) is a stochastic modeling method based on marked point process, which not only considers the spatial development law of fractures, but also reflects the uncertainty of fracture network modeling [11,36]. This method can integrate fracture information obtained from multiple types of data including seismic, outcrop, core, conventional logging and borehole imaging logging data [8]. The 3D fracture density model can constrain the point process to generate the position of fracture center [37]. The fracture attribute (strike, dip, aperture, etc.) distribution curves obtained from core and borehole imaging logging can be used to assign fracture attributes to each fracture center in the marked point process, thus generates 3D fracture slices. The commonly used distribution functions are exponential distribution or logarithmic normal distribution [37-38]. High-angle structural fractures are mostly developed in the tight reservoir in the study area [25,29], and the vertical extension of the fractures is controlled by layers, so the strata controlling method is adopted to generate the fracture network layer by layer (Fig. 5 ). As the study area is subject to multiple tectonic movements, multiple sets of fractures are formed. Therefore, this study generates fractures with different strikes by properties of different groups of fractures [39]. The modeling process is shown in Fig. 5 .
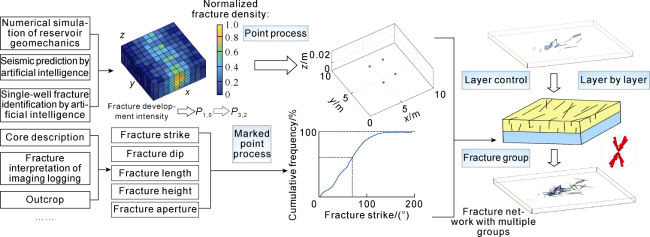
Fig. 5. Flow chart of 3D discrete fracture network modeling. |
3.2. Equivalent method of 3D fracture network property
By upscaling a fracture DFN model, the corresponding fracture property models can be obtained, including fracture porosity model and fracture permeability model. In this work, the Oda algorithm [40] is used to upscale the fracture model. Its principle is to take the known parameters in the grid as the calculation template, and then simulate the parameters in other grids by analyzing the correlation between known grids and unknown grids. The fracture equivalent porosity is equal to the ratio of the volume of all fractures in the grid node to the volume of the grid node (Fig. 6 ). The fracture equivalent porosity model can be directly calculated from the DFN model. For each grid node, the fracture equivalent porosity is equal to the ratio of the volume of all fractures in the grid node to the volume of the grid node, as follows:
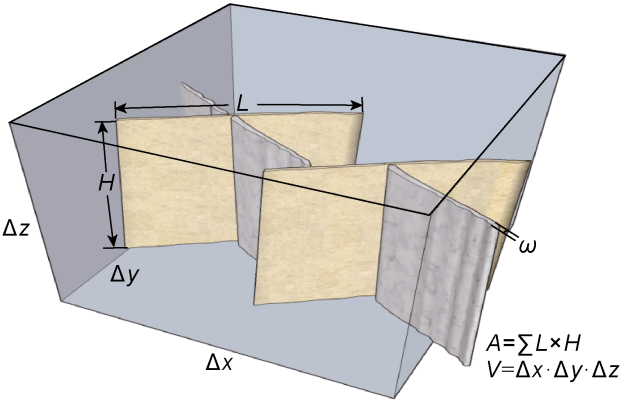
Fig. 6. Schematic diagram of fracture equivalent porosity. |
The fracture equivalent permeability can be characterized by information such as the occurrence and aperture of the fracture, and the fracture can be generalized as a disc with radius r. The permeability of a fracture model with a certain number of fractures can be upscaled by simple algorithms, such as average method, composite average method and flow method based on 3D numerical solution [41].
4. Application of fracture prediction in tight carbonate reservoirs
4.1. Geological setting
The Zagros Basin in the Middle East was formed by the continuous collision and compression between the Arabian plate and the Eurasian plate (Fig. 7 ). A Oilfield is located at the southwest margin of the Zagros Basin, at the border of Iran and Iraq [42]. The carbonate reservoir of the Oligocene-Miocene AS Formation in the study area can be divided into four members (i.e., A, B, C and D) from top to bottom. The AS Formation, which is mainly composed of carbonate rocks, was deposited in the carbonate platform facies in this study area. However, due to the influence of terrigenous detrital, clastic sediments were found locally in the basin [25]. Member A is mainly composed of dolomite deposits with massive gypsum, the average porosity is 8.7%, and the average permeability is 10.6×10⁻³ μm2, belonging to low porosity, medium-low permeability reservoir [25,43]. With abundant natural fractures and certain productivity, Member A is a typical fractured tight reservoir. This study focuses on the dolomite reservoir in Member A.
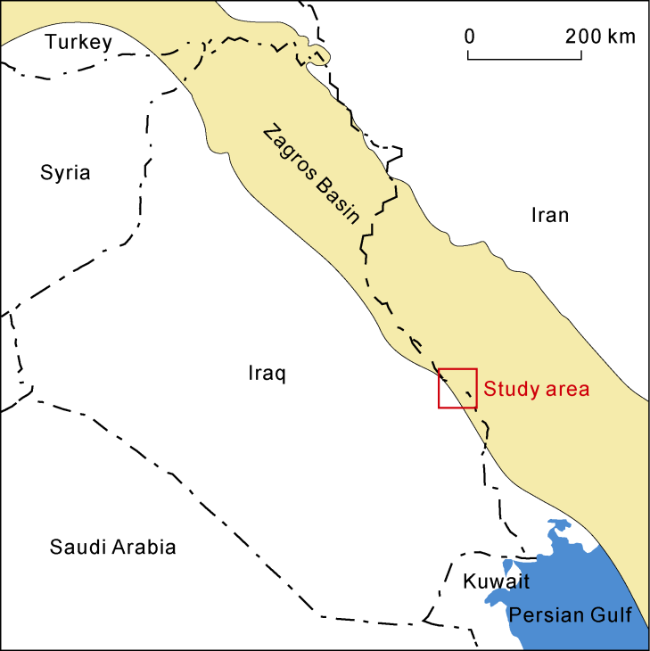
Fig. 7. Structural unit and location of the study area [29]. |
The regional stress field in the study area is mainly controlled by the Arabian plate and the Eurasian plate, and the regional stress is mainly in the NE-SW direction and NNE-SSW direction [25]. The natural fractures in the study area can be divided into structural fractures and non-structural fractures based on the geological origin, which are dominated by high-angle structural shear fractures, and the strike is mainly in the directions of NNE-SSW and NNW-SSE, and some fractures in NWW-SEE and NEE-SWW [25]. Core observation shows that the surface of the structural shear fracture is straight and smooth, and the dip angle is mainly 70° to 90°, mainly unfilled fractures, and some low-angle structural shear fractures, dissolution fractures, bedding fractures and stylolite can also be seen [25].
4.2. Application of logging fracture interpretation based on intelligent identification
The characteristics analysis of fracture logging responses is the basis of fracture logging identification. Conventional logging curves are calibrated by core fracture description and fracture interpretation from borehole imaging logging, and correlation analysis is conducted to determine the logging responses of fractures in the study area. As shown in Fig. 8 , the red represents fracture development zones, and the blue represents the zone without fractures. The fracture development zone is characterized by low acoustic logging value, high neutron porosity and low resistivity values, indicating that there are some differences between fracture and non-fracture development zones in logging response. Although there are some overlaps between fracture and non-fracture samples, the difference between their logging responses is small. Therefore, it is necessary to amplify the fracture response intensity and eliminate the impact of non-fracture zones.
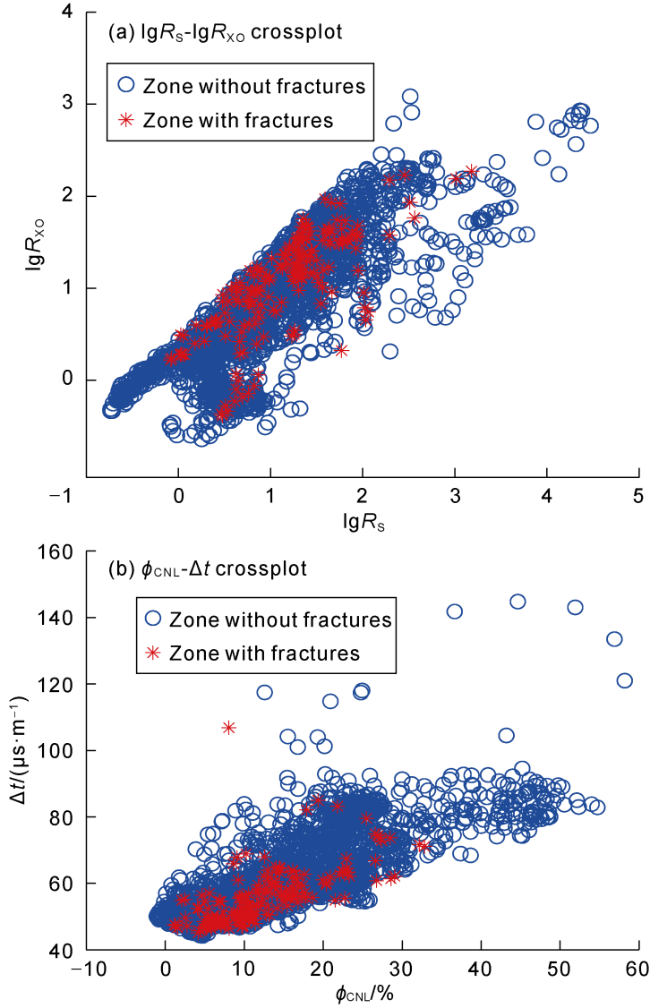
Fig. 8. Crossplot of logging parameters in the study area. |
On the basis of sensitivity analysis of logging curves, the fractures in the study area are identified using the above-mentioned intelligent identification method of single-well fracture logging. The results and comparison of single-well fracture identification are shown in Fig. 9 . The red curves in the second column indicates the fracture development in core description, and the purple curves in the third column is the identification result of the intelligent identification method of fracture logging data, in which the high value (close to 1) indicates a high probability of fracture development, vice versa. The comparison with the fracture interpretation results from core description and borehole imaging logging shows that most fractures can be identified except for a few fractures with poor consistency. For example, the core at the depth of 2970 m has fractures, but these fractures are hardly identifiable from logging interpretation. The fracture interpretation results from five coring wells and borehole imaging logging in the study area show that the accuracy of fracture identification of this method exceeds 90%, and the accuracy is improved by more than 15 percentage points compared with conventional methods (such as FIP).
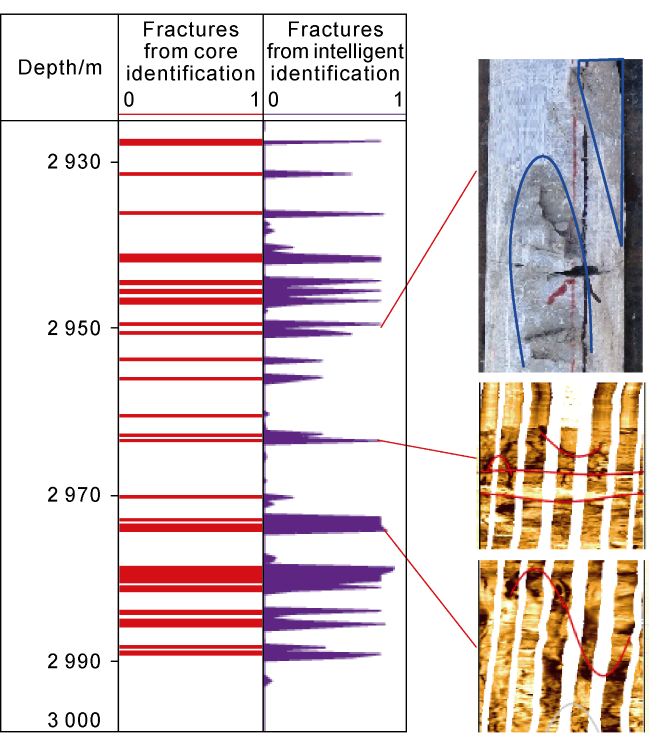
Fig. 9. Fracture interpretation results of Well W-2 in the study area. |
4.3. Application of 3D geological model construction of fracture density
Through the numerical simulation of reservoir geomechanics, the stress distribution during the formation of fractures in the study area can be obtained. According to the simulation results, the maximum principal stress is 60-90 MPa, the minimum principal stress is 25-45 MPa, and the differential stress is 30-60 MPa. Based on the rock mechanic parameters in the study area, the failure index can be obtained by simulation and calculation according to the rock failure criteria, indicating the intensity of fracture development in different zones. The prediction results are shown in Fig. 10 a. The fracture development degree is high in the zone with a high failure index, and low in the zone with a low failure index.
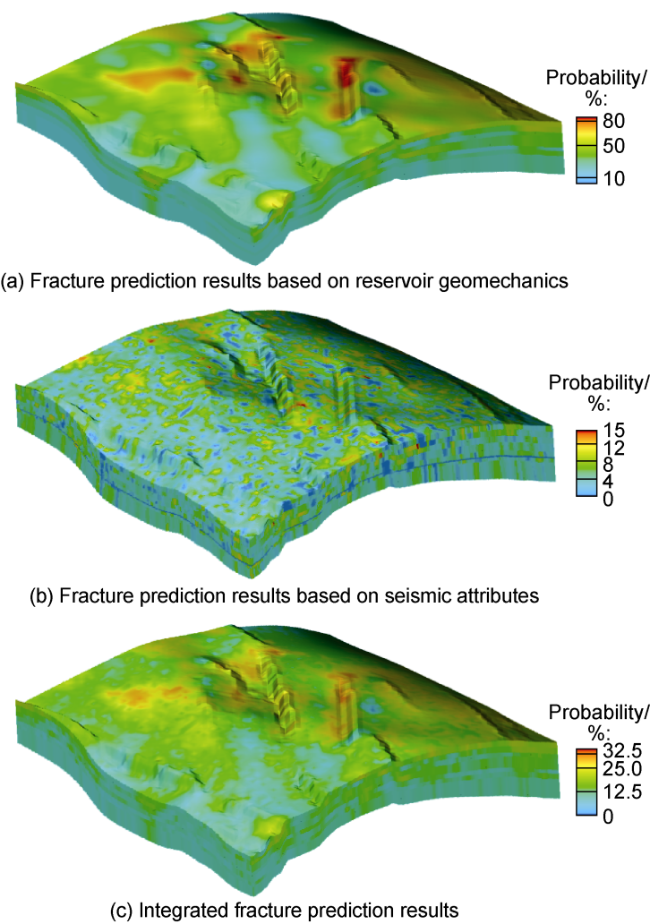
Fig. 10. Prediction results of fracture density based on reservoir geomechanics and seismic attributes. |
The single-well fracture interpretation results were used to calibrate seismic attributes. 300 labeled seismic attribute samples were obtained, and an ensemble learning prediction model was established based on GBDT. The trained model was applied to predict the whole study area, and the results are shown in Fig. 10 b. It is found that the details of fracture development from seismic prediction are more abundant. The fracture development intensity based on numerical simulation of reservoir geomechanics can reflect the distribution trend of the fracture development zone, while the fracture prediction results from seismic attributes provide more details about fracture distribution according to the differences in geophysical responses, and the two can complement each other. According to the process in Fig. 2 , a 3D model of fracture development intensity was built by using the co-sequential Gaussian simulation and single-well fracture interpretation as hard data, and then converted into a 3D fracture density model (P3,2) (Fig. 10 c) which shows the trend of fracture space development for subsequent fracture modeling.
By comparing the prediction results with the actual well logging interpretation results, the accuracy rate is more than 75%. Compared with the fracture prediction results from composite seismic attributes, the correlation coefficient is increased by more than 25 percentage points, indicating that artificial intelligence can better improve the prediction accuracy of the development of interwell fractures. In addition, when comparing to the 3D map of the fracture prediction results, it is found that the fluid production index has a correlation with the fracture development, indicating that the fracture prediction results are more accurate in this study area.
4.4. Application of 3D fracture network modeling
The fractures are divided into four groups according to the setting of the study area (Fig. 11 ). Among the four groups of fractures, the NNW-SSE fractures are the most developed, followed by the nearly N-S fractures. These two groups of fractures are developed in the early and middle stages when tectonic activities were relatively strong. The NE-SW fractures are less developed in the late period when tectonic activities became weak. The fracture parameters of each group are shown in Table 1 . Fracture strike, dip and other information are obtained through fracture interpretation of imaging logging. The fracture aperture results are from the comprehensive thin section observation, conventional logging interpretation and core fracture description. The conventional logging interpretation adopts deep and shallow resistivity data and the Luo’s model for tight carbonate reservoirs to obtain the fracture aperture, in which the pressure correction is calibrated in order to restore the underground fracture aperture. Without sufficient hard data of fractures, the fracture apertures of the four groups were upscaled in the same range. The fracture density trend for constraining fracture modeling is shown in Fig. 11 c. The fracture network model (Fig. 12 ) was established by the method in Section 3.1.
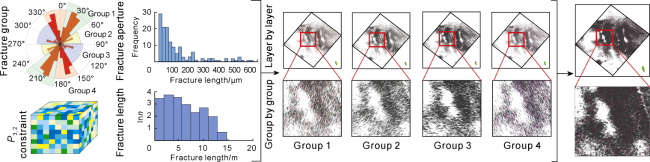
Fig. 11. Schematic diagram of discrete fracture network modeling process in the study area. |
Table 1. Fracture modeling parameters in the study area |
| Fracture group | Strike/(°) | Dip/(°) | Aperture/μm | Length/m |
|---|---|---|---|---|
| 1 | 33 | 78 | 0-300 | 0-150 |
| 2 | 72 | 70 | 0-200 | 0-150 |
| 3 | 116 | 70 | 0-200 | 0-150 |
| 4 | 167 | 78 | 0-300 | 0-150 |
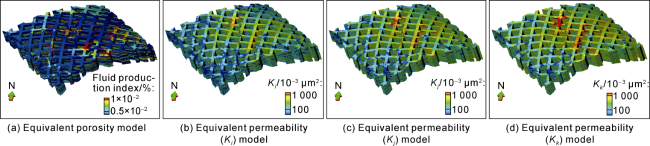
Fig. 12. 3D models of fracture properties in the study area. |
Based on the comprehensive DFN model in the study area, the fracture equivalent porosity of each grid node is calculated by Eq. (3), and then upscaled to the matrix reservoir model to obtain the fracture equivalent porosity model (Fig. 12 a). The Oda method is selected to calculate the equivalent permeability of fractures in different directions at each grid node, and then upscaled them into the matrix reservoir model to obtain the equivalent permeability models of fractures in three directions (Fig. 12 b-12d), which reflect the seepage and reservoir characteristics of the fractures, and provide a data basis for reservoir numerical simulation.
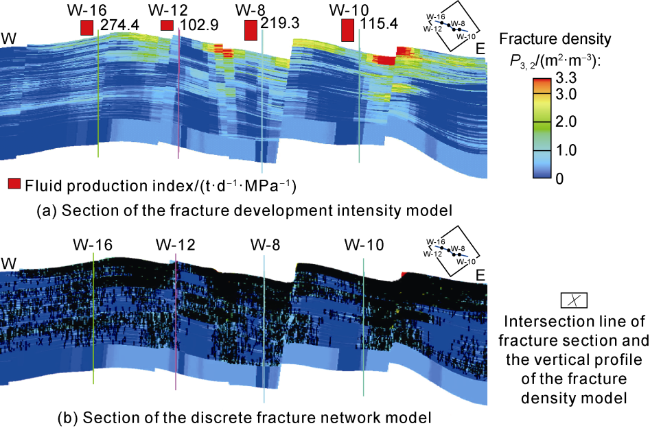
4.5. Validation of the fracture network model
The validity of the fracture network model can be verified by testing the effects of the 3D DFN model and the fracture property model. The 3D fracture model is verified by intercepting the posterior profile and comparing the fracture development intensity model section (Fig. 13 a) with the DFN model section (Fig. 13 b) in the study area. It is found that there are many fracture slices in the zone with high fracture development intensity, and the fracture development intensity is positively correlated with the single-well fluid production index, which indicates that the DFN model is more consistent with the actual situation.
Fig. 13. Posteriori diagram of discrete fracture network model in the study area. |
The fracture property models were tested by comparing the permeability with the fluid production index of the well that did not take part in the model construction. The results show that the permeability is positively correlated with the fluid production index. The correlation coefficient is 0.83, indicating that the permeability model is highly correlated to the fluid production index in the study area, and the equivalent permeability model is relatively reliable.
The oil production and water cut per well based on the dual porosity medium model was compared with that of the single porosity medium model. The results show that the matching effect of oil production and water cut of more than 60% wells of dual porosity medium model without history matching is better than that of single porosity medium model, and the wells based on the dual porosity medium model cover the most areas of the oilfield.
5. Conclusions
To reduce the high ambiguity in fracture prediction for tight carbonate reservoirs, this study introduces an artificial intelligence method to improve single-well fracture identification and interwell fracture trend prediction in conventional fracture prediction. Based on the conventional single-well FIP method, the identification accuracy of single-well fractures can be improved by introducing SVM, RF and MKFD algorithms from three aspects, i.e., classification of small samples, reduction of prediction model variance, and extraction of multi-scale nonlinear features. The details of fracture development zones between faults can be provided through seismic-attributes- based fracture prediction using the GBDT method. It can complement the fault-related fracture information obtained from numerical simulation of reservoir geomechanics. It can comprehensively improve the prediction accuracy of interwell fracture development zones. Moreover, through co-sequential simulation, single-well and interwell fracture information are coupled into the interwell fracture density model required for fracture network modeling, and finally a set of intelligent prediction methods for carbonate reservoir fractures are formed, realizing multi-scale information fusion and integrated intelligent prediction methods from single-well fracture identification to interwell fracture trend prediction, interwell fracture density body, fracture network modeling and fracture property upscaling. It lays a foundation for subsequent reservoir numerical simulation.
The proposed prediction method has been applied to the tight carbonate reservoir of the Oligocene-Miocene AS Formation in A Oilfield in the Zagros Basin, the Middle East. The results indicate that the single-well fracture identification (with the accuracy of more than 90%) improves over 15 percentage points compared with the conventional FIP method, and the interwell fracture prediction (with the accuracy of more than 75%) improves over 25 percentage points compared with the composite seismic attribute prediction. The established fracture network model is well consistent with the fluid production index. Furthermore, without history matching, the matching effect of oil production and water cut of more than 60% production wells with the dual porosity medium model is better than that of the single porosity medium model.
The intelligent method for predicting fractures in tight carbonate reservoirs proposed in this study can provide a reference to fracture prediction of different reservoirs. Single-well fracture interpretation can work with array acoustic logging data and remote detection logging data to reduce the prediction error caused by scale difference between single-well fracture information and seismic fracture information in future researches.
Nomenclature
Af—fracture area in grid node, m2;
a, b—weight coefficient, dimensionless;
c—composite index, dimensionless;
d—fractal dimension, dimensionless;
F—the parameter representing fracture development degree, dimensionless;
Fi—fracture development (obtained by different methods), dimensionless;
f—fracture indicating parameter, dimensionless;
H—fracture height, m;
Ki, Kj, Kk—equivalent permeability of fracture network model in i, j, k directions, 10−3 μm2;
L—fracture length, m;
m—normal vector of the fracture corresponding to the dominant occurrence;
n—normal vector of fracture surface;
norm(•)—standardized function;
P1,0—number of fractures in unit reservoir thickness, fractures/m;
P3,2—fracture area in unit reservoir volume, m2/m3;
RS—shallow lateral resistivity, Ω•m;
RXO—resistivity of flushed zone, Ω•m;
s—well trajectory direction;
Vcell—grid node volume, m3;
ϕCNL—compensated neutron porosity, %;
ϕf—fracture equivalent porosity of grid node, %;
ωf—fracture aperture in grid node, m;
ωi—weight coefficient, dimensionless;
δ, ρ, α—angles between n and m, between m and s, and between n and s, respectively, (°);
Δt—interval time difference, μs/m.