

Introduction
An underground gas storage (UGS) in gas field is superior technically and economically to other types of UGSs such as salt caverns and aquifers. In China, 24 UGSs in gas fields have been built, accounting for 89% of the total [1-2]. According to the characteristics of formation hydrocarbon fluids, about 90% of the 24 UGSs in gas fields are reconstructed from condensate gas reservoirs exploited to the middle-late stages, and nearly half of them have oil rims at structural edges and bottoms. Affected by the factors such as formation pressure depletion, retrograde condensation, degasification of oil rim oil, gas invasion or oil cone caused in gas reservoir development [3⇓⇓⇓-7], the composition of hydrocarbon fluid in gas reservoir before storage construction is complex, dry gas injected during storage construction is exchanged with formation fluid components, and the mass transfer mechanism between phases is also complex, which greatly increases the difficulty in design of storage construction indexes. In China, there are many researches on gas storage space utiliza-tion and phase permeability change under alternating working conditions [8⇓⇓-11], but the influence of multiple component exchange between injected dry gas and in-situ formation fluid and the change of fluid phase state on storage capacity parameters is less considered, and the research on action mechanism, simulation method and characterization model of mass transfer between fluid phases in cyclic injection-production process is relatively weak [12].
Scholars in China and abroad have established phase equilibrium experimental simulation methods such as high temperature and high pressure solubilization and expansion of gas injection, multiple-contact extraction, and mass transfer and diffusion through the study of phase characteristics changes in the process of cyclic gas injection development of condensate gas reservoirs and gas flooding of oil reservoirs [13⇓-15]. However, the above research results have great limitations in the study of phase behavior of oil and gas system in UGSs. This is mainly because there are great differences between the special operation conditions and injected gas components of UGSs and those of gas injection development of oil and gas fields. First, UGSs demonstrate the injection-production with large intensity, short duration, and quick pressure changes, and they are also more complex in the cyclic dynamic characteristics such as phase transformation, component exchange, and fluid properties between injected gas and in-situ formation fluid. Second, dry gas is generally injected into UGSs. For example, in the Banqiao underground gas storage of Dagang Oilfield, Bohai Bay Basin, East China, the injected gas has the relative density of 0.59 and the methane content of more than 93%. In contrast, for cyclic gas injection or gas flooding of oil reservoir, the associated gas is generally reinjected after fractionation. For example, in the Yaha and Dongshengpu oil reservoirs, the injected gas has the relative density of 0.87 and the methane content of 65.51%.
The fluid flow and phase behavior of oil and gas system during cyclic high-speed injection-production of UGSs under alternating working conditions are important factors affecting the accuracy and reliability of the design of key indicators such as effective storage capacity and working gas volume of UGSs [10]. Moradi et al. used the numerical simulation method to clarify the effects of injection-production mode, rock deformation and reservoir properties on the phase permeability, condensate oil saturation and gas storage capacity in the multi-cycle injection-production process of UGS [16⇓-18]. Tang et al. [19] carried out a study on the characteristics of fluid phase change during multi-cycle injection-production process of UGS in condensate gas reservoir, focusing on the phase behavior of produced fluid and residual oil after multicycle injection-production. These studies have rarely dealt with the change law and action mechanism of phase behavior of oil and gas system.
In this paper, based on the characteristics of oil and gas phase behavior during cyclic injection-production of UGS under alternating working conditions, the mathematical model and experimental simulation method of oil and gas phase behavior in the injection-production process of UGS were established. By clarifying the changes of oil and gas fluid composition and phase behavior parameters in the injection-production process, the simulation of oil and gas phase behavior in the injection-production process of UGS was realized, providing an important scientific basis for the optimization design of storage capacity parameters.
1. Stage division of oil and gas phase behavior in the injection-production process
The construction of UGS is a process from unidirectional depletion exploitation of a gas reservoir to the formation of storage capacity by gas injection until stable operation for commercial peak shaving. Considering fluid migration, redistribution and phase behavior change, the construction and operation of UGS are divided into 3 stages.
(1) Depletion exploitation of primary gas reservoir to abandonment pressure. For the condensate gas reservoir with oil rim, the primary gas cap and oil rim are in the phase equilibrium state of thermodynamics and component. During the depletion development of gas reservoir, as the formation pressure drops, the physical properties and phase behavior of oil and gas change significantly until the formation pressure drops to the abandonment pressure.
(2) Formation of storage capacity by gas injection. Dry gas is gradually injected into the gas cap to improve the pressure of the abandoned gas reservoir to the upper limit pressure of the gas storage and form the ultimate gas storage capacity. After a large amount of dry gas is injected into the gas cap, the thermodynamic and component phase equilibrium state of the oil and gas system of the abandoned gas reservoir is destroyed, the property of the formation oil changes, and the fluid phase behavior of the gas storage begins to deviate from that at the time of abandonment of the gas reservoir.
(3) Cyclic injection-production. The cyclic injection-production in the interval from the upper to lower operating pressure of the gas storage has the characteristics of large intensity, short duration and quick pressure change. In this stage, the injected gas contacts with the in-situ formation fluid quickly and repeatedly, and the change of oil and gas phase behavior is very complex. As the injection-production cycle increases, the change of fluid phase behavior of gas storage gradually tends to be stable.
2. Mathematical model of oil and gas phase behavior in the injection-production process
In order to deduce the mathematical model of oil and gas phase behavior in the injection-production process, it is assumed that: (1) the oil and gas system is a compositional model with an initial amount of substance of 1 mol; (2) the oil and gas system completes phase equilibrium in a flash; (3) the temperature of the oil and gas system remains unchanged; and (4) the reservoir is rigid, that is, the pore space volume remains unchanged in the injection-production process.
2.1. Stage of depletion exploitation of primary gas reservoir to abandonment pressure
Setting the volume ratio of gas cap to oil rim under the original formation condition as η, the volume of 1 mol oil and gas system under the original formation condition is calibrated as the pore volume of gas reservoir:
Assuming that the depletion exploitation is graded exploitation, and the grade is expressed as k, then, when the gas reservoir is exploited to k-grade pressure, the volumes of oil and gas phases are as follows:
The molar composition of residual oil and gas system at k-grade pressure is:
After the reservoir is exploited at k-grade pressure to the abandonment pressure, the amount of substance of residual oil and gas system is:
2.2. Stage of formation of storage capacity by gas injection
Setting the injection-production cycle as s, which is equal to 0 in the stage of formation of storage capacity by gas injection, then the amount of substance of injected gas at the time when the gas is injected to the upper limit pressure is:
When the gas is injected to the upper limit pressure, the total amount of substance of oil and gas system is:
At the time when the gas is initially injected, the amount of substance of residual oil and gas system is equal to the amount of substance of oil and gas system when its pressure comes to the abandonment pressure by grade k depletion exploitation, i.e. nres,0=nres.
When the gas is injected to the upper limit pressure, the total molar composition of oil and gas system is:
The volumes of oil and gas phases are:
The pore volume of reservoir remains unchanged, and the amount of substance of injected gas can be determined by the Newton iteration method.
2.3. Stage of cyclic injection-production
In this stage, the injection-production cycle s is larger than 0. Similarly, the gas production is set as graded gas production, and the grade is expressed as m. In the interval from the upper to the lower limit pressure, in the period when the gas is produced from the upper limit pressure to grade m pressure, the amount of substance of produced fluid is:
The amount of substance of cumulatively produced fluid is:
The molar composition of residual oil and gas system is:
The molar compositions of oil and gas are:
The percentage of oil volume in total system is:
The solution gas-oil ratio of oil phase is:
When the gas is produced to the lower limit pressure, the total amount of substance of residual oil and gas system is:
After gas production in the sth cycle, gas is injected into the residual oil and gas system to increase the reservoir pressure to the upper limit pressure, so as to simulate the gas injection process of the sth cycle, which is calculated from Eqs. (9)-(13).
3. Experimental simulation on oil and gas phase behavior in the injection-production process
Taking the Shuang 6 gas storage with oil rim in the Liaohe Oilfield, NE China, as an example, the experimental simulation on oil and gas phase behavior in the injection-production process was carried out to verify the accuracy and reliability of the phase behavior mathematical model described above.
3.1. Apparatus
The experimental system for simulating the oil and gas phase behavior in the injection-production process is shown in Fig. 1 . The system has the functions of high- pressure oil-gas separation measurement and on-line fluid component analysis, and includes pressure sensors and temperature sensors. The main body of the phase behavior simulation module is an ultrahigh pressure fluid phase analyzer, in which the reactor with a volume of 400 mL has the maximum temperature resistance of 200 °C and the maximum pressure resistance of 100 MPa.
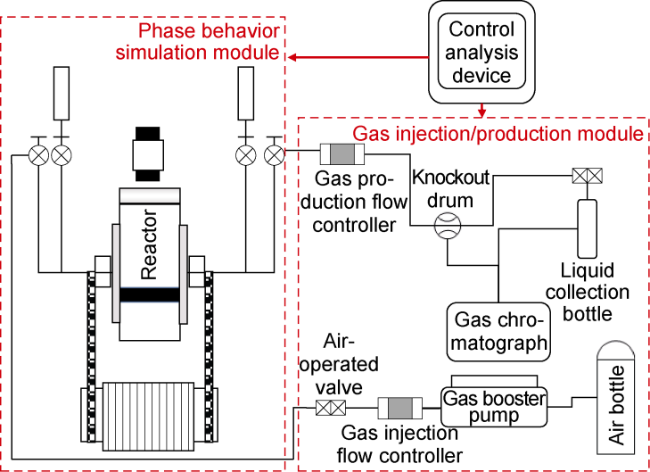
Fig. 1. Experimental system for simulating the oil and gas phase behavior in the injection-production process. |
3.2. Design
3.2.1. Basic parameters
The Shuang 6 gas storage was reconstructed from a gas reservoir with oil rim, and was put into operation in 2014. The designed operating pressure is 10-24 MPa. Seven times of injection and five times of production have been completed up to now. The basic geological and fluid parameters are shown in Table 1 .
Table 1. Basic geological and fluid parameters of Shuang 6 gas storage. |
| Parameter | Value | Parameter | Value |
|---|---|---|---|
| Porosity | 17.3% | Degassed oil density of oil rim | 0.836 2 g/cm3 |
| Permeability | 224× 10−3 μm2 | Degassed oil density of gas cap | 0.748 9 g/cm3 |
| Original pressure | 24.76 MPa | Solution gas-oil ratio of oil rim | 218 m3/m3 |
| Formation temperature | 89 °C | Solution gas-oil ratio of gas cap | 2 548 m3/m3 |
3.2.2. Experimental fluid
The phase recovery analysis method was used to formulate the original formation oil and gas samples [22-23], with the components shown in Table 2 . The verification shows that, for gas cap, the solution gas-oil ratio is 2548 m3/m3, and the degassed oil density is 0.748 9 g/cm3; for oil rim, the solution gas-oil ratio is 218 m3/m3, and the degassed oil density is 0.836 2 g/cm3. The results are consistent with the original formation fluid properties. The calculation of degassed oil density by mathematical model shows that the degassed oil density of gas cap and oil rim is 0.739 4 g/cm3 and 0.839 7 g/cm3, respectively, indicating an error of less than 2%. The C11+ molecular weights of gas cap gas and oil rim oil are 187 and 248, respectively.
Table 2. Components of formation fluids |
| Component | Molar fraction of gas cap gas/% | Molar fraction of oil rim oil/% | ||
|---|---|---|---|---|
| Original formation fluid | Formulated formation fluid | Original formation fluid | Formulated formation fluid | |
| N2 | 1.45 | 1.43 | 0.27 | 0.13 |
| CO2 | 0.65 | 0.65 | 0.70 | 0.31 |
| C1 | 78.24 | 77.87 | 44.35 | 43.13 |
| C2 | 10.31 | 10.38 | 8.81 | 6.58 |
| C3 | 4.19 | 4.24 | 5.36 | 5.11 |
| IC4 | 0.37 | 0.32 | 3.07 | 6.36 |
| NC4 | 0.18 | 0.16 | 1.37 | 2.59 |
| IC5 | 0.38 | 0.35 | 3.07 | 5.22 |
| NC5 | 0.06 | 0.06 | 0.59 | 0.98 |
| C6 | 0.32 | 0.33 | 1.14 | 1.26 |
| C7 | 1.60 | 1.74 | 3.98 | 2.17 |
| C8 | 0.65 | 0.68 | 4.85 | 4.96 |
| C9 | 0.44 | 0.44 | 5.91 | 6.23 |
| C10 | 0.34 | 0.36 | 4.71 | 4.70 |
| C11+ | 0.82 | 1.00 | 11.82 | 10.26 |
3.2.3. Experimental procedure
Based on the fluid characteristics of Shuang 6 gas storage, the experimental procedure was designed according to the three stages divided in Section 1 (Fig. 2 ).
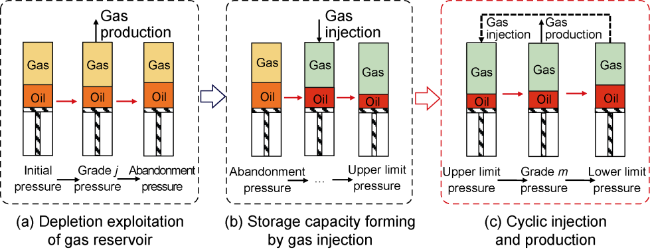
Fig. 2. Flow diagram for simulation experiment of oil and gas phase behavior in the injection-production process. |
(1) In the stage of depletion exploitation of primary gas reservoir to abandonment pressure, the gas cap gas and oil rim oil samples are first placed in a high-temperature and high-pressure reactor as per the volume ratio of gas cap to oil rim of the gas reservoir, and then fully stirred and stabilized. Subsequently, the simulated gas reservoir is developed by depletion in 5 grades at constant volume to the abandonment pressure of 4.00 MPa from the initial pressure of 24.76 MPa [24].
(2) In the stage of formation of storage capacity by gas injection, gas is injected from the top of the reactor at a constant rate of 100 mL/h until the pressure comes to the upper limit (24.00 MPa).
(3) In the stage of cyclic injection-production, the pressure difference between the upper and lower limits of the gas storage is divided into 6 levels. The gas is produced at a constant rate under each level of pressure, and gas production is ended when the pressure reaches the lower limit. Then, the gas is injected from the top of the reactor at a constant rate of 100 mL/h to the upper limit pressure. Thus, one injection-production cycle is completed. In this study, five injection-production cycles were conducted.
3.3. Verification of the phase behavior mathematical model
The volume change of oil rim oil in the reactor in the injection-production process (Fig. 3 ) shows that in the stage of depletion exploitation of primary gas reservoir to abandonment pressure, as the system pressure decreases, the condensate produced by gas cap gas from retrograde condensation is dissolved in oil rim oil, resulting in the rise of fluid level and increase of volume of oil rim oil; in the stage of formation of storage capacity by gas injection, the system pressure gradually increases to the upper limit pressure, and the evaporation and extraction capacity of gas cap gas increases, resulting in the fall of fluid level and decrease of volume of oil rim oil; and in the stage of cyclic injection-production, as the injection-production cycles increase, after multi-cycle evaporation and extraction of gas cap gas, at the end of gas production, the fluid level of oil rim oil gradually falls and the volume of oil rim oil gradually decreases.
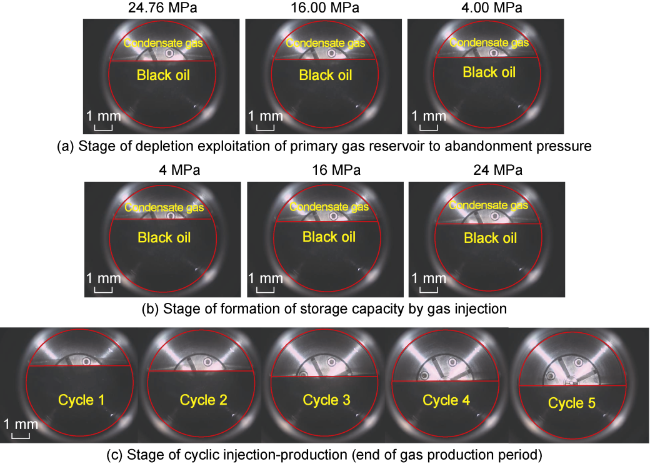
Fig. 3. Volume change of oil rim oil (measured by 45° downdip of PVT reactor). |
The measurement and calculation of oil rim oil volume percentage of the gas storage in the key stages during the injection-production process of the gas storage (Fig. 4 ) show that, in the depletion exploitation process, the oil rim oil volume percentage rises from 3.83% to 12.00%. After the storage capacity is formed by gas injection, at the end of gas production of Cycle 1, the oil rim oil volume percentage drops to 3.62%, some light hydrocarbon components in oil rim oil are evaporated and extracted to gas phase and produced, and the injected gas evaporation and extraction phenomenon is obvious. As additional injection-production cycle goes on, the oil rim oil volume percentage further drops, but after Cycle 4, the drop slows down. This indicates that in the stage of cyclic injection-production, as the injection-production cycle increases, the proportion of pore space occupied by oil rim oil gradually decreases and tends to be stable. Meanwhile, it is observed that the theoretical calculation results are very close to the experimental results, with an error of less than 5%, indicating that the mathematical model built in this paper is reliable.
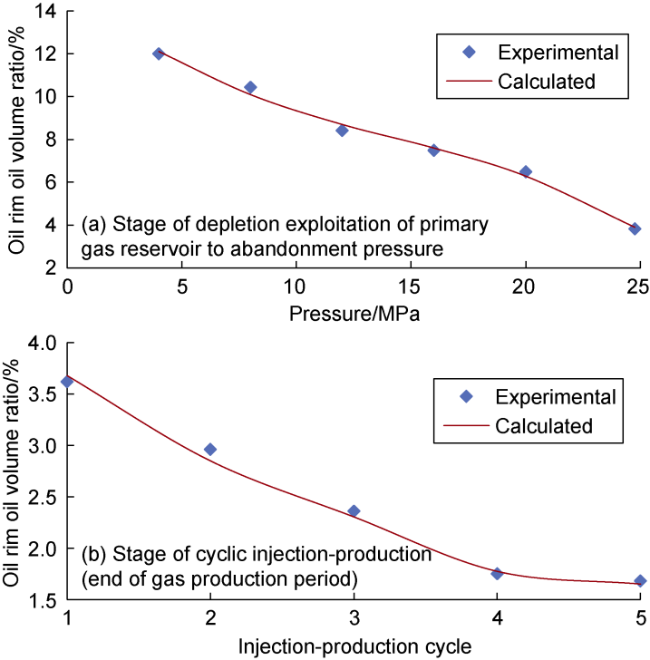
Fig. 4. Experimental and theoretical calculation results of oil rim oil volume percentage. |
4. Characteristics of oil and gas phase behavior in the injection-production process
4.1. Variation of oil/gas composition
The composition of well fluid is divided into 3 pseudo- components: light component (C1+N2), intermediate component (CO2+C2-C6) and heavy component (C7+). The variation of oil/gas components in the injection-production process is shown in Fig. 5 . It can be seen that, under the original formation conditions, when the oil and gas system is exploited by depletion to the pressure before storage construction, the heavy component in the gas cap gas is retrogradely condensed to the oil rim oil, the content of heavy component in the gas cap gas decreases, and that in the oil rim oil increases. Under the conditions before storage construction, from the formation of storage capacity by gas injection to the end of gas production period of Cycle 1, the content of light component in gas cap gas increases and that of intermediate and heavy components in gas cap gas decreases, the content of heavy component in oil rim oil decreases and that of light and intermediate components in oil rim oil increases. As the injection-production cycle increases, the content of light component in gas cap gas increases and that of intermediate component in gas cap gas decreases, so that the gas cap gas becomes light, and the evaporation and extraction ability weakens. After multiple cycles of injection-production, the intermediate component in oil rim oil is extracted to gas phase and produced, and the content of heavy component increases, so that the oil rim oil becomes heavier.
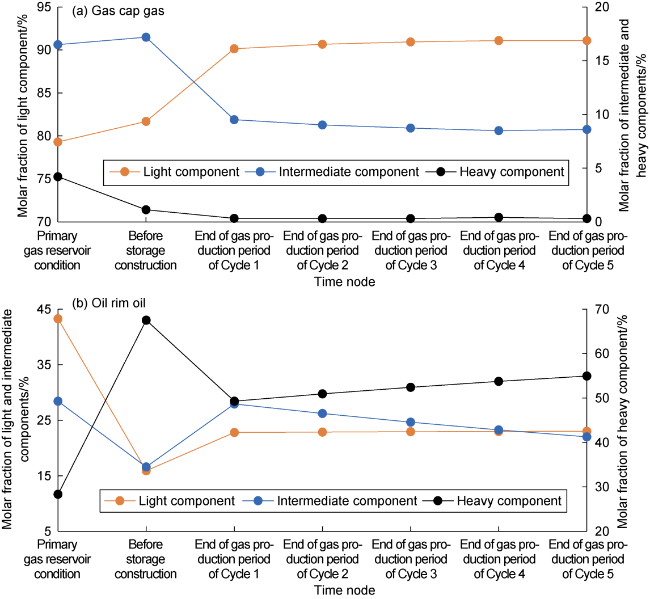
Fig. 5. Variation of oil/gas composition. |
4.2. Variation of physical parameters of oil and gas
The variation of solution gas-oil ratio and volume factor of oil rim oil is shown in Fig. 6 . When the gas reservoir is exploited by depletion under original formation conditions to the pressure before storage construction, the gas-oil ratio of oil rim oil decreases from 218.0 m3/m3 to 50.2 m3/m3, and the volume factor decreases from 1.701 to 1.275. When the gas is injected to form the storage capacity and the gas is produced to the end of gas production period of Cycle 1, the solution gas-oil ratio of oil rim oil increases to 94.0 m3/m3, and the volume factor increases to 1.340, with the reason that the pressure at the end of gas production of Cycle 1 is higher than the abandonment pressure, allowing the oil rim oil to dissolve more gas cap gas. In the stage of cyclic injection-production, as the cycles increase, the content of intermediate component in oil rim oil decreases, resulting in the decrease of gas solubility, and the solution gas-oil ratio and volume factor show a slow downward trend.
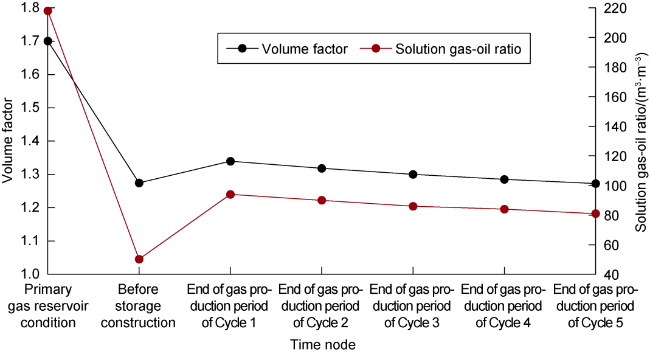
Fig. 6. Variation of volume factor and solution gas-oil ratio of oil rim oil. |
The variation of viscosity and density of gas cap gas and oil rim oil is shown in Fig. 7 . When the gas reservoir is exploited by depletion under original formation conditions to the pressure before storage construction, the density and viscosity of oil rim oil reach the maximum, and those of gas cap gas reach the minimum. When the gas is injected to form the storage capacity and the gas is produced to the end of gas production period of Cycle 1, the solution gas-oil ratio of oil rim oil increases, resulting in the decrease of density and viscosity, while the density and viscosity of gas cap gas increase due to the increase of pressure of the system. In the stage of cyclic injection-production, as the cycles increase, the density and viscosity of oil rim oil gradually increase, and the gas cap gas becomes lighter, but its density and viscosity are less affected.
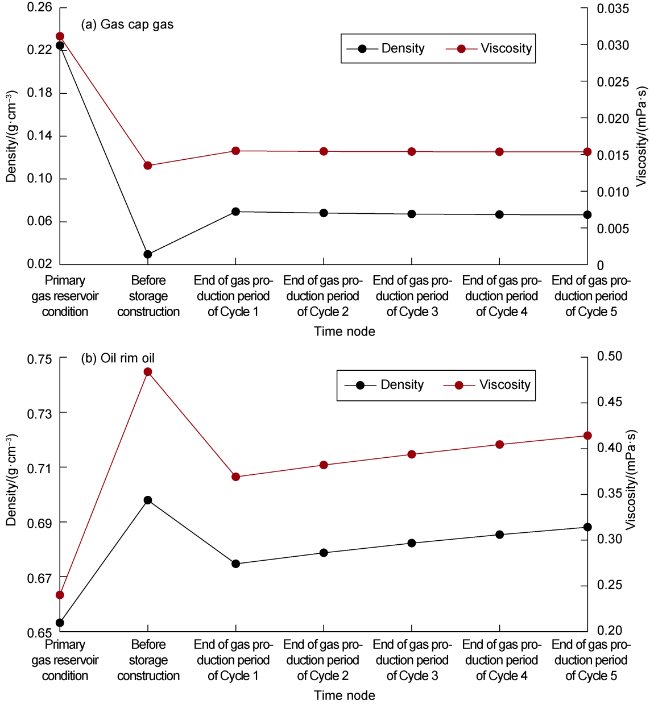
Fig. 7. Variation of viscosity and density of oil and gas. |
4.3. Evolution characteristics of oil and gas phase envelope
The oil and gas phase under primary reservoir condition and before storage construction was analyzed (Fig. 8 ). When the gas reservoir is exploited by depletion at a constant volume to the pressure before storage construction, the overlap area of gas cap gas and oil rim oil envelope decreases, and the difference of oil and gas properties becomes larger. The critical point of gas cap gas envelope is far from the critical point at primary reservoir condition to the left (low temperature direction), and the critical point of oil rim oil envelope is far from the critical point at primary reservoir condition to the right (high temperature direction), indicating that the content of heavy component in oil rim oil increases, and the content of light component in gas cap gas increases.
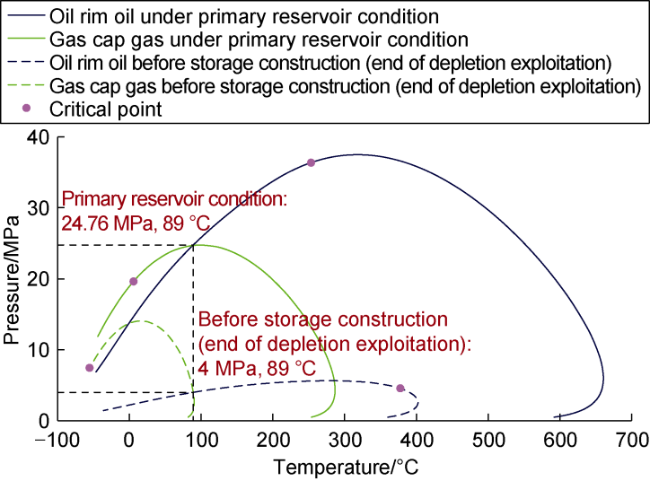
Fig. 8. Formation fluid phase under primary reservoir condition and before storage construction. |
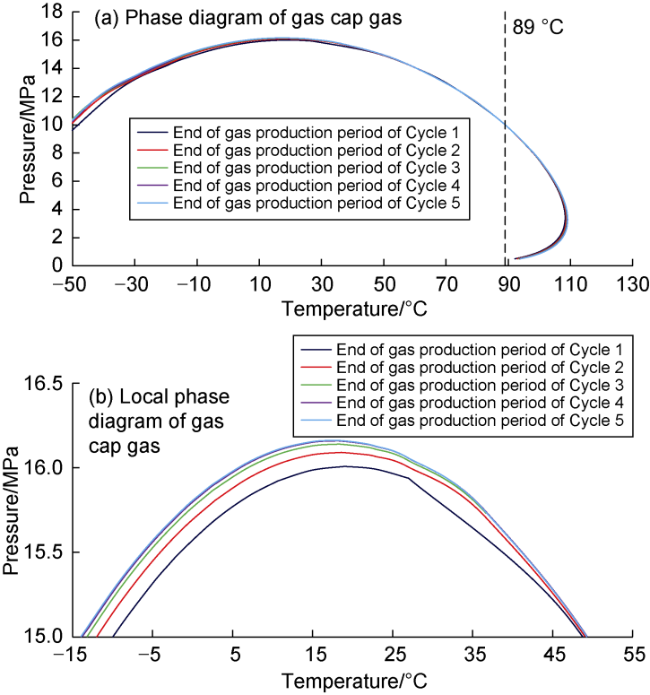
Fig. 9. Phase diagram of gas cap gas at the end of gas production in the stage of cyclic injection-production. |
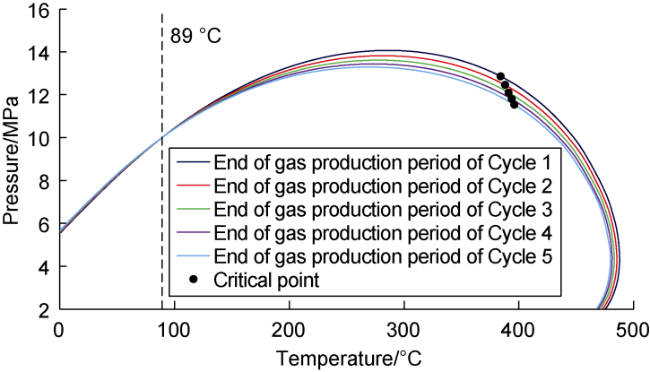
Fig. 10. Phase diagram of oil rim oil at the end of gas production in the stage of cyclic injection-production. |
4.4. Action mechanism of oil and gas phase behavior
The regular variation of phase behavior of oil and gas system in gas storage is closely related to the properties of hydrocarbon components. In the stage of formation of storage capacity by gas injection, the properties of injected dry gas and oil rim oil are quite different. In the period from the formation of storage capacity by gas injection to the end of gas production period of Cycle 1, the heavy component in oil rim oil is gradually evaporated and extracted to the gas phase, and the oil-gas interphase mass transfer effect is strong, with the phase behavior mainly characterized by evaporation and extraction of gas cap gas to oil rim oil as well as dissolution and diffusion in a small degree. When the gas storage enters the stable operation stage of cyclic injection-production, the evaporation and extraction ability of gas cap gas to oil rim oil gradually weakens, with the phase behavior gradually transiting to dissolution and diffusion. As the injection-production cycles increase, the oil rim oil gradually becomes heavy, the gas cap gas gradually becomes light, the drying degree is improved correspondingly, the evaporation and extraction ability of the injected gas is weakened, and the dissolution, diffusion and mass transfer effect of gas to oil is enhanced.
4.5. Case analysis on multi-cycle injection-production operation indexes
Based on the physical parameters of oil and gas in gas storage figured out from the simulation method of oil and gas phase behavior in the injection-production process established in this paper, combined with the dynamic multi-cycle injection-production data, the storage capacity of free gas and the cushion gas volume of solution gas in residual oil were evaluated (Figs. 11 and 12 ).
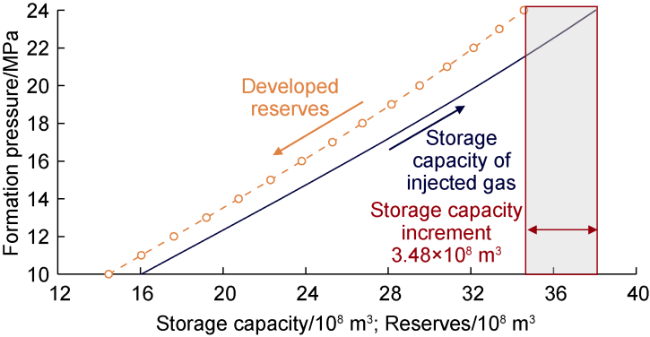
Fig. 11. Comparison between storage capacity of free gas and developed reserves of gas reservoir. |
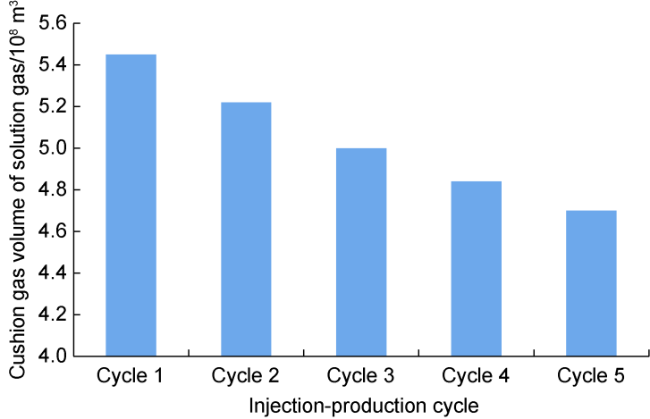
Fig. 12. Cushion gas volume of solution gas in residual oil at the end of gas production of injection-production cycle. |
As shown in Fig. 11 , considering the phase behavior characteristics such as multicomponent mass transfer of injected dry gas and oil rim oil, the evaluated storage capacity of free gas of Shuang 6 gas storage after multi-cycle injection-production is 38.04×10⁸ m3, while the effective storage capacity obtained from dynamic evaluation of depletion exploitation of original gas reservoir is 34.56×10⁸ m3. The former is 3.48×10⁸ m3 or 9.14% higher than the latter. The storage capacity of free gas figured out by the simulation method of oil and gas phase behavior in the injection-production process increases, which is mainly because this method considers the oil and gas phase behavior characteristics under the cyclic injection-production alternating working conditions of the gas storage. During the construction and operation of the gas storage, affected by the multicomponent mass transfer of injected dry gas and oil rim oil, the oil rim oil becomes heavy, and its volume continues to shrink, which frees up more gas storage space and increases the storage capacity of free gas.
In Fig. 12 , as the injection-production cycles increase, the cushion gas volume of solution gas in residual oil rim oil gradually decreases. After 5 injection-production cycles, the cushion gas volume of solution gas in residual oil rim oil of the Shuang 6 gas storage decreases by 13.76% from 5.45×10⁸ m3 to 4.70×10⁸ m3, which is mainly because the residual oil rim oil gradually becomes heavy and the solution gas-oil ratio gradually decreases after multi-cycle injection-production, resulting in the continuous decrease of cushion gas volume of solution gas.
5. Conclusions
The theoretical model and experimental simulation method proposed in this paper have realized the simulation of oil and gas phase behavior of UGS in the injection-production process, and revealed the characteristics and action mechanism of oil and gas phase behavior in UGS. The calculation results are verified accurate and practical.
Experimental and theoretical studies show that in the period from the formation of storage capacity by gas injection to the end of gas production period of the first injection-production cycle, the oil and gas phase behavior is mainly characterized by evaporation and extraction of gas cap gas to oil rim oil as well as dissolution and diffusion in a small degree. For gas cap gas, the content of light component increases, the content of intermediate and heavy components decreases, and the density and viscosity increase. For oil rim oil, the content of heavy component decreases, the content of light and intermediate components increase, the density and viscosity decreases, and the volume factor and solution gas-oil ratio increase.
In the stable operation stage of cyclic injection-production of gas storage, the oil and gas phase behavior is characterized by the gradual weakening of evaporation and extraction of gas cap gas to oil rim oil, and the gradual enhancement of dissolution and diffusion. For gas cap gas, the content of intermediate component decreases slowly, the content of light component increases slowly, the gas cap gas becomes lighter, but the density and viscosity are less affected. For oil rim oil, the content of heavy component increases, the content of intermediate component decreases, the density and viscosity increase, and the volume factor and solution gas-oil ratio decrease.
Nomenclature
a—intermolecular gravitational coefficient, MPa•cm6/mol2;
b—volume correction coefficient, cm3/mol;
c—volume translation parameter, cm3/mol;
fg,k, fo,k—molar fraction of gas and oil phases in residual oil and gas system after grade k depletion exploitation, dimensionless;
fg,s, fo,s—molar fraction of gas and oil phases in residual oil and gas system at the end of gas injection of cycle s, dimensionless;
fo,m,s—molar fraction of oil phase in residual oil and gas system after grade m gas production of cycle s, dimensionless;
GORm,s—solution gas-oil ratio of oil rim oil in residual oil and gas system after grade m gas production of cycle s, m3/m3;
i—serial number of component;
j—jth depletion depressurizing;
k—depletion depressurizing times;
Ki,m,s—equilibrium constant of component i in gas and liquid phases in residual oil and gas system after grade m gas production of cycle s, dimensionless;
m—depletion depressurizing gas production times;
M—average molecular weight, g/mol;
no—amount of substance of oil rim oil in 1 mol oil and gas system under primary reservoir condition, mol;
nres,0—amount of substance of oil and gas system at the time when the gas is initially injected (before storage construction), mol;
nres—amount of substance of residual oil and gas system at abandonment pressure, mol;
ninj,s—amount of substance of injected gas at the end of gas injection of cycle s, mol;
nres,s—amount of substance of residual oil and gas system at the end of gas production of cycle s, mol;
ntol,s—total amount of substance of oil and gas system at the end of gas injection of cycle s, mol;
—amount of substance of gas phase when oil phase is flashed to standard state at the end of grade m gas production of cycle s, mol;
—amount of substance of oil phase when oil phase is flashed to standard state at the end of grade m gas production of cycle s, mol;
Np,0—total amount of substance of original oil and gas system, taking 1 mol;
ΔNp,j—amount of substance of produced fluid at grade j depletion production, mol;
ΔNp,j,s—amount of substance of produced fluid at grade j depletion production of cycle s, mol;
Np,k—amount of substance of cumulatively produced fluid at grade k depletion exploitation, mol;
Np,m,s—amount of substance of cumulatively produced fluid at grade m gas production of cycle s, mol;
p—original formation pressure, MPa;
ph—upper limit pressure of gas storage operation, MPa;
pk—grade k depletion exploitation pressure, MPa;
pm—grade m gas production pressure, MPa;
R—molar gas constant, MPa·cm3/(mol·K), taking 8.314 5;
s—injection-production cycles;
Sm,s—percentage of oil phase volume in total system at grade m gas production of cycle s, %;
T—original formation temperature, K;
v—molar volume, cm3/mol;
Vd—total volume of 1 mol oil and gas system under original formation conditions, cm3;
Vg,k—gas phase volume in residual oil and gas system at grade k depletion exploitation, cm3;
Vo,k—oil phase volume in residual oil and gas system at grade k depletion exploitation, cm3;
Vg,s—gas phase volume at the end of gas injection of cycle s, cm3;
Vo,s—oil phase volume at the end of gas injection of cycle s, cm3;
Vg,m,s—gas phase volume at the end of grade m gas production of cycle s, cm3;
Vo,m,s—gas phase volume at the end of grade m gas production of cycle s, cm3;
xi,m,s—molar fraction of oil phase at the end of grade m gas production of cycle s, %;
yi,m,s—molar fraction of gas phase at the end of grade m gas production of cycle s, %;
yi,j—molar fraction of gas phase at the end of grade j depletion exploitation, %;
zi—molar fraction of i component in oil and gas system under original formation conditions, %;
zi,m,s—molar fraction of i component in residual oil and gas system at the end of grade m gas production of cycle s, %;
zi,s—molar fraction of i component in oil and gas system at the end of gas injection of cycle s, %;
zinj,i—molar fraction of i component in injected gas, %;
zres,i—molar fraction of i component in oil and gas system at abandonment pressure, %;
zres,i,s—molar fraction of i component in residual oil and gas system at the end of gas production of cycle s, %;
Zg—compressibility factor of gas phase under original formation conditions, dimensionless;
Zo,k—compressibility factor of oil phase in residual oil and gas system at the end of grade k depletion exploitation, dimensionless;
Zg,k—compressibility factor of gas phase in residual oil and gas system at the end of grade k gas production, dimensionless;
Zinj—compressibility factor of injected gas at upper limit pressure, dimensionless;
Zo,s—compressibility factor of oil phase in oil and gas system at the end of gas injection of cycle s, dimensionless;
Zg,s—compressibility factor of gas phase in oil and gas system at the end of gas injection of cycle s, dimensionless;
Zg,m,s—compressibility factor of gas phase in residual oil and gas system at the end of grade m gas production of cycle s, dimensionless;
Zo,m,s—compressibility factor of oil phase in residual oil and gas system at the end of grade m gas production of cycle s, dimensionless;
—compressibility factor of gas phase in residual oil and gas system when oil phase is flashed to standard state at the end of grade m gas production of cycle s, dimensionless;
—compressibility factor of oil phase in residual oil and gas system when oil phase is flashed to standard state at the end of grade m gas production of cycle s, dimensionless;
Zo—compressibility factor of oil phase under original formation conditions, dimensionless;
—temperature function, dimensionless;
ρ—density, g/cm3;
βm,s—molar fraction of gas phase in residual oil and gas system at the end of grade m gas production of cycle s, dimensionless;
η—volume ratio of gas cap to oil rim under original formation conditions.