

Introduction
Building and operation of underground gas storages (UGSs) are characterized by periodicity, high flow rate, quick injection-production and alternating load, in order to meet the needs for peak shaving in extreme cold weather and emergency responses [1⇓-3]. In China, the existing UGSs are mainly reconstructed from gas reservoirs which have entered their middle and late development stages. In the process of UGS capacity construction, fluid displacement by gas is mainly conducted, in conjunction with gas huff-and-puff [4⇓-6]. Influenced by factors such as water invasion after formation pressure depletion, the distribution law of underground fluid becomes very complex [7], making it difficult to build UGSs.
Scholars have studied the influencing factors on key indices such as effective storage capacity and working gas volume of UGSs through indoor physical experiments. Tooseh et al. [8] pointed out that the main factor affecting the storage capacity during the construction of a UGS is the gas injection rate. Ban et al.[9] found that reservoir physical properties, water invasion and gas and water seepage variation are main factors affecting the efficiency of UGS construction, and pointed out that there is a certain correlation between the injection-production rate and gas-flooding efficiency. Du et al. [10] conducted a sensitivity experiment on gas injection and production rates, and identified the relationship between gas injection rate and storage capacity, gas production rate and efficiency for gas-driven water when constructing a reservoir into a UGS. However, due to the small core size used in the experiment, it was difficult to clearly understand the fluid distribution and expansion law during the operation of the UGS.
At present, the seepage mechanism of reconstructing a water-drive gas reservoir into a UGS is mainly carried out by physical simulation using conventional cylindrical cores (2.5 cm or 3.8 cm in diameter, and 2 to 3 times the diameter in length) or by two-dimensional and three-dimensional numerical simulation methods to study the pore producing law and expansion mechanism of the reservoir. Under the influences of single seepage dimension, small core size and small total pore space, the simulation accuracy is low and the measurement error is large. The experiment results are very limited, and difficult to reflect the pore producing law in the two-dimensional seepage process in real formation [11⇓⇓-14]. Flat-plate models are mainly used to simulate reservoir development, but they have not been used in injection-production experiments on UGSs.
In this paper, an experimental method for simulating UGS injection and production is established based on an independently developed large-scale two-dimensional flat-plate high-pressure system, in order to investigate the production dynamics and pressure changes during UGS construction, multi-cycle injection-production process and identify the factors affecting storage capacity and expansion under varying permeability conditions.
1. Experiment design
All one-dimensional cylindrical cores and two-dimensional flat cores are made of the same batch of outcrop rock samples to perform gas injection storage construction and operation tests using the one-dimensional cylindrical core and two-dimensional flat core models. A total of two cylindrical cores and two flat cores were made for testing. Cores of the same type are similar in size. The cylindrical core is 3.8 cm in diameter and 30.1 cm long while the size of flat core is 30 cm × 30 cm × 4.5 cm. The absolute permeability of 1# cylindrical core and 1# two-dimensional flat core is 104.0×10⁻³ μm2, and that of 2# cylindrical core and 2# flat core is 1.4×10⁻³ μm2.
1.1. One-dimensional cylindrical core experiment
The experiment on the one-dimensional cylindrical cores was conducted to investigate the gas injection and production volumes and gas loss variation law during UGS operation under different water saturations. The result provided a basis for dividing the types of working zones in subsequent two-dimensional flat core experiments. During the experiment, two cylindrical cores and 99.99% pure CH4 were used to perform injection and production under varying water saturation conditions. Fig. 1 shows the experimental setup. The experiment procedures are as follows: (1) Vacuumize 1# cylindrical core and create different water saturation environments (50%-98%) using the steady-state method. To ensure consistent experiments, pressure and differential pressure settings during the one-dimensional core experiment were consistent with the two-dimensional flat core plate experiment, and set the system back pressure at 8 MPa; (2) Close the outlet, and enhance the pressure to 16 MPa by injecting gas at a constant speed (1.0 mL/min), and then kept standing for 12 h; (3) Open the outlet, and then produce gas at a constant speed (1.5 mL/min). Record the gas volume and the fluid volume produced, and end the experiment until no fluid from the outlet; (4) Use 2# cylindrical core and repeat steps (1)-(3).
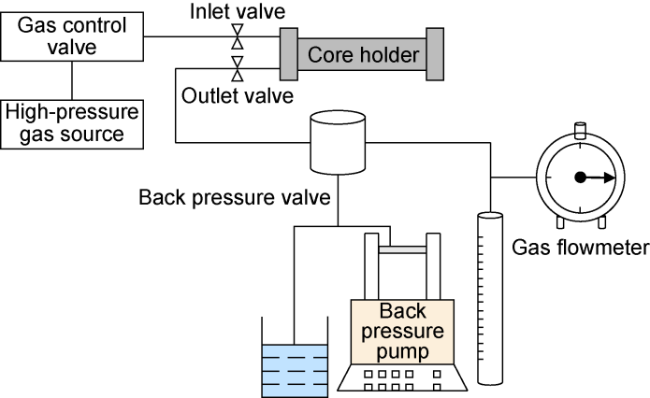
Fig. 1. Experiment setup for gas injection and production on one-dimensional cores. |
1.2. Two-dimensional flat core experiment
For the preparation of two-dimensional flat core models: 17 well sites were located on a flat core for pressure monitoring as well as injection and production, and 32 pairs of electrodes were placed on the core to monitor the variation of gas and water migration and overall water saturation during UGS construction and operation. Finally, the whole model was cast with epoxy resin to form an isolation layer on the core surface (Fig. 2 ).
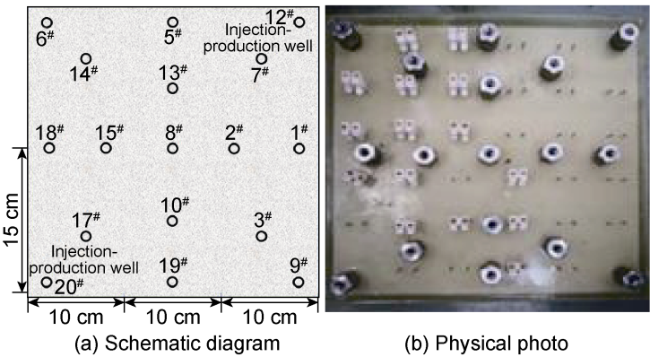
Fig. 2. Schematic diagram and physical photo of the two-dimensional flat core model. |
The high-temperature and high-pressure experiment setup (Fig. 3 ) consists of a core model, a high-temperature and high-pressure chamber, a multi-point saturation/pressure acquisition system, a temperature acquisition and control system, a flow control valve, a high- pressure drying unit, gas-water separator, a back pressure pump and a confining pressure pump. Using the saturation and pressure monitoring system, the multi-point saturation and pressure of the core model could be monitored in real time while gas injection and production rates could be controlled by throttling the cross-section of the gas flow controlling valve.
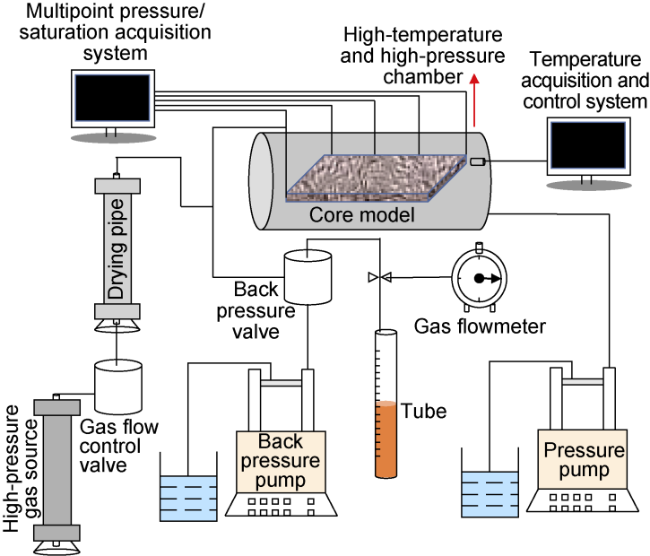
Fig. 3. Schematic diagram of the high-temperature and high-pressure experiment system for flat core model. |
Injection-production parameters: Taking the Hutubi UGS in Xinjiang, NW China, as an example, the formation thickness of the UGS is 50 m, the well spacing is 100 m, and the injection and production volumes per well are 66.5×10⁴ m3/d and 100.0×10⁴ m3/d respectively. According to the theory that the average flowing speed is similar among all pores [15] and the parameters of the physical model, the UGS injection and production rates are calculated to be 0.30 mL/min and 0.45 mL/min, respectively.
The following steps were taken during the experiment: (1) 1# two-dimensional flat core model was loaded into the high-temperature and high-pressure chamber for 24 h under vacuum. Then the 20# well was opened to naturally absorb water until the model was saturated, and then, water was injected at constant pressure difference (0.1 MPa) through the well for 3 d. The saturated water volume and porosity were calculated according to the difference between the injected and the produced fluid volumes. (2) With the back pressure maintaining at 8 MPa, gas was injected into 20# well at 0.30 mL/min while fluid was produced from 12# well to displace water with gas until no more water was produced from the well. Then, the well was closed, and the overall produced water volume was calculated. (3) Gas was injected into 20# well at 0.30 mL/min until the overall pressure of the model reached 16 MPa (the peak pressure of UGS). The first cycle of storing gas was ended. (4) With the back pressure controlled at 8 MPa, 20# well was opened for gas production at a constant rate (0.45 mL/min). Water saturation was monitored at all test points in real time, and the produced fluid and gas volumes were calculated until no more fluid was produced from the well. (5) Gas was injected into 20# well at a constant rate (0.30 mL/min), and the inlet pressure of the model was monitored in real time until it increased to the upper limit (16 MPa). Then the well was closed for 12 h to balance the pressure inside the model. (6) Repeated steps (4) and (5) to complete 6 cycles of injection and production. (7) 2# two-dimensional flat core model was used for test and repeated steps (1)-(6).
2. UGS building and operating dynamics of one-dimensional cylindrical core model
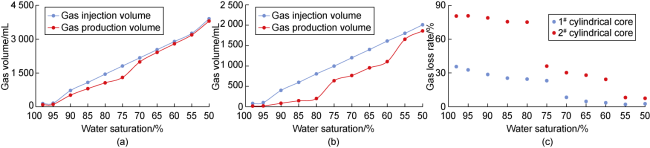
Fig. 4. Injection-production volume dynamics of cylindrical core model. (a) Volume of gas injection and production of 1# cylindrical core; (b) Volume of gas injection and production of 2# cylindrical core; (c) Gas loss rate. |
According to the injection-production volume dynamics of the one-dimensional core model, water saturation is a key factor affecting gas loss in the UGS. If there is a local flooded layer in the storage space of the UGS, the injected gas would be lost greatly in this high water-cut zone, which may increase the ineffective storage capacity and gas loss of the UGS. The problem can be addressed by reducing water saturation by taking measures such as displacement drainage.
Notably, the permeability of 1# cylindrical core is higher. The gas loss rate was higher and the gas flow in the core became more difficult when the water saturation was greater than 75%, and the gas loss rate greatly reduced as water saturation dropped below 75%. Accordingly, the working zones of the model can be divided into two types: a high-efficient working zone characterized by water saturation less than 75%, and a low-efficient working zone where water saturation is greater than or equal to 75%. Similarly, with the low permeability of the 2# cylindrical core, the working zones can be grouped into three types: an ineffective working zone with water saturation greater than 80%, a low-efficient working zone with water saturation of 55%-80%, and a high-efficient working zone with water saturation less than 55%.
3. 2D flat core gas storage model construction and operating dynamics
3.1. UGS construction through water displacement
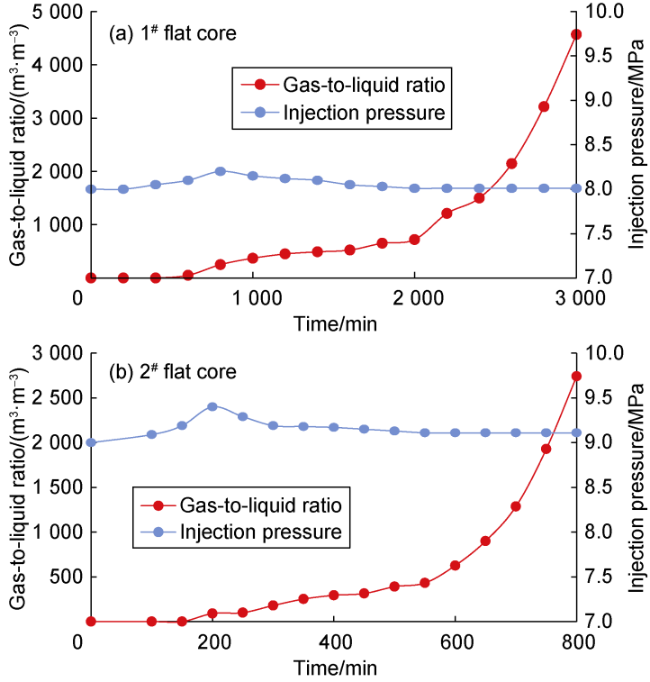
Fig. 5. Dynamic curves during water displacement in the flat core model. |
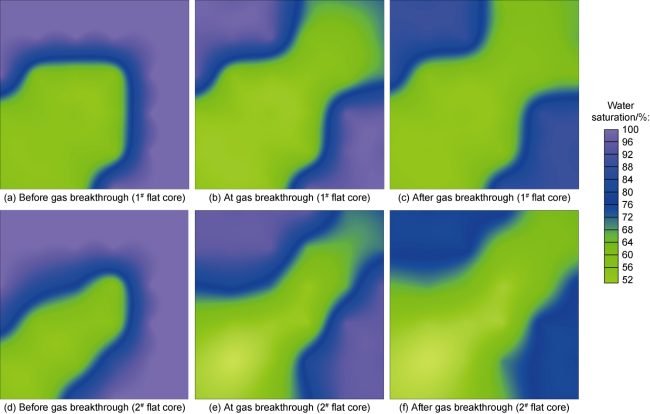
Fig. 6. Distribution of water saturation at different time points during water displacement from the flat core model. |
3.2. Multi-cycle injection-production
When the flat core model moved into the stage of multi-cycle injection-production, the formation water was continuously produced after gas was injected, and the capacity of the UGS model became larger. Fig. 7 illustrates the water saturation distribution at the end stage of production in 1# flat core model after different cycles of gas injection-production. After four cycles, the effective working zone in the UGS model was mostly distributed near the injection well, and gradually expanded to the both sides of the preferential gas channels formed after water was displaced, and the gas saturation in the effective working zone increased (Fig. 7 a, 7b). The gas swept zone and the gas saturation in the swept zone did not change anymore from the fifth to sixth cycles (Fig. 7 c, 7d).
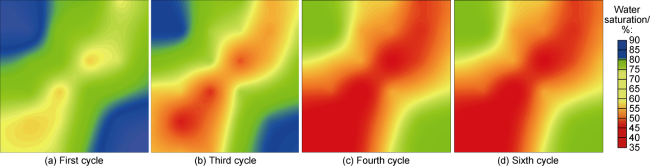
Fig. 7. Distribution of water saturation at the end of production stage in 1# flat core model after different cycles of gas injection-production. |
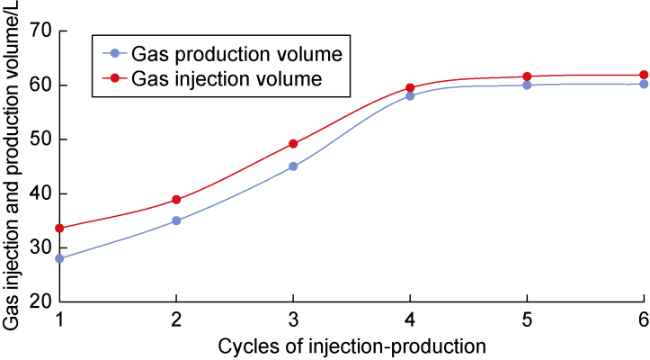
Fig. 8. Curves of gas injection and production volumes of 1# flat core model. |
The variation of the storage capacity of the 2# flat core model is similar to that of the 1# flat core model. The effective working zone of the UGS model expanded to both sides of the preferential gas channels in the first four cycles of injection-production, and the gas swept zone and the gas saturation in the swept zone did not change much during the last two cycles (Fig. 9 ). However, the model expansion was slow due to the low permeability of the core. The maximum storage capacity of 44.3 L was finally reached after five cycles of injection-production (Fig. 10 ). The efficiency of water displacement after reaching the maximum capacity was calculated to be merely 14.7%, far lower than that of the 1# flat core model.
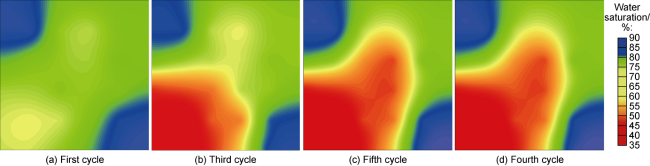
Fig. 9. Distribution of water saturation after different cycles of gas injection-production in 2# flat core model. |

Fig. 10. Curves of gas injection and production volumes of 2# flat core model. |
The working zones of the flat core model at the maximum capacity were classified according to the criteria for the cylindrical core model (Fig. 11 ). (1) In 1# flat core model, the high-efficient working zone accounts for about 73% of the total area. Since the gas saturation in this zone was high, there was basically no free water, and the gas flow resistance during the UGS operation stage was low. The low-efficient working zone where some free water existed covered approximately 27.0%, and free water affected the gas flow during UGS operation. There was no inefficient working zone in this model. (2) The high-efficient working zone accounts for 45.0% of the total area in the 2# flat core model, the low-efficient working zone accounts for about 44.6%, and the ineffective working zone accounts for 10.4%. The better reservoir physical properties of the UGS bring a larger high-efficient working zone.
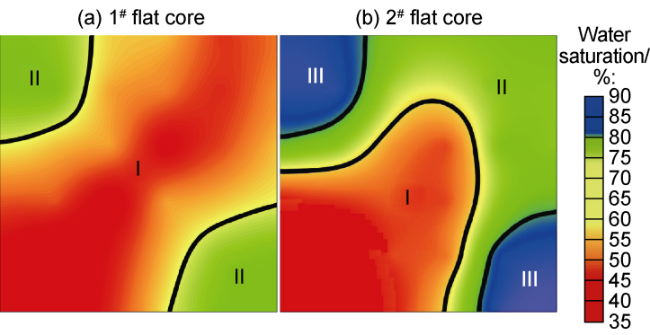
Fig. 11. Work zones of the flat core models at the maximum capacity. I-High-efficient working zone; II-Low-efficient working zone; III-Ineffective working zone. |
3.3. Factors affecting the storage capacity of the UGS model
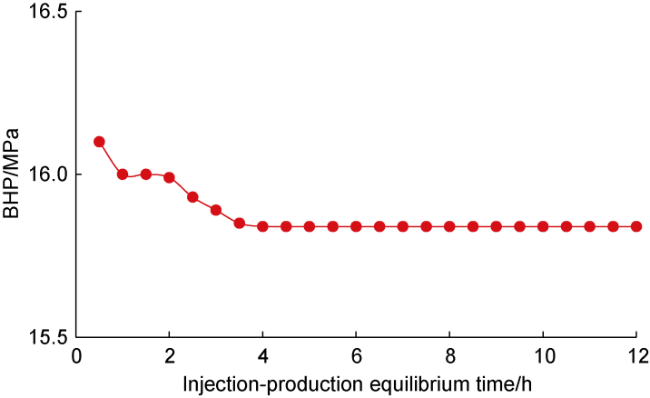
According to the experimental results, there are three factors affecting the storage capacity during the operation of the UGS model. (1) Permeability: The higher permeability of the UGS model led to the higher efficiency of water displacement, higher utilization rate of storage space, and larger UGS capacity. In the model with higher permeability, the ineffective working zone was small or inexistent, the loss of injected gas was less, and the utilization rate was higher than those of the model with lower permeability. (2) Water saturation: The experiment on the cylindrical core model suggests that gas loss rose with the increase in water saturation. Lowering water saturation by optimizing gas injection-production and water displacement could effectively reduce gas loss in the UGS. (3) Injection-production equilibrium time: From monitoring the pressure variations during the equilibrium of multi-cycle injection-production in the flat core model (Fig. 12 ), the bottom hole pressure (BHP) decreased slightly in the early equilibrium phase (less than 0.5 MPa) and then became stable after 4 h. Therefore, extending the equilibrium phase did not contribute more to the expansion of the gas storage.
Fig. 12. Pressure variations in the first cycle of injection- production equilibrium phase in 1# flat core model. |
4. Conclusions
In the process of gas reservoir-type UGS capacity construction and operation, the storage space can be divided into three zones: high-efficient working zone, low-efficient working zone and ineffective working zone. Higher reservoir permeability leads to higher pore utilization efficiency, smaller or no ineffective working zone, less gas loss and a higher gas utilization rate.
Better reservoir physical properties and large storage space contribute to a larger UGS capacity. Higher water saturation results in more gas loss during UGS capacity construction and operation. Optimizing water displacement and lowering the water saturation may reduce gas loss.
During multi-cycle injection and production, there is a reasonable equilibrium time interval of gas injection and production. Beyond this interval, extending the equilibrium phase won’t contribute more to the expansion of UGS capacity.