

Introduction
Natural gas plays a "ballast" role in the green energy transition of China because of its clean, low-carbon, and flexible storage characteristics [1-2]. As an essential part of natural gas, shale gas has been effectively developed in Sichuan and Chongqing regions in recent years [3]. Its production is expected to reach more than 430×108 m3 by 2025, and can strongly support the achievement of the "14th Five-Year Plan" for the development target for oil and gas resources, which is the "annual production of natural gas reaching above 2300×108 m3" [4]. The industrialized development of shale gas requires horizontal well drilling technology which imposes extremely high requirements on the inhibition and lubricity of drilling fluids [5]. Compared with water-based drilling fluids, oil-based drilling fluids (OBDF) performs better in inhibiting clay minerals hydration and lubrication, which can significantly improve wellbore stability [6]. However, when drilling into fractured formations, wellbore instability cases such as collapsing and breaking often occur, resulting in decreasing ROP (rate of penetration), sticking, stagnating WOB (weight on bit), and even burying drilling tools and wellbore abandoned, which significantly restricts the effective exploitation of shale gas in Sichuan and Chongqing regions, SW China [7].
Many submicron fractures and pores are developed in shale. Meanwhile, its lipophilicity is relatively strong [8], inducing a high capillary pressure to drive the oil phase to invade the shale. When the drilling fluids column pressure is significantly higher than the formation pore pressure, the oil phase intrusion would be more serious. Oil phase intrusion, on the one hand, triggers the transfer of drilling fluids column pressure in the formation, which can increase the formation pore pressure and easily cause the formation to crack or spall along the bedding planes or weak interfaces [9]. On the other hand, organic matters such as kerogen and asphalt in formation are prone to swell or even be dissolved after contacting oil phase, causing uneven stress distribution in the rock and further aggravating wellbore instability [7]. The intrusion of oil phase from OBDF into formation is the crucial cause for wellbore instability caused by drilling fluids [10]. Many researches have been carried out for many years at home and abroad on wellbore instability caused by oil phase intrusion, which is mainly focused on plugging technology to inhibit oil phase intrusion and thus improve wellbore stability. The existing plugging agents mainly include conventional micro- and nano-sized agents. However, it is hard to plug the micro- and nano-pores/ fractures in shale using conventional micro-sized plugging agents [11]. In contrast, due to the large specific surface area and high surface energy, the nano-sized plugging agents aggregate easily after being added to the non-polar oil phase, and largely increase in size, which may weaken the plugging effect on the micro- and nano-pores in shale [12-13]. Therefore, present plugging technology fails to eliminate wellbore instabilities caused by oil phase intrusion.
Oleophobic agents can be used to change the surface wettability of solid phase to be oleophobic, thus to inhibit oil phase from spreading on the solid surface and prevent oil phase from intruding into the pores of the solid phase by reversing capillary pressure [14⇓⇓-17]. Therefore, we can use oleophobic agents to change the shale surface wettability to be oleophobic and prevent oil phase intrusion [18] to improve shale wellbore stability. Geng et al. [19-20] demonstrated that achieving oleophobic modification requires both increasing the surface roughness of the solid phase and significantly reducing its surface energy. The existing oleophobic agents are mainly nanomaterials which can only build a single level of nanoscale roughness after adsorbed on the solid-phase surface [21-22], thus limiting the roughness improvement. Micro- and nano-structured composite materials can build multiple levels of micro- and nano-roughness on the solid phase surface [23-24], which is beneficial to enhance the effect of oleophobic modification. However, few studies have been reported on micro- and nano-composites for oleophobic modification. Based on this, this paper prepares a composite material with micron styrene as the core and nano-silica as the embedded particles by Pickering emulsion polymerization and further grafts low surface energy modifiers on the composite material through the sol-gel method to develop a micro- and nano-structured oleophobic agent. The effects of the oleophobic agent on changing rock surface properties and inhibiting oil phase imbibition are investigated. The performance of the new oleophobic agent to improve the stability of shale gas well wall and the related mechanism are researched.
1. Experiment
1.1. Experiment materials
Styrene (analytically pure), nano-silica (purity of 99.5%-100.0%, particle size of (30±5) nm), azobisisobutyronitrile (analytically pure), ethanol (analytically pure), ammonia (purity of 25%-28%), and acetic acid (analytically pure), all purchased from Shanghai Macklin Biochemical Co., Ltd. Perfluorooctyl triethoxy silane (PFT, purity of 97%-100%) was provided by Shanghai Dibo Biotechnology Co., Ltd. Lyophobic nanofluid SA was made by grafting PFT on the surface of nano-silica using the sol-gel method in laboratory [19]. OBDF additives such as primary emulsifier (DR-EM) and secondary emulsifier (DR-CO) were provided by CNPC Engineering Technology R&D Co. Ltd. #3 white oil (industrial product) was purchased from Shandong Zhuyou Lubricity Science and Technology Co., Ltd. Shale cores taken from the outcrop of the Silurian Longmaxi Formation in the Sichuan Basin were cut into cylinders of 25 mm in diameter and 50 mm in height, and dried at 105 °C for 24 h. Thin rock slices (disc-shape) of about 10 mm thick were prepared from shale cores using wire-cut equipment (DT400, DATIE CNC). Both terminal faces of the slices were smoothed and dried at 105 °C for 24 h. The capillary glass tubes (0.2 mm ID) were purchased from Shanghai Xinpeng Glass Instruments Co., Ltd.
1.2. Synthesis of oleophobic agent
The realization of oleophobic modification requires both improving the rock surface roughness and reducing the surface energy [25]. Using the Pickering emulsion polymerization method, nano-silica was used as a solid emulsifier for emulsion polymerization of styrene monomers. The polymerization reaction occurred in the dispersed styrene monomer droplets, and finally, micron-sized polystyrene particles with nano-silica embedded on the surface were synthesized to build micro-and nano-structure. Then, OL-1, an oleophobic agent, was synthesized by grafting low-surface-energy groups —CF3 and —CF2— on the surface of the nano-silica. When OL-1 particles were adsorbed on the solid surface, its surface roughness was increased through the micro- and nano-structure of OL-1, and its surface energy was reduced through the low-surface-energy groups, thus to achieve the effect of oleophobic modification.
The specific procedures are as follows: Mix 0.1 g azobisisobutyronitrile with 10 g styrene, and add 100 mL deionized water into the reaction flask. Add 10 g nano- silica into the flask while stirring slowly, and then treat the fluid with an ultrasonic cleaner (Shanghai KUDOS, SK250HP) for 30 min. Adjust the pH value of the fluid system to 3 by dropping acetic acid into it, and then stir the system to keep reacting for 10 h at 200 r/min and 65 °C to obtain white emulsion AL-1. Centrifuge the solid phase from the AL-1 and dry it at 105 °C. Grind the dried solid phase and take 18 g and add into the mixture of 90 g ethanol and 10 g DI water. After treating the system for 30 min, adjust the pH value to 10 by dropping ammonia. Stir the system and at the same time drop into 2 g PFT at 200 r/min and 70 °C. Finally, a white emulsion product obtained after reacting for 4 h, which is the oleophobic agent OL-1.
1.3. Chemical composition and structural analysis
1.3.1. Infrared spectroscopy
The solid phase was centrifuged from AL-1 and OL-1, then rinsed with ethanol three times, and dried at 105 °C for 6 h. The dried solid was mixed with KBr and then pressed into tablets. The tablets were further tested using a Fourier transform infrared spectroscopy (AVATAR 320 Madison, Wisconsin) in the range of 500-4000 cm−1.
1.3.2. Thermogravimetric analysis
An appropriate amount of the dried solid powder was taken after IR spectroscopy test and placed in a test pot. The thermogravimetric loss of the specimen was measured at 30-800 °C by a thermogravimetric analyzer under nitrogen atmosphere at temperature-increasing rate of 10 °C/min.
1.3.3. Scanning electron microscope energy spectrum test
1 g AL-1 and 1 g OL-1 emulsions were added to 100 mL ethanol and sonicated for 30 min. Then the suspension was dropped onto conducting resin. The resin was dried and coated with gold. Finally, the specimen was characterized using a scanning electron microscopy (EM-30AX, COEXM).
1.4. Evaluation of rock surface modification effect
To analyze the effect of oleophobic agent OL-1 on rock roughness, surface energy and wettability, SA, a laboratory prepared lyophobic nano-liquid, was introduced [19]. The type and content of low-surface-energy modification materials grafted on SA are the same as that grafted onto OL-1. The only difference is that SA is composed of nano particles, while OL-1 is composed of micro-nano composites. The effect of micro- to nano-scale materials on oleophobic modification can be clarified by comparing the modification effects of SA with OL-1 on rock surface. The effect of low surface energy materials on oleophobic modification can be appraised by comparing the modification effects of AL-1 with OL-1 on rock surface.
1.4.1. Surface roughness test
OL-1, AL-1 and SA were diluted 100 times with ethanol, and then sonicated, and dropped onto the surface of single-crystal silicon. After being dried, the sample was tested using a high-resolution atomic force microscope (SPM-8100FM, Shimadzu, Japan) in a contact mode.
1.4.2. Surface energy test
5 g of SA, AL-1 and OL-1 emulsions each, with effective solid content (mass fraction) of 20%, were added into 95 g ethanol. After sonicated, the ethanol suspensions with 1% solid content were prepared. The core slice was soaked into the ethanol suspension for 30 min. Then the core slice was taken out and dried at 70 °C for 10 min. The surface free energy of the core slice was calculated by testing the contact angles of deionized water and n-hexadecane on the core surface before and after modification using the Owens two-liquid method according to Eqs. (1) and (2) [26]:
The dispersion force, polarity force and surface energy of deionized water are 21.8, 51.0 and 72.8 mN/m, respectively. The dispersion force, polarity force, and surface energy of n-hexadecane are 27.6, 0 and 27.6 mN/m, respectively.
1.4.3. Wettability evaluation
The core slice was soaked in the ethanol suspensions with 1% mass fraction and containing SA, AL-1 and OL-1 with different solid contents for 30 min. Then the sample was taken out and dried. The contact angle of #3 white oil on the core surface before and after modification was tested by the pendant drop method using a contact angle measuring instrument (OCA200, Bruker Alicona).
1.4.4. Microscopic morphology characterization of core slice
The core pieces before and after immersion in 1% OL-1 ethanol suspension were dried and sprayed with gold, and then characterized using a scanning electron microscopy (EM-30AX, COEXM).
1.5. Evaluation of the performance of inhibiting oil phase intrusion
1.5.1. Capillary imbibition evaluation
The capillary glass tube was used to simulate the pores and fractures in shale. The tube was immersed in the ethanol suspension with 1% OL-1, 1% SA and 1% AL-1 for 1 h. Then the tube was taken out and dried naturally. The treated capillary tube was then immersed in #3 white oil and stabilized for 2 h. The imbibing height of the oil phase inside the capillary tube was monitored with the liquid level outside the capillary tube as the basis.
1.5.2. Spontaneous imbibition experiment of the rock
The cores were suspended above an electronic balance. 1/2 volume of the core was immersed in the white oil and the white oil suspension containing 1% SA, 1% AL-1 and 1% OL-1, respectively, which were placed in the balance. After the core was immersed, the electronic balance was cleared to zero. When the oil phase intruded into the core, the balance reading decreased. The decreased value is the mass of the oil phase intruding into the core, by which the amount of oil intruding the core was monitored.
1.6. Performance evaluation of oleophobic oil-based drilling fluids system
1.6.1. Preparation of drilling fluids
An OBDF was prepared according to the following formula: White oil + 2% primary emulsion (DR-EM) + 2% secondary emulsion (DR-CO) + 1% organic bentonite + 2.5% filter loss reduction agent (FLRA) + 1% calcium oxide + 20% calcium chloride aqueous solution + barite. The oil-to-water ratio is 90 to 10. The density is 1.95 g/cm3. Different mass fractions of oleophobic agent OL-1 were added to the OBDF and stirred at 11 000 r/min for 20 min to obtain an oleophobic OBDF. The rheological property (65 °C), emulsion breaking voltage, high-temperature and high-pressure filtration loss (120 °C, 3.5 MPa) of the drilling fluids after aging treatment (120 °C, 16 h) were tested according to the national standard [27].
1.6.2. Nano-CT testing
Cores drilled from two adjacent locations of the same outcrop were scanned using a nano-CT instrument (Skyscan 2214, Bruker) to characterize the pore structure of the original cores. The porosity of the cores was also calculated according to the test images [28]. The above cores were then immersed into the OBDF and the oleophobic OBDF containing 1% OL-1, respectively. Then they were taken out after standing in oven at 150 ℃ for 7 d. The OBDF adhering to the surface of the cores was wiped off, and then the cores were scanned again.
1.6.3. Triaxial stress test
The cores were placed in two aging cans. 300 mL of the OBDF and 300 mL of the oleophobic OBDF containing 1% OL-1 were then added into cans, respectively. The cans were sealed and stood at 150 °C for 7 d. After cooling naturally to ambient temperature, the cores were taken out. The OBDF adhering to the surface was wiped off. The compressive strengths of the cores were tested under the confining pressure of 0, 5, and 10 MPa, respectively, using a microcomputer triaxial creep tester [10]. Then according to the Mohr-Coulomb criterion [29], the cohesion C and internal friction angle β of the cores before and after immersion were calculated based on Eq. (3).
2. Results and discussion
2.1. Composition and structure of the oleophobic agent
2.1.1. Component characterization
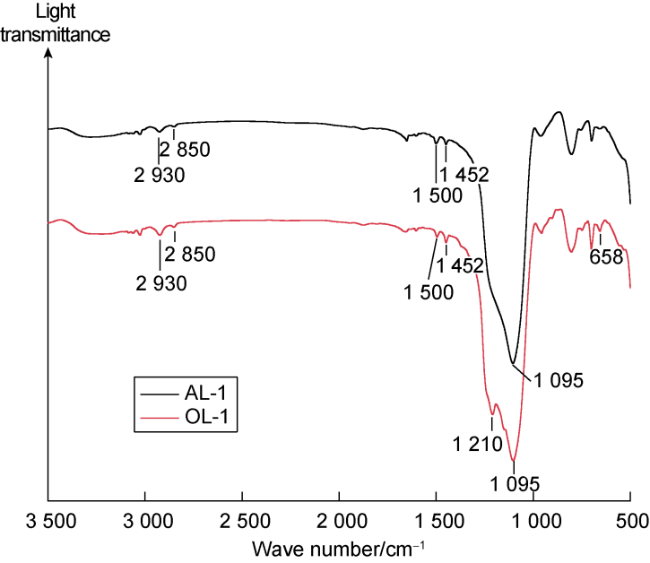
Fig. 1. Infrared spectra of OL-1 and AL-1. |
The thermogravimetric analysis (TGA) was used to characterize AL-1 and OL-1, and the results were shown in Fig. 2 . With temperature increasing from room temperature up to 200 °C, only a small mass loss occurred for AL-1 and OL-1, which was caused by high-temperature desorption of the originally adsorbed water. The masses of both materials were basically constant from 200 °C to 300 °C, reflecting good thermal stability. The mass fractions of AL-1 and OL-1 in the TGA curves were decreased by 27% and 23%, respectively, with the temperature increasing from 300 °C to 500 °C, which was caused by thermal cracking of polystyrene molecular chains. With the further increase of the temperature from 500 °C to 650 °C, the residual mass of AL-1 basically did not change. In contrast, the residual mass fraction of OL-1 decreased from 73% to 63%. Besides, a peak emerged at 530 °C on the differential thermogravimetric curve (DTG) of OL-1, which was originated from the high-temperature desorption of PFT from the surface of OL-1, meanwhile indicating the PFT content in the oleophobic agent was about 10%.
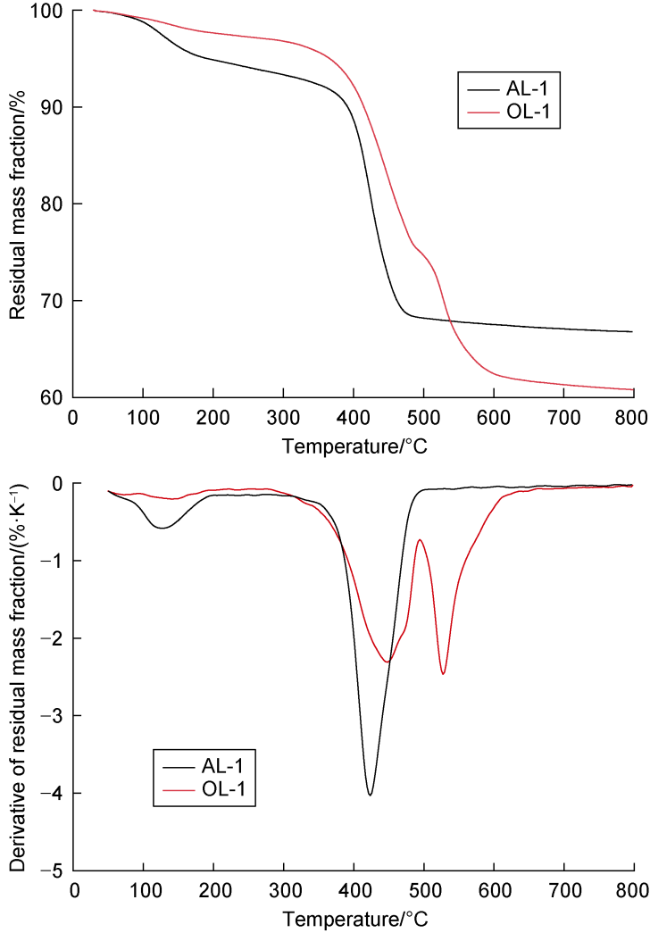
Fig. 2. TGA and DTG curves of AL-1 and OL-1. |
2.1.2. Structural analysis
The microscopic morphology and element composition of AL-1 and OL-1 were characterized by scanning electron microscopy and energy spectroscopy (Fig. 3 ). Both AL-1 and OL-1 were micron-sized ellipsoidal particles with a large number of tightly packed spherical nano-silica on the surface. The analysis shows that the elements in AL-1 include silicon, oxygen, carbon, and a small amount of nitrogen, among which silicon and oxygen were mainly derived from the nano-silica embedded on the surface, carbon was derived from polystyrene, and a small amount of nitrogen may be derived from the initiator azobisisobutyronitrile. In addition to silicon, oxygen and carbon, fluorine was also present in the composition of OL-1, which again proved the successful introduction of PFT.
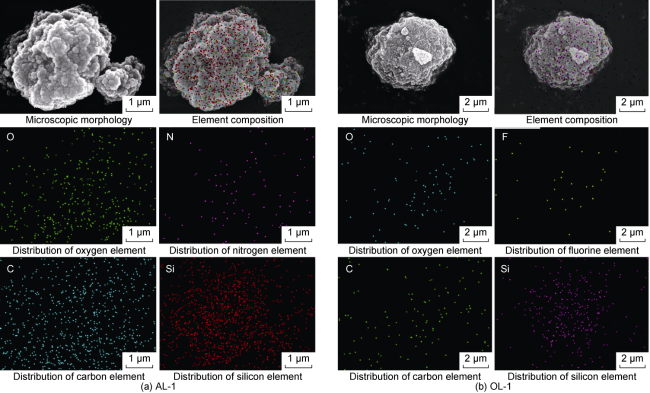
Fig. 3. Scanning electron microscope images and X-ray energy spectrum analysis of AL-1 and OL-1. |
2.2. Modification effect on rock surface
2.2.1. Surface roughness
Surface roughness refers to the unevenness of tiny peaks and valleys on solid surface [30]. When the surface energy of the solid is lower than that of the oil phase, the solid surface shows gas wetting. At this time, increasing the roughness can build more "wave valley" structures on the solid surface. This is beneficial to trap gas in the wave valleys and inhibit liquid phase from penetration, and keeping liquid droplets in the Cassie non-wetting state [19], thus to enhance oleophobic effect [30-31]. Fig. 4 shows the roughness structures built by SA, AL-1, and OL-1 on the surface of single-crystal silicon, observed by an atomic force microscope. As seen from the figure, SA is distributed in a nanoscale on the surface of single-crystal silicon (burr-like in Fig. 4 a), and a small number of SA particles formed large agglomerates. AL-1 and OL-1 particles are microscale, and nano-humps appeared on the surface.

Fig. 4. Atomic force microscope photos of SA, AL-1 and OL-1 distribution on the surface of single-crystal silicon. |
The roughness of SA, AL-1, and OL-1, measured by an atomic force microscope, are 6.08, 8.18, and 18.78 nm, respectively. It is evident that OL-1 and AL-1 both are microscale and can establish nano-scale roughness through the nano-silica adsorbed on their surfaces. When OL-1 and AL-1 are adsorbed on rock surface, micro-nano dual-level roughness structure could be built up, which could improve the rock surface roughness more effectively compared with SA which could only build single-level nano-roughness. In addition, during the preparation of OL-1 using AL-1, PFT can settle and condense on the surface of nano-silica. This increases the size of nanoparticles, and thus more effectively improves the roughness than that of AL-1.
2.2.2. Surface energy
The solid surface energy can reflect the attraction of molecules on the solid surface to adsorbed molecules. The lower the surface energy, the lower the attraction is, and vice versa [10,32]. Under ideal conditions, when solid phase surface energy is lower than oil phase surface energy (20 mN/m), oil phase molecules tend to aggregate when contacting the solid surface. The attraction of solid surface to oil phase molecules is less than the attraction among the oil phase molecules. Macroscopically, oil phase aggregates into balls on solid phase surface, which increases the contact angle [16]. Therefore, reducing the surface energy of solid phase can improve oleophobic effect. The surface energy test results show that the original surface energy of the core is 47.88 mN/m. After adsorbing SA and AL-1, the surface energy decreased to 28.45 mN/m and 35.63 mN/m, respectively, but still higher than that of the oil phase. Based on the Cassie wetting theory, the surface energy of the solid phase is lower than that of the oil phase, which is necessary to achieve oleophobic modification [31]. The surface energy of the rock modified by SA and AL-1 is still higher, so failing to achieve a stable oleophobic state. In contrast, the surface energy of the core modified by OL-1 was significantly decreased to 0.13 mN/m, reaching an ultra-low surface energy state.
2.2.3. Wettability
Contact angle can most visually characterize the surface wettability of the solid phase [33]. Fig. 5 illustrates the contact angles of white oil on the surface of cores before and after modification using 1% SA, 1% AL-1 and 1% OL-1, respectively. The contact angle of white oil on the original core is 16.39°. After adsorbing SA and AL-1, the contact angle did not increase but decreased to 8.52° and 0, respectively. This is because the surface energy of the core treated by SA and AL-1 is still higher than that of oil phase. The surface of the core was oleophilic at that time, but adsorbing SA and AL-1 increased the roughness, and it’s beneficial to enhance the oleophilicity, so the contact angle decreased [34]. After the adsorption of OL-1 on the rock surface, it built micro-nano roughness and significantly reduced the surface energy of the rock, so the contact angle of white oil increased to 143.60°, realizing oleophobic modification. Comparing the modification effects of SA and OL-1 indicates that, on the basis of grafting low surface energy materials, micro-nano roughness is more beneficial to keep liquid phase in Cassie non-wetting state than single-level nano-roughness [33⇓-35], which in turn enhances the oleophobicity of the solid phase surface.
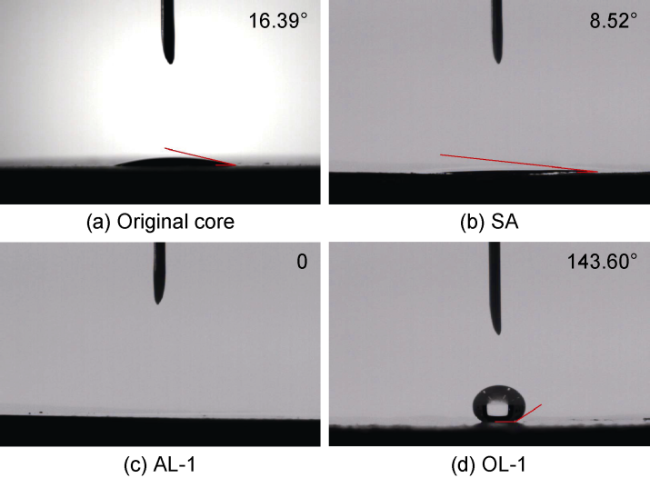
Fig. 5. Contact angles of white oil on the surface of the core before and after modification. |
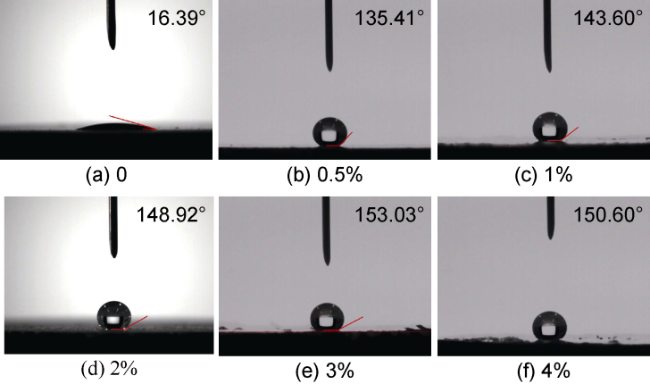
Fig. 6. Contact angles of white oil on the rock surface before and after modification with different mass fractions of OL-1. |
2.2.4. Microscopic morphology of the core slices

Fig. 7. Surface morphology of the shale core before and after OL-1 adsorption. |
2.3. Inhibition of oil phase imbibition
2.3.1. Capillary imbibition
When the capillary tube is inserted into a wetting liquid phase, the attraction of the capillary tube to the liquid phase raises the liquid level in the tube. However, when inserted into a non-wetting phase liquid, the capillary force hinders liquid phase invasion, and the liquid level in the tube is lower than that outside the tube. The above phenomenon is called a capillary effect [36], which is crucial for oil phase imbibing into wellbore [37]. In this study, a capillary tube was modified with SA, AL-1 and OL-1, respectively, and then inserted into #3 white oil, and the imbibition height of oil phase before and after modification was tested. The results show that the original capillary tube is lipophilic before modification, and the oil phase imbibition height is 31 mm when inserted into white oil. After modification by SA and AL-1, respectively, the oil phase imbibition height is 27 mm and 35 mm inside the capillary tube over the outside oil level, indicating that the surface of the capillary tube is still lipophilic after modification. After using OL-1 to modify the capillary tube, the oil-phase imbibition height is 33 mm below the outside liquid level, demonstrating that the capillary tube is oleophobic after OL-1 modification that effectively inhibits oil-phase imbibition. Based on the Young-Laplace equation, the capillary pressure generated by capillary force on the oil phase was calculated before and after modification [38]. The capillary pressure is 273.76 Pa before modification. After SA and AL-1 modification, the capillary pressure became 235.45 Pa and 306.95 Pa, respectively. Whereas, after OL-1 modification, the capillary pressure became −297.71 Pa, which changed from promoting oil phase imbibition to inhibiting oil phase imbibition.
Usually, the smaller the pore size is, the greater the capillary pressure is. When the pore size in shale is as small as 100 nm, the capillary pressure may be more than 1 MPa [37]. With the gradual increase of reservoir protection awareness and the promotion of underbalanced drilling operation [39-40], the positive pressure difference between drilling fluids column pressure and formation pore pressure has been dramatically reduced, making capillary pressure become an essential factor affecting fluid phase imbibition into shale pores. Reversing the direction of capillary pressure is expected to slow down or even block oil phase intrusion into well wall.
2.3.2. Core imbibition
When the shale is immersed in OBDF, the oil phase may imbibe through its pores and fractures into the shale, affecting the mechanical stability of the shale gas well wall [41]. The cores were immersed in white oil and white oil dispersions containing 1% OL-1, 1% AL-1 and 1% SA, respectively. The variation of oil phase imbibition with time was monitored (Fig. 8 ). When the core just contacted the oil phase, the pores and fractures were not invaded by fluids, and the porosity was large. Then fast oil phase invasion occurred due to the strong lipophilicity of the shale and strong capillary action. With the extension of time, as the oil content inside the shale was close to saturation, the oil imbibition became stable. The amount of oil imbibition into the core soaked in #3 white oil reached 0.14 g after 150 min. The amount into the core in white oil dispersions containing SA and AL-1 increased faster within 30 min, then the oil invasion speed decreased significantly after 30 min, and the final amount was 0.10 g and 0.11 g respectively after 150 min. Because of the plugging effects of SA and AL-1 adsorbed on the core surface, the oil imbibition amount decreased compared with that of the untreated core. The oil imbibition amount in white oil dispersion containing OL-1 reached saturation after 20 min, but the mass is only 0.05 g. It decreased by 64.29%, compared with the core immersed in pure white oil, indicating that OL-1 could effectively inhibit oil phase intrusion.
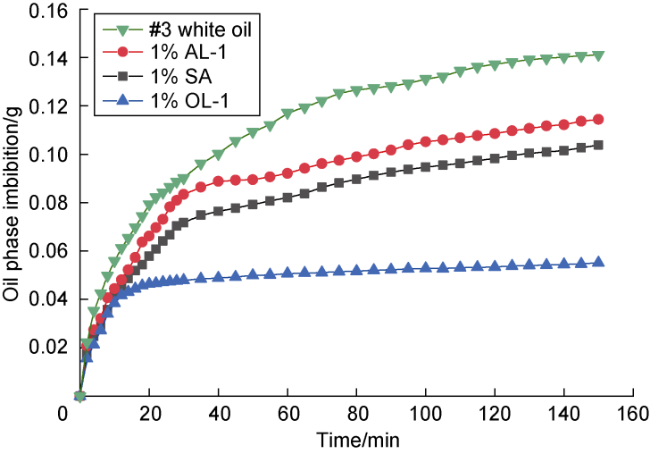
Fig. 8. Oil phase imbibition amount into the core in white oil with different treating agents. |
2.4. Performance of oleophobic oil-based drilling fluids
2.4.1. Evaluation of compatibility
Good compatibility is a prerequisite for applying the oleophobic agent in OBDF [10]. Table 1 lists the rheological properties, emulsion breaking voltage and high-temperature and high-pressure filtration loss (120 °C, 3.5 MPa) of OBDF with different mass fractions of oleophobic agent after aging treatment. The plastic viscosity remains unchanged with the increase of OL-1 mass fraction. From the microscopic point of view, plastic viscosity reflects the internal friction among additive particles, liquidmolecules, and additive particles with liquid molecules in drilling fluids. Since the surface energy of OL-1 is extremely low, its intermolecular force with other components is small, that is to say the intermolecular internal friction is low, so the influence of OL-1 on the plastic viscosity of the system is little. The yield point and gel strength decreases slightly with the increase of OL-1 mass fraction. Solid particles, such as organic bentonite and cuttings in drilling fluids, attract emulsified water droplets to form a frame structure. When added into drilling fluids, OL-1 particles will be involved in constructing the grid structure. But due to the low surface energy of OL-1, the force between OL-1 and different particles is relatively small, resulting in the existence of “weak joints” in the framework, which decreases the framework strength. Therefore, the system strength is reduced. The emulsion breaking voltage maintains at 1300-1400 V, indicating that OL-1 imposes no effect on the emulsion breaking voltage. The high-temperature and high-pressure filtration loss of OBDF first decreases and then increases with the increasing mass fraction of the oleophobic agent. After adding 1.0% OL-1, the high-temperature and high- pressure filtration loss decreases from 2.6 mL to 1.3 mL, with a 50% reduction. The gradual deposition of OL-1 during the mud cake formation could enhance the oleophobicity of the mud cake and generate a capillary resistance in the pores of the mud cake to inhibit the penetration of the oil phase, effectively reducing the filtration loss. However, with a further increase of the mass fraction of oleophobic agent, the high-temperature and high-pressure filtration loss increases significantly. The filtration loss even increases to 3.5 mL when the mass fraction of OL-1 is 3.0%, probably due to the high mass fraction of OL-1 making the mud cake too oleophobic to cause its surface and internal unable to adsorb the oil phase effectively. The failure of adsorbing oil further leads to high oil phase permeability and weak blocking performance of the mud cake, resulting in increasing filtration loss. Therefore, for this system, the mass fraction of the oleophobic agent should be controlled within 2.0% to achieve good compatibility.
Table 1. Effect of oleophobic agent with different mass fractions on the properties of OBDF after aging treatment |
| Mass fraction/% | Plasticity viscosity/ (mPa·s) | Yield point/Pa | Initial gel strength/Pa | Final gel strength/Pa | Emulsion breaking voltage/V | HPHT filtration loss/mL |
|---|---|---|---|---|---|---|
| 0 | 44 | 7 | 4 | 6 | 1380 | 2.6 |
| 0.5 | 44 | 7 | 4 | 5 | 1254 | 1.7 |
| 1.0 | 45 | 6 | 3 | 5 | 1309 | 1.3 |
| 2.0 | 45 | 6 | 3 | 4 | 1354 | 2.4 |
| 3.0 | 46 | 5 | 3 | 4 | 1408 | 3.5 |
2.4.2. Effect of oleophobic system on oil phase intrusion into the core
Add 1% oleophobic agent to the OBDF to prepare the oleophobic OBDF. Then the effects of oleophobic OBDF and conventional OBDF on the pore-fracture structure and mechanical stability of the rocks were further evaluated. The oil phase intrusion could reduce the porosity of the rock. Therefore, the changes in rock porosity before and after soaking in the OBDF could characterize the oil phase intrusion degree. The oil phase intrusion into the pores and fractures of the shale core before and after soaking in non-oleophobic OBDF and oleophobic OBDF were observed by a nano-CT instrument (Fig. 9 ), where the dark part represents the distribution of pores and fractures inside the shale [42]. Fewer pores and fractures were detected and lower porosity was measured after oil phase intrusion. It could be seen from the figure that after the core was soaked in the non-oleophobic OBDF, the oil phase entered the pores and fractures, which were mainly concentrated in the peripheral part of the core. The porosity decreased by 37.4% from 0.99% to 0.62% after soaking in the non-oleophobic OBDF. In contrast, after the core was soaked in the oleophobic OBDF, the pores and fractures distribution identified by scanning did not change apparently. The porosity decreased by only 4.5% from 0.89% to 0.85% after soaking, indicating that the oleophobic OBDF could effectively inhibit oil phase intrusion.

Fig. 9. CT scanned images of the cores before and after soaked in different OBDFs. |
2.4.3. Effect of oleophobic OBDF on core mechanical stability
Rock cohesion reflects the cementation strength of its internal structure and can characterize the mechanical stability of the rock [43]. The cores were placed in the non-oleophobic OBDF and the oleophobic OBDF, respectively. The core cohesion and internal friction angle were calculated according to the triaxial stress test results and Mohr-Coulomb criterion (Table 2 ). The cohesion of the core before soaking is 15.15 MPa. After soaking in the non-oleophobic OBDF, it decreased to 11.30 MPa. While the core cohesion after soaking in the oleophobic OBDF is 14.11 MPa, which increased by 24.9% compared with that soaking in the non-oleophobic system, proving that the oleophobic agent OL-1 could effectively improve the mechanical stability of the rock. The internal friction angle can reflect the friction coefficient when rock slides along the fracturing surface. The larger the internal friction angle, the higher the friction coefficient, and the higher friction resistance during shear sliding [29]. Previous studies pointed out that the lubricating effect of oil phase intruding into rock would reduce the frictional resistance and internal friction angle [7]. However, our test results show that the difference between the internal friction angles after soaking and before soaking is tiny and stable at about 61°, indicating that the effect of oil- phase lubrication on wellbore stability is relatively small.
Table 2. Cohesions and internal friction angles of the cores before and after soaking in different OBDFs |
| Description | Confining pressure/ MPa | Compressive strength/ MPa | Cohesion/ MPa | Internal friction angle/(°) |
|---|---|---|---|---|
| Before soaking | 0 | 112.84 | 15.15 | 60.99 |
| 5 | 191.21 | |||
| 10 | 269.20 | |||
| Soaking in non- oleophobic OBDF | 0 | 85.58 | 11.30 | 61.73 |
| 5 | 175.24 | |||
| 10 | 256.20 | |||
| Soaking in oleophobic OBDF | 0 | 114.36 | 14.11 | 61.57 |
| 5 | 187.42 | |||
| 10 | 265.14 |
3. Conclusions
The oleophobic agent OL-1 prepared by Pickering emulsion polymerization and sol-gel method has a micro-nano structure. OL-1 could build micro-nano double-level roughness after adsorbed on core surface and reduce the rock surface energy to 0.13 mN/m. The contact angle of white oil on the rock surface after modification is as high as 153.03°. The oleophobic agent OL-1 could reverse capillary pressure from 273.76 Pa to −297.71 Pa and the imbibition height of oil phase in the capillary tube from 31 mm to −33 mm, which is lower than the oil phase level outside the capillary tube. Oil imbibition into the core modified by OL-1 is reduced by 64.29%, proving that OL-1 could effectively inhibit oil phase intrusion. The mechanism of the oleophobic agent inhibiting oil phase intrusion and improving wellbore stability is analyzed as follows: (1) Oleophobic modification prevents oil phase from spreading on rock surface and reduces oil phase contact with rock; (2) Oleophobic modification reverses the capillary pressure to inhibit oil phase intrusion; (3) The OL-1 particles absorbed on the rock surface form a film to provide the plugging effect.
The compatibility of the oleophobic agent OL-1 in OBDF is good. After immersed in oleophobic OBDF, due to oil phase invasion, the porosity decreasing amplitude of the core decreased from 37.4% to 4.5% and its cohesion increased by 24.9%, compared with the core immersed in non-oleophobic OBDF. This proves that the oleophobic agent can effectively improve the mechanical strength of the core by inhibiting oil phase invasion. The oleophobic agent is expected to solve the problem of shale gas well wall instability caused by oil phase invasion when using OBDF.
Nomenclature
C—core cohesion, MPa;
β—internal friction angle, (°);
γl—surface free energy of liquid, mN/m;
γl,D—surface dispersion force of liquid, mN/m;
γl,P—surface polarity force of liquid, mN/m;
γs—surface free energy of solid, mN/m;
γs,D—surface dispersion force of solid, mN/m;
γs,P—surface polarity force of solid, mN/m;
θ—contact angle, (°);
σ1—compressive strength, MPa;
σ3—confining strength, MPa.