

Introduction
Since 2009 when the full development of shale gas started in China, the Silurian Longmaxi Formation in southern Sichuan Basin has been considered to have ultra-low porosity (3%-8%) [1], especially for deep shale gas reservoirs which demonstrate the porosity of mainly 4%-6% in the test at normal temperature and normal pressure [2]. As a special unconventional oil and gas reservoir, shale has two distinct types of pores, namely, organic pores and inorganic pores, comprising an extremely complex pore structure. Specifically, the organic pores include macropores, mesopores and micropores, which brings immense difficulties to the accurate measurement of porosity. A lot of scholars have made various researches on shale porosity [3⇓⇓-6], especially on shale porosity measurement methods and mechanisms. Based on the analysis of pore skeleton composition, we built a "rigid-elastic chimera" pore skeleton model with the coexistence of rigid and elastoplastic skeletons. Combined with the stress analysis of pores and skeletons under overpressure, we proposed the pore deformation mechanism of porosity increase caused by overpressure deformation of elastoplastic skeletons, and accordingly established a dynamic deformed porosity measurement method, with an aim to improve the accuracy of shale porosity evaluation.
1. Pore characteristics of shale and establishment of "rigid-elastic chimera" pore skeleton model
1.1. Pore characteristics of shale
The shale reservoir of Longmaxi Formation in southern Sichuan Basin is characterized by various pore types and complex pore structures. Compared with conventional reservoirs, the shale reservoir has the following pore characteristics:
(1) Organic pores and inorganic pores coexist in different types of matrixes. The biggest difference between shale reservoir and conventional reservoir is the involvement of organic matter in composing the rock skeleton, which greatly impacts rock structure and pore structure. Generally, the rock skeleton of conventional reservoir is universally composed of inorganic matters, with the pores dominated by intergranular pores between rock particles and few intragranular pores within rock particles. By contrast, the rock skeleton of shale reservoir has some organic matters (kerogen, bitumen, etc.) in addition to inorganic particles, with a large number of organic pores in the organic matters, resulting in the coexistence of organic pores and inorganic pores in shale reservoir. Six types of pores have been found in the shale reservoirs in the first to fourth submembers of the first member of Silurian Longmaxi Formation (Long 111-4) in southern Sichuan Basin, including organic pores (micropores, mesopores and macropores) (Fig. 1 a, 1b), intergranular pores (Fig. 1 c), intragranular pores (Fig. 1 d), dissolution pores (Fig. 1 d), intercrystalline pores (Fig. 1 e) and microfractures (Fig. 1 d, 1f).
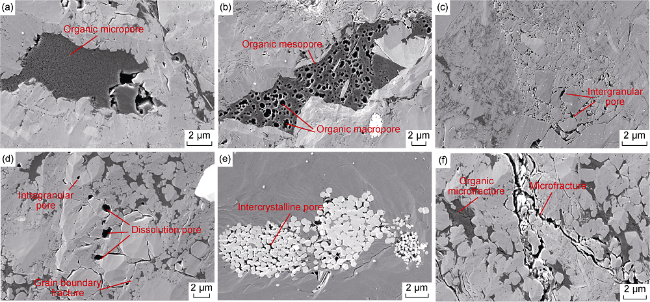
Fig. 1. Pore types in Longmaxi Formation shale reservoirs in southern Sichuan Basin (SEM). (a) Well W202, Long 111, 2570.6 m, organic micropores; (b) Well N203, Long 114, 2564.4 m, organic mesopores and macropores; (c) Well W202, Long 114, 2557.6 m, inorganic intergranular pores; (d) Well W202, Long 111, 2572.9 m, inorganic intragranular pores, dissolution pores and grain boundary fractures; (e) Well W202, Long 113, 2563.7 m, pyrite intercrystalline pores; (f) Well W202, Long 111, 2570.6 m, inorganic microfractures and organic microfractures. |
(2) The pore size varies greatly and shows strong heterogeneity. The pores in shale reservoirs are mainly nano-scale, with a small amount of micron-sized intergranular pores. The pore diameter of shale reservoirs in North America is mainly 8-100 nm, and the pore diameter of marine shales in southern China is 5-200 nm, dominantly about 150 nm [6]. According to the pore classification proposed by the International Union of Pure and Applied Chemistry based on physical adsorption properties and capillary condensation theory, shale pores can be divided into three types by pore size: micropores (diameter smaller than 2 nm), mesopores (diameter of 2- 50 nm), and macropores (diameter greater than 50 nm) [7].
Generally, the pore diameter of shale distributes in a wide range and the mixture of micropores, mesopores and macropores is commonly observed. The experiments on shale samples from southern Sichuan Basin show that micropores account for 12.97%-28.11% of the total pore volume, mesopores for 63.79%-79.39%, and macropores for only 4.44%-13.25% [8].
According to the analysis of focused ion beam scanning electron microscope (FIB-SEM), the pore diameter of shale is variable in southern Sichuan Basin. For example, in the Weiyuan and Changning areas, the equivalent pore diameter (the length of the largest inscribed ellipsoid) of shale is 11.2-5602.7 nm and 11.2-10 695.3 nm, respectively (the largest equivalent pore diameter is found basically in inorganic pores), and it is different between the same type of pores or different types of pores. In the Weiyuan area, the pore diameter is mainly 15-30 nm for organic pores and 25-45 nm for inorganic pores. In the Changning area, the pore diameter is mainly 15-35 nm for organic pores and 25-55 nm for inorganic pores. Although the pore diameters of shale reservoirs in the Weiyuan area and the Changning area vary greatly (Fig. 2 ), the inorganic pore diameter is commonly larger the organic pore diameter.
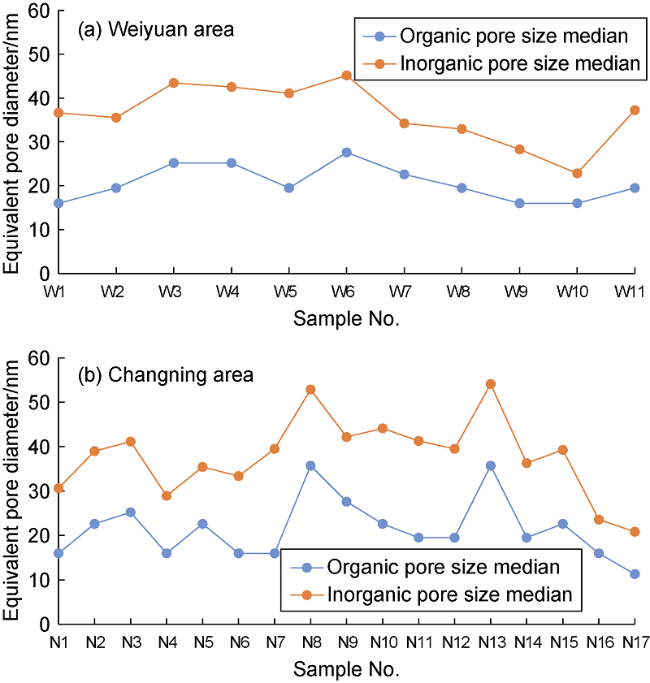
Fig. 2. Distribution of pore diameter in southern Sichuan Basin. |
(3) Fracture development in shale reservoir. The presence of lamellation may induce horizontal fractures in shale, thus improving the abundance of fractures. According to the type of parent material, fractures can be divided into inorganic fractures and organic fractures (Fig. 1 f). According to the genesis, fractures are classified as structural fractures in mineral grains, interlayer sliding fractures, diagenetic contraction fractures, and abnormal pressure fractures controlled by the thermal evolution of organic matter [5]. The fractures can also be divided into macroscopic fractures and microscopic fractures according to their geometric dimensions.
1.2. Establishment of shale "rigid-elastic chimera" pore skeleton model
1.2.1. Concepts of rigid and elastoplastic pore skeletons
The enrichment of organic pores is an important feature of shale gas reservoirs, and organic pores dominate shale reservoirs. There are huge differences between organic pores and inorganic pores, which are not only reflected in the pore size, shape, and connectivity, but also in the properties of rock skeletons that host pores. According to the skeleton properties, shale pore skeletons can be defined as rigid and elastoplastic pore skeletons.
Rigid pore skeleton is mainly composed of inorganic rock minerals (commonly quartz, feldspar, calcite and dolomite) and other rigid materials. It does not deform or just deforms slightly (generally to a negligible extent) under the pore pressure, and the pores in it remain basically unchanged in size. Most inorganic pores in the Longmaxi Formation shale reservoir in southern Sichuan Basin are effectively supported by rigid skeleton (Fig. 1 c-1e).
Elastoplastic pore skeleton is composed of elastoplastic materials such as organic matters (commonly kerogen and bitumen in shale). When the pore pressure changes, the skeleton itself deforms greatly, resulting in changes in the shape and volume of the organic pores in it, which thereby cause changes in the porosity. Organic pores are mainly supported by elastoplastic skeletons (Fig. 1 a, 1b). In addition, some clay minerals in the rock are also elastoplastic. However, due to the high thermal evolution maturity of the Longmaxi Formation shale in southern Sichuan Basin, the clay minerals in the shale are mainly illite with strong rigidity, which has little impact on porosity; thus, it is not described in detail here.
1.2.2. Establishment of shale "rigid-elastic chimera" pore skeleton model
The organic pores and inorganic pores in shale reservoirs are mixed to form a complex shale pore system. Organic pores are dominant in shale gas reservoirs, but the content of organic matter as a skeleton is generally not high (TOC<10% in southern Sichuan Basin), so the organic matter skeleton just takes a small proportion in the total rock skeleton. Generally, organic matters are distributed between rigid rock skeletons in an uneven or sporadic pattern, as if organic matter particles are embedded between inorganic rock skeletons. Therefore, this complex shale pore skeleton combination is named as "rigid-elastic chimera" pore skeleton system. Accordingly, the shale pore structure can be idealized as the "rigid-elastic chimera" pore skeleton model of shale reservoir shown in Fig. 3 .
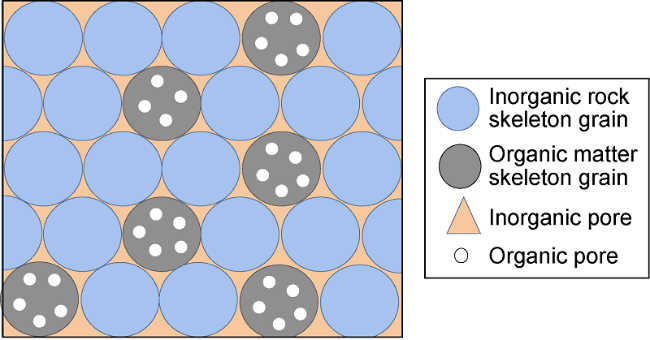
Fig. 3. "Rigid-elastic chimera" pore skeleton model of shale gas reservoir. |
In order to more clearly quantify the relationship between pores and skeletons, a four-component volume model shown in Fig. 4 c is established on the basis of the structure model above and compared with other types of reservoirs (Fig. 4 ).
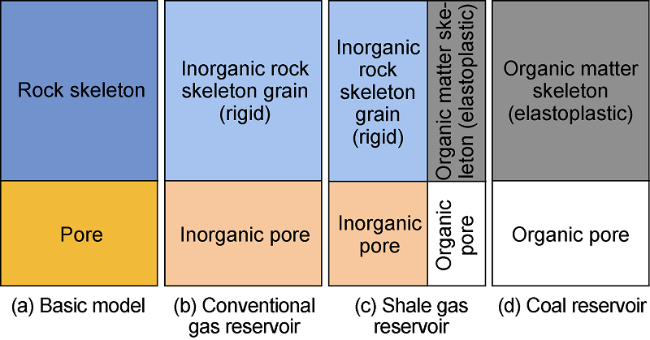
Fig. 4. Volume models of porous media. |
As shown in Fig. 4 c, for shale gas reservoir, the skeleton volume includes inorganic rock skeleton volume and organic matter skeleton volume. The rock volume is the sum of skeleton volume and pore volume, the skeleton volume is the sum of inorganic rock skeleton volume and organic matter skeleton volume, and the pore volume is the sum of inorganic pore volume and organic pore volume, namely:
$V={{V}_{f}}+{{V}_{p}}={{V}_{fr}}+{{V}_{fs}}+{{V}_{pr}}+{{V}_{ps}}$
The rock porosity is the sum of inorganic porosity and organic porosity, namely:
$\phi ={{\phi }_{r}}+{{\phi }_{s}}$
2. Deformation mechanism of "rigid-elastic chimera" pore skeleton in overpressure state
Any object will be deformed after being stressed. The extent of deformation depends on the magnitude of the force and the intensity of the resistance to deformation. Rigidity is the ability of materials to resist deformation under external forces, and the strength of rigidity can be determined by using the "elastic modulus" parameter. The elastic modulus is usually defined as the ratio of stress to strain under uniaxial stress state.
$E=\frac{\sigma }{\varepsilon }$
According to Eq. (3), when the stress is constant, the larger the elastic modulus is, the smaller the strain is, which represents the stronger rigidity of the object; when the stress is not constant, the smaller the elastic modulus is, the greater the strain is, which represents the stronger plasticity of the object.
The elastic modulus can be measured by experiment. Generally, it is easy to obtain the elastic modulus of rigid objects. The elastic modulus of quartz sandstone is 53.1-58.7 GPa [9], the elastic modulus of quartz is 67.0-76.0 GPa [10]. Due to the fact that the elastoplastic skeleton of shale reservoir is mostly kerogen and bitumen, it is difficult to obtain the true elastic modulus. With reference to the experimental results of medium- to high-rank coals, the average elastic modulus of coal is 3.6-5.4 GPa when the confining pressure increases from 1 MPa to 11 MPa [11].
Obviously, the elastic modulus of quartz is approximately 20 times of that of medium- to high-rank coals, that is, under the same stress conditions, the strain of the former is about 20 times that of the latter. Thus, it can be inferred that the compressibility of shale organic pore skeleton is far greater than that of inorganic pore skeleton.
2.1. Stress and strain analysis of shale reservoir
Under formation conditions, Li pointed out that rocks are usually under the joint action of external stress (external pressure and confining pressure) and internal stress (internal pressure and pore pressure), and there is skeleton stress inside the rocks [12]. According to the principle of stress balance, the stress relationship of porous media is:
${{\sigma }_{v}}=\phi p+\left( 1-\phi \right){{\sigma }_{s}}$
Under the action of σv, the rock will deform. Li reported two deformation mechanisms of porous media: (1) overall deformation of the medium caused by deformation of skeleton grains, which is also called primary deformation; and (2) overall deformation of the medium caused by the change in the spatial structure of the medium skeleton grains, or the relative displacement between skeleton grains, which is also called structural deformation; the total deformation of the porous medium is the algebraic sum of the two types of deformation [13]. Hu believed that the total deformation of porous solid can be divided into solid phase gap and material deformation [14]. As the shale in southern Sichuan Basin has reached the late stage of diagenesis, the structural deformation of inorganic matter skeletons has basically disappeared, and only the primary deformation is considered in this study.
Eq. (4) considers the case of a single rigid skeleton. Under overpressure state, the stresses of rigid skeleton and elastoplastic skeleton are different, and the stress distribution is shown in Fig. 5 a.
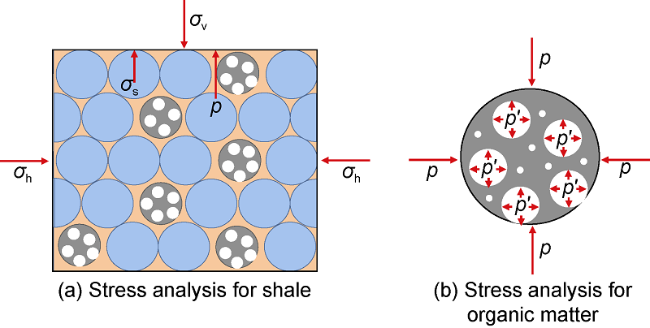
Fig. 5. Relationship between shale stress field and organic pore deformation under formation conditions. |
The stress on the skeleton can be obtained by modifying Eq. (4) to:
${{\sigma }_{s}}=\frac{1}{1-\phi }{{\sigma }_{v}}-\frac{\phi }{1-\phi }p$
According to Eq. (5), when the pore pressure increases, the stress on the rock skeleton decreases. When the pore pressure increases to the same level as the overlying formation pressure, the rock skeleton no longer bears the overlying formation pressure, and the stress on it is purely the pore pressure, that is σs = p, thus reaching a critical state.
Due to the difference in compression resistance between elastoplastic skeleton and rigid skeleton, under the action of pore pressure, the deformation of elastoplastic skeleton is far greater than that of rigid skeleton. As a result, the elastoplastic skeleton is separated from the original rigid and elastoplastic chimeric system in terms of mechanical properties, making it lose the support to the overlying formation pressure. Similar to the above critical state, the stress is purely the pore pressure.
The elastoplastic skeleton stress is separately analyzed (Fig. 5 b). In this case, the stress on the elastoplastic skeleton includes the external pore pressure p of the skeleton and the internal pressure p° of the organic pore. If the organic pore is an effective pore connected with the inorganic pore, then p°=p; at this time, the pore pressure of organic pore becomes an external stress compressing the organic matter skeleton. If the organic pore is an unconnected pore, the internal pressure of organic pore is an internal stress; at this time, such pores are compressed together with the skeleton under the action of external stress p.
2.2. Elastoplastic skeleton compression and pore deformation
2.2.1. Compression mechanism of elastoplastic skeleton
Under stress, the variation of shale volume, pore skeleton and porosity can be characterized by rock compressibility.
The rock compressibility refers to the variation of pore volume per unit volume of rock when the pressure changes by 1 MPa, and its expression is:
$C=\frac{1}{V}\frac{\Delta {{V}_{p}}}{\Delta p}$
The concept of rock compressibility varies from country to country. Eq. (6) was adopted by the former Soviet Union. The United States often defines the rock compressibility as the variation of unit pore volume when the pressure decreases by 1 MPa, namely:
${{C}_{p}}=\frac{1}{{{V}_{p}}}\frac{\Delta {{V}_{p}}}{\Delta p}$
Since ${{V}_{p}}=V\frac{\phi }{100}$, we get $C={{C}_{p}}\frac{\phi }{100}$.
Although rock compressibility is controversial in academic circles, it is still the theoretical basis for organic pore compression. Li believed that when any stress changes, the total rock volume, skeleton volume and pore volume will change, and there are 9 compressibilities for rocks [12]. Usually, the influences of external stress on rock volume and pore pressure on pore volume are most considered. In fact, C in Eq. (6) represents the compressibility of rock volume to external stress σv, and Cp in Eq. (7) represents the compressibility of pore volume to internal stress. However, there are rigid and elastoplastic skeletons in the complex "rigid-elastic chimera" pore structure of shale, and the influence of pore pressure on these skeletons is extremely different. It is necessary to further study the compressibility Cpf of skeleton to pore pressure.
${{C}_{pf}}=\frac{1}{{{V}_{f}}}\frac{\Delta {{V}_{f}}}{\Delta p}$
In the "rigid-elastic chimera" pore skeleton model, Cpf is evidently different between rigid and elastoplastic skeletons. The compressibility is defined as Cpfr and Cpfs for rigid skeleton and elastoplastic skeleton, respectively. If the rigid skeleton is assumed to be incompressible, Cpfr=0; the organic matter skeleton is compressed under the pore pressure p, and the skeleton volume decreases.
If the compression deformation of only elastoplastic skeleton is considered, Eq. (9) can be obtained by modifying Eq. (8):
$\Delta {{V}_{fs}}={{C}_{pfs}}{{V}_{fs}}\Delta p$
According to Eq. (9), when the elastoplastic skeleton volume of shale reservoir and its compressibility are fixed, the volume variation will increase with the increase of pressure.
Since it is difficult to obtain pure organic matter samples containing organic pores, the elastoplastic skeleton compression and pore deformation laws of organic matter can be inferred from the deformation laws of coal samples with the same elastoplastic characteristics. Zhang et al.[15] performed experiments on the deformation of coal samples (Fig. 6 ). They indicated that the shrinkage deformation of coal samples occurs under the action of helium, and the strain curve shows the characteristics of "two stages". The first stage is the pore compaction stage when the pores in coal samples are compressed and closed under the action of gas pressure, suggesting the characteristic of large compression deformation under low pressure. The second stage is the linear elastic deformation stage when the coal particles are partially reworked, and the coal matrix is compressed and deformed under pressure, showing evident linear elastic strain characteristics [15].
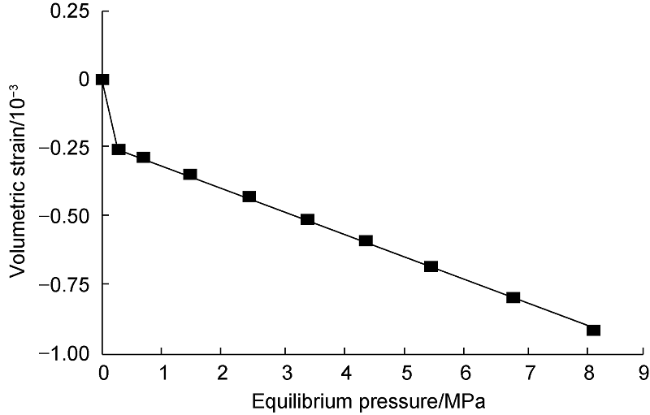
Fig. 6. Experimental results of coal sample deformation under the action of helium (according to Ref. [15]). |
2.2.2. Pore deformation mechanism of shale
There are connected pores (mainly macropores and mesopores) (Fig. 1 b) and also a large number of disconnected pores (mainly micropores) (Fig. 1 a) in organic matters of shale reservoir. When the elastoplastic skeleton is compressed, the skeleton primary deformation will occur, and the structural deformation of a certain skeleton and micropores compressed together will also take place.
According to Fig. 4 and Eq. (1), if the volume reduction caused by elastoplastic skeleton compression is completely converted into the increase of organic pore volume under the assumption that the total rock volume is unchanged, the conversion relationship between skeleton volume and pore volume derived from Eq. (1) is expressed as Eq. (10).
$V={{V}_{fr}}+\left( {{V}_{fs}}-\Delta {{V}_{fs}} \right)\text{+}{{V}_{pr}}+\left( {{V}_{ps}}+\Delta {{V}_{ps}} \right)$
Where, ΔVfs=ΔVps. Similarly, the variation of shale porosity derived from Eq. (2) is expressed as Eq. (11).
$\phi ={{\phi }_{r}}+\left( {{\phi }_{\text{s}}}+\Delta {{\phi }_{\text{s}}} \right)={{\phi }_{r}}+\left( {{\phi }_{\text{s}}}+\frac{100\Delta {{V}_{fs}}}{V} \right)$
The shale pore deformation mechanism can be obtained. Specifically, under the pore pressure, the rigid skeleton and inorganic pore deformations are extremely small and can be ignored. The elastoplastic skeleton and unconnected micropores are deformed greatly. With the increase of pore pressure, the volume decreases; otherwise, the volume of connected organic pores increases, leading to the increase of the pore volume of the whole shale, which will cause the increase of porosity. When the pressure decreases, the skeleton volume expands, the pore volume decreases, and the porosity decreases accordingly.
Under the "rigid-elastic chimera" pore skeleton deformation mechanism, the porosity of overpressure shale shows a completely different change law from that of conventional reservoirs, that is, the porosity under formation conditions is greater than the porosity measured under normal pressure (or low pressure) under surface conditions, which is an "abnormal" phenomenon.
Essentially, the elastoplastic skeleton is strongly compressed under overpressure formation conditions, and its volume shrinks. When the core is taken to the surface and out of the barrel, the pore pressure drops sharply, and the volume of the elastoplastic skeleton, including the volume of disconnected micropores, expands rapidly, resulting in a significant reduction in the volume of connected organic pores. In extreme cases, effective connected pores in underground condition become disconnected and isolated pores on the surface, making the porosity decrease greatly. This phenomenon does not occur in conventional reservoirs. When the cores of conventional reservoirs are taken to the surface, the rock particles are mainly deformed in structure due to the pressure release, and the pore volume increases slightly; the porosity measured on the surface is always greater than the porosity in underground condition.
Of course, the compression deformation of elastoplastic skeleton is affected not only by pressure, but also by formation temperature. The increase/decrease of formation temperature causes the skeleton expansion/contraction. The Longmaxi Formation shale in southern Sichuan Basin exhibits the geothermal gradient of 2.3-2.9 °C/100 m and the formation temperature of 110-150 °C; in deep shale in Luzhou, the pressure coefficient even exceeds 2.0, and the formation pressure is nearly 100 MPa. The pressure has a much greater impact than the temperature. Therefore, this paper mainly focuses on the influence of pressure on formation pores.
3. Difficulties in shale porosity measurement and existing methods
3.1. Difficulties in shale porosity measurement
The complex skeleton composition and complex pore structure render difficulties in accurately measuring the porosity of shale gas reservoir, especially due to the existence of a large number of organic micropores and the deformation of elastoplastic skeletion.
The first difficulty is that the pore size distributes in a wide range, and micropores and some mesopores are difficult to measure. Organic pores are variable in size, with mixed micropores, mesopores and macropores, of which mesopores and micropores are dominant. Generally, the connectivity and permeability of mesopores and micropores are poor. When the conventional method of gas and liquid injection into plunger sample is used to measure the porosity, the gas and liquid cannot be effectively injected into the unconnected mesopores and micropores, making a large number of micropores and some mesopores be ignored in the measurement.
The second difficulty is the porosity change caused by elastoplastic skeleton deformation. As mentioned above, when the formation pressure (pore pressure) increases, the organic matter skeleton is compressed and the porosity increases. When the formation pressure (pore pressure) decreases, the organic matter skeleton expands and the porosity decreases. As a result, the porosity of organic pores is not a constant invariant, but a "dynamic" variable that changes with the pressure. This has a great impact on the porosity measurement of overpressure shale gas reservoirs with high formation pressure. General methods simply cannot accurately measure this part of dynamically changing pore volume.
3.2. Adaptability of existing porosity measurement methods
There are many methods for shale porosity measurement. Fu summarized the methods as gas expansion method, saturated liquid method, nuclear magnetic resonance (NMR) method, gas adsorption method, and mercury intrusion method [16].
3.2.1. Gas expansion method
This type of method adopts double chamber helium measurement based on the Boyle Law. The most representative methods are GRI and GIP.
The GRI method is a helium porosity measurement method for shale fragments proposed by the US Gas Research Institute [1]. It is widely used in shale porosity measurement. During measurement, the shale core is crushed to obtain more unconnected pores, and then the crushed sample is sieved to a certain grain size (generally 830/425 µm or 20/35 mesh). The helium pressure is generally controlled at 0.7-1.4 MPa (100-200 psi). After a certain gas is injected into the reference chamber, the pressure of the sample chamber after equilibrium is measured. According to the changes in the pressure, the volume of gas injected into the sample pores is measured. Finally, the porosity is obtained.
The GIP (gas injection porosimetry) method is modified from the GRI method. As the biggest difference from GRI, the GIP method uses plunger sample. Moreover, a relatively high injection pressure (3.45 MPa or 500 psi) is used to measure the volume of rock skeleton, and the oil and salt washing process of rock sample is added [2].
When the helium porosity measurement method is used for conventional reservoirs, a low injection pressure (0.8 MPa) can make the gas enter the core pores quickly and reach the designed equilibrium state. However, for shale reservoir with extremely low permeability and complex mineral composition, a low injection pressure cannot make the gas completely enter the micropores of shale. In the GRI method, sample crushing reduces the gas injection resistance, increases the contact area between gas and rock pores, and shortens the expansion time required for gas to reach equilibrium; thus, the accuracy for measuring micropores and unconnected pores is improved. It is believed that the GRI method is suitable for low-mature shale reservoirs dominated by nano-scale organic pores, but not for high-mature shale gas reservoirs with fractures and macropores. Although sample crushing allows helium to flow into more nano-scale organic pores, fractures and some macropores may be destroyed in the process, and only micropores and mesopores are left. As a result, the porosity of macropores and fractures is probably ignored in the measurement.
The GIP method uses plunger samples to ensure intact fractures and macropores, and a relatively high injection pressure. Nonetheless, the injection pressure is still low (3.45 MPa). Although more micropores can be measured, the injection pressure is much lower than the true formation pressure. The pore increment caused by skeleton deformation due to overpressure cannot be measured.
3.2.2. Saturated liquid method
This type of method mainly includes water immersion porosimetry (WIP), kerosene immersion porosimetry (KIP) and dual liquid porosimetry (DLP). WIP and KIP are basically identical to conventional porosity measurement methods.
DLP is a method to measure the porosity of core samples by immersion technology, using water and kerosene as saturated liquid and immersion liquid, respectively [4]. It is a combination to WIP and KIP. In the whole process, WIP porosity and KIP porosity are measured simultaneously, and the WIP skeleton volume and the KIP pore volume are used to calculate the porosity of shale gas reservoir.
Since the molecular diameter of water (0.4 nm) and kerosene (33-250 nm) is larger than the molecular diameter of helium (0.26 nm), the saturated liquid method may ignore more micropores than the helium porosity measurement method. Furthermore, shale containing smectite, kaolinite mixed layer and illite/smectite (I/S) mixed layer is water-swelling, resulting in more uncertainties that may affect the accuracy of measurement.
3.2.3. Nuclear magnetic resonance (NMR) method
This type of method observes microscopic pores according to the resonance caused by the interaction between atoms with nuclear magnetism and external magnetic field. The NMR signals are mainly emitted from the hydrogen atoms in the pore space and mainly exist in the water and oil in the pore space. However, the NMR method is insufficient for the "rigid-elastic chimera" pore skeleton model of shale gas reservoir, because it only reflects the porosity under the pressure state during measurement, but cannot accurately represent the porosity under the formation pressure.
3.3. Experimental comparison of existing porosity measurement methods
In order to further understand the adaptability of the porosity measurement methods, experiments were performed to measure the porosities of 16 horizontal and vertical samples taken at 8 depth points in the Ordovician Wufeng Formation and Silurian Longmaxi Formation (mainly Long 111, Long 112, Long 113 and Long 114) of Well L210 in southern Sichuan Basin by the helium method, WIP and KIP. The mineral composition and pore size of samples are shown in Table 1 . The Long 114 and Long 113 samples exhibit high content of clay minerals, low content of quartz and large pore size, while the Long 112 and Long 111 samples show high content of quartz, low content of clay minerals, and small pore size (Table 1 ).
Table 1. Mineral composition and maximum pore diameter of experimental samples from Well L210 in southern Sichuan Basin |
| Sample No. | Horizon | Depth/m | Quartz content/% | Clay mineral content/% | Relative clay mineral content/% | Maximum pore diameter/nm | ||
|---|---|---|---|---|---|---|---|---|
| Chlorite | Illite | I/S | ||||||
| 11 | Long 114 | 4258.17 | 39.25 | 29.33 | 18 | 52 | 30 | 549.6 |
| 12 | 4261.62 | 41.51 | 23.07 | 2 | 54 | 24 | 373.2 | |
| 13 | 4269.10 | 50.36 | 20.24 | 29 | 43 | 28 | 402.2 | |
| 14 | Long 113 | 4274.82 | 46.68 | 26.12 | 15 | 41 | 44 | 590.5 |
| 15 | Long 112 | 4277.36 | 63.68 | 7.49 | 9 | 76 | 15 | 421.0 |
| 16 | 4279.90 | 55.26 | 10.40 | 8 | 57 | 35 | 409.9 | |
| 17 | Long 111 | 4281.21 | 64.81 | 13.07 | 29 | 57 | 14 | 299.9 |
| 18 | Wufeng Formation | 4283.38 | 56.87 | 20.71 | 20 | 55 | 25 | 236.3 |
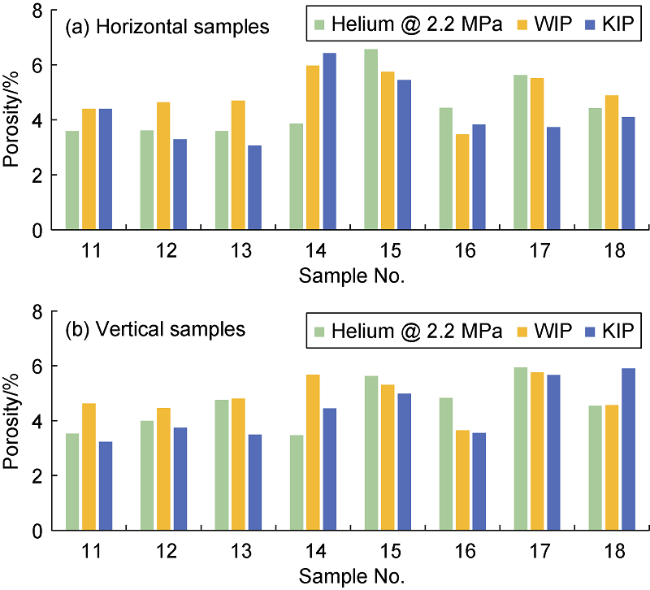
Fig. 7. Porosity measurement results of different methods for samples from Well L210 in southern Sichuan Basin. |
The comparison results show that the measurement accuracy of shale porosity is affected by many factors, including formation factors (clay mineral content) and experimental conditions (molecular diameter of injected gas or liquid). According to the comprehensive evaluation, the helium method is considered the optimal in terms of the degree of micropore injection or the prevention of clay swelling by water.
To sum up, previous studies presented many methods to measure the porosity of shale in view of its unique characteristics, and generally focused more on the first difficulty (a wide range of pore size) as mentioned in Section 3.1. However, the second difficulty (the porosity change caused by elastoplastic skeleton deformation) is believed to be more severe in the porosity measurement of shales, especially the deep overpressure (up to 100 MPa) shale reservoirs in southern Sichuan Basin. This aspect has been rarely studied.
4. Establishment of porosity measurement method for overpressure shale
Currently, shale porosity is mostly measured under normal temperature and low pressure, which can be considered as a unique and constant state, so the measured porosity is called static porosity. The pore deformation mechanism of overpressure shale requires that the porosity of overpressure shale must be measured at a pressure equivalent to the formation pressure to obtain the true formation porosity; otherwise, the measurement may be deviated. For example, for Well W202 in the Weiyuan area, the porosity measured by the helium method is 2.00%-7.96%, with an average of 5.36%, and the porosity calculated from logging data is 5%-15%, with an average of 9.5%. Due to the fact that the porosity of shale under formation conditions is a variable varying with pressure, it may differ greatly even if the formation pressure is different and other conditions are identical. Therefore, the formation pressure must be considered in shale porosity measurement for different blocks, different well areas or even different intervals in the same well. In view of the two difficulties in porosity measurement of overpressure shale, we present a "dynamic" deformation method to measure the porosity of shale under different pressure conditions.
4.1. Measurement basis and principle
4.1.1. Measurement basis
The "dynamic" deformation method is also based on the helium injection method subject to the Measurement of Helium Porosity and Pulse Decay Permeability of Shale (GB/T 34533-2017) [17], and its principle is illustrated in Fig. 8 .
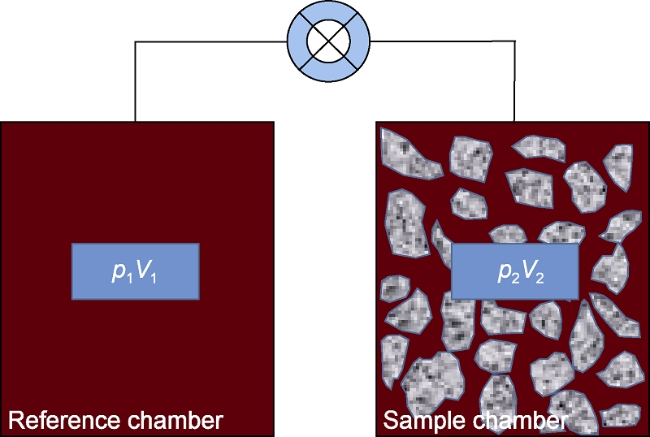
Fig. 8. The porosity and permeability measuring device. |
According to the Boyle's law, given a pressure p1, a certain volume V1 of gas is expanded to the sample chamber under normal pressure. The pressure in the equilibrium state is measured. Then, the sum of the original gas volume V1 and the sample chamber volume, V2, can be obtained. After rock sample is put into the sample chamber, repeat the above process to obtain V2°. The solid volume of rock sample is determined by V2-V2°.
Assuming the solid volume of rock sample is Vg, then:
${{V}_{g}}={{V}_{2}}-{{V}_{2}}^{}$
According to Eq. (12):
${{V}_{2}}^{}={{V}_{2}}-{{V}_{g}}$
Eq. (13) is introduced into the Boyle's law to obtain:
${{p}_{1}}{{V}_{1}}={{p}_{2}}^{}\left( {{V}_{2}}-{{V}_{g}} \right)$
Eq. (14) can be transformed into:
$\frac{{{p}_{1}}}{{{p}_{2}}^{}}\text{=}\frac{{{V}_{2}}}{{{V}_{1}}}-\frac{{{V}_{g}}}{{{V}_{1}}}$
In Eq. (15), since V1 and V2 are constant, p1/p2° has a linear relationship with Vg, that is, the particle volume is only related to the pressure ratio before and after gas expansion. Therefore, as long as the p1/p2° of the sample is measured, the particle volume of the sample can be determined.
4.1.2. Measurement principle
Theoretically, when the helium method is applied, the working pressure is continuously increased to allow the pressure in the sample chamber to infinitely approach the formation pressure; the porosity at the time point with the same pressure as the formation pressure is measured, which is the porosity of share under formation pressure. However, the measuring device in the helium method is usually designed with a low working pressure, and cannot withstand a high pressure of 50-100 MPa. In addition, helium is not a real ideal gas. It can adsorb in organic carbon despite of a very small capacity; the higher the pressure, the higher the helium adsorption[18⇓-20], and the greater the measurement error. Even if the helium adsorption can be corrected, the process should be done on each experimental sample. Therefore, it is extremely difficult to measure shale porosity under formation conditions with an extremely high working pressure.
Considering the causes for the “dynamic” nature of shale porosity and the limitations of experimental conditions, in the measurement of shale dynamic porosity, the initial porosity of connected pores and the compressibility of elastoplastic skeleton under surface conditions can be determined under medium-low pressure conditions, and the actual formation porosity is calculated with the compressibility.
Theoretically, the helium porosity measured at different pressures change in two stages (Fig. 9 a).
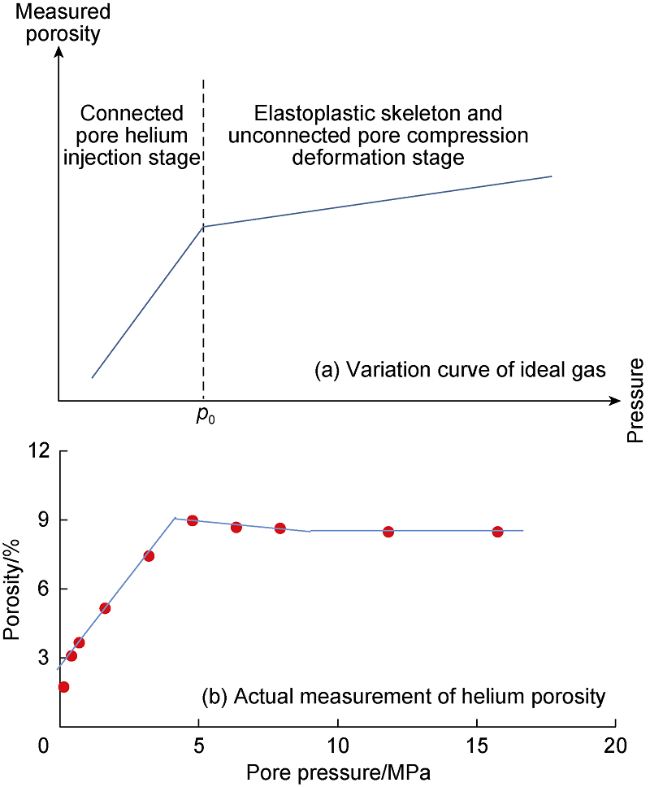
Fig. 9. Variation of shale porosity with pressure. |
(1) Connected pore helium injection stage. In this stage, helium is injected into the pores. With the increasing pressure, helium is injected into the interconnected macropores, mesopores and micropores in turn until all the connected pores at p0 are filled. This stage shows a rapid increase of porosity with the increase of pressure.
(2) Elastoplastic skeleton and unconnected pore compression stage. When the pressure increases to p0, the increase rate of the measured porosity decreases significantly, showing a trend of slow growth. This represents the completion of connected pore filling, the beginning of compression deformation of elastoplastic skeleton and unconnected pores, and the initial increase of organic pore porosity.
The experimental results confirm that helium has a weak adsorption capacity, but the impact of its adsorption at high pressure cannot be ignored. As shown in Fig. 9 b, when the pore pressure exceeds 5 MPa, the measured porosity decreases instead of increase. Therefore, the compressibility of elastoplastic skeleton cannot be determined by the helium method.
Specifically, to measure the "dynamic" deformation porosity, the improved Boyle double chamber helium porosity measurement device is used. By keeping the maximum injection pressure of the device at about 20 MPa and the equilibrium pressure reach 15 MPa or higher, the porosity at different pressures is continuously measured to obtain the porosity vs. pressure curve as shown in Fig. 9 b. The value at the first inflection point of the curve is the initial porosity (which is the maximum porosity at the inflection point). Then, the porosity vs. pressure curve is obtained by porosity measurement with variable pore pressure (kerosene as the injected fluid) to determine the compressibility of elastoplastic skeleton. Finally, the skeleton volume compression is calculated according to the actual formation pressure and the sample TOC, and ultimately the shale porosity under the formation conditions is determined.
4.2. Experimental procedure
The experimental measurement of shale "dynamic" deformation porosity is completed in three steps.
Step 1: Measure the porosity by the helium method at different pressures and the variable pore pressure porosity measurement by ultra-high pressure kerosene method to obtain the initial porosity of connected pores and the compressibility of elastoplastic skeleton.
(1) Measure the initial porosity of connected pores. Fig. 10 shows the results of helium porosity measurement for 9 plunger samples (parallel samples) of Well L210 in southern Sichuan Basin at the injection pressure of 0.2, 0.6, 1.0, 2.0, 4.0, 6.0, 8.0, 10.0, 15.0 and 20.0 MPa, respectively. To obtain the pressures actually loaded on the samples, the abscissa was the pressure at equilibrium, but not the injection pressure.
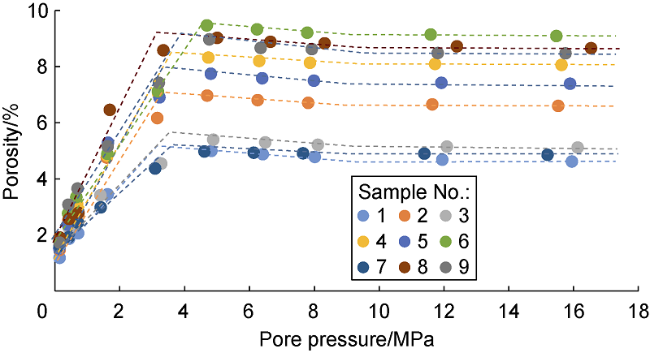
Fig. 10. Helium porosity of samples from Well L210 in southern Sichuan Basin measured at different pressures. |
The trend line for two stages is divided on the porosity vs. pressure curve of any sample, and the intersection of the two lines is the initial porosity of shale.
(2) Calculate the compressibility of elastoplastic skeleton. The rock compressibility is obtained by the variable pore pressure porosity measurement method. Fig. 11 a shows the complete variable pore pressure porosity measurement results. Since the effective confining pressure of the low-pressure stage is too high and the effective confining pressure of the high-pressure stage is too small during the experiment, certain structural deformation can be caused, making the measurement results fail to truly reflect the compression deformation of the elastoplastic skeleton. Therefore, the sample points in the front and back 20 MPa intervals at both ends are discarded. The porosity increment Δϕ in the pressure range Δp is selected in the middle stage with gentle change. The porosity increment at this time Δϕ is completely caused by the compression deformation of elastoplastic skeleton, including disconnected micropores (Δϕ=100ΔVfs/Vfs), so the compressibility of the plastic skeleton can be calculated by transforming Eq. (9) into Eq. (16). Of course, the compressibility can also be obtained by using the linear regression method (Fig. 11 b).
${{C}_{pfs}}=\frac{1}{{{V}_{fs}}}\frac{\Delta {{V}_{fs}}}{\Delta p}=\frac{1}{{{V}_{fs}}}\frac{\Delta \varphi {{V}_{fs}}}{100\Delta p}=\frac{\Delta \phi }{100\Delta p}$
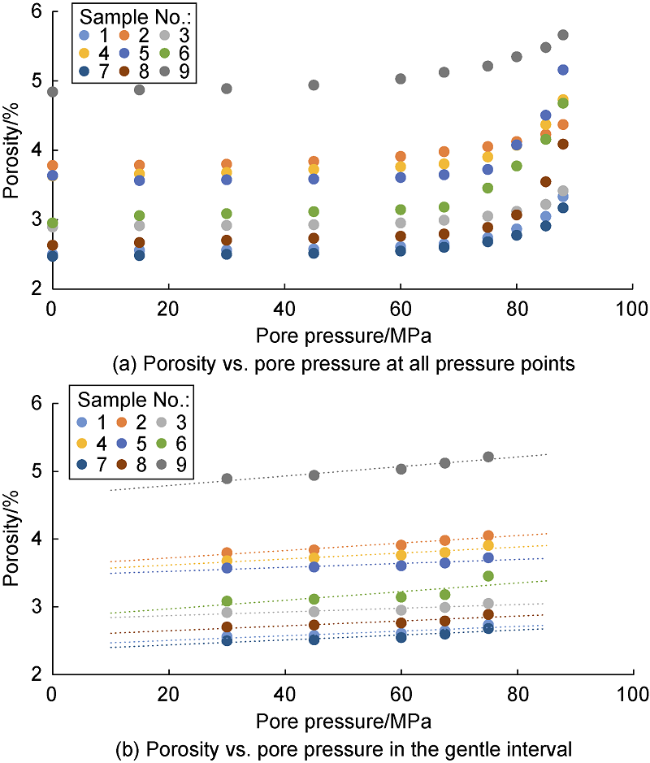
Fig. 11. Porosity measurement results of samples from Well L210 in southern Sichuan Basin by KIP at variable pore pressure. |
Since the samples are different in types of organic matter, their compressibilities are also different. The measured compressibility can be used to reduce error and improve measurement accuracy.
Step 2: Measure the TOC of the samples to obtain the organic matter skeleton volume.
The TOC of the sample can be measured by TOC experiment which derives the mass percentage. The mass percentage must be converted into the volume percentage.
${{V}_{fs}}=\frac{\rho TOC}{{{\rho }_{TOC}}}$
Step 3: Determine the porosity under real formation conditions (the sum of initial porosity and elastoplastic skeleton deformation).
$\phi ={{\phi }_{0}}+100{{C}_{pfs}}\left( p-{{p}_{0}} \right)={{\phi }_{0}}+\frac{\Delta \phi }{\Delta p}\left( p-{{p}_{0}} \right)$
According to Eq. (18), the final formation porosity calculation formula does not contain organic matter volume, but the elastoplastic skeleton compression volume cannot theoretically exceed the organic matter volume. In order to avoid large errors, it is recommended to retain Step 2 as the constraint condition.
Table 2. Practical measurement of formation porosity of Well L210 in southern Sichuan Basin using the "dynamic" deformation method |
| Sample No. | Horizon | Formation pressure/MPa | Initial porosity/% | TOC/% | Compressibility/MPa−1 | Formation porosity/% |
|---|---|---|---|---|---|---|
| 1 | Long 114 | 80.95 | 5.15 | 2.04 | 0.003 9 | 5.40 |
| 2 | 81.03 | 7.20 | 3.38 | 0.005 6 | 7.64 | |
| 3 | 81.08 | 5.60 | 2.50 | 0.003 0 | 5.85 | |
| 4 | 81.15 | 8.50 | 4.15 | 0.005 0 | 8.90 | |
| 5 | Long 113 | 81.24 | 8.03 | 4.19 | 0.003 3 | 8.28 |
| 6 | Long 112 | 81.28 | 9.48 | 4.10 | 0.008 2 | 10.11 |
| 7 | 81.32 | 5.18 | 4.02 | 0.004 0 | 5.50 | |
| 8 | Long 111 | 81.34 | 9.24 | 4.88 | 0.004 2 | 9.50 |
| 9 | Wufeng Formation | 81.57 | 9.02 | 4.44 | 0.007 2 | 9.58 |
5. Verification and application
The "rigid-elastic chimera" model and the "dynamic" deformation porosity measurement method are novel, so they cannot be verified by using the existing experiment methods. However, the logging data are the response values measured under the formation conditions, which maintain most of the original formation in situ; therefore, the "dynamic" deformation porosity experiment results can be mutually verified with the logging interpretation results.
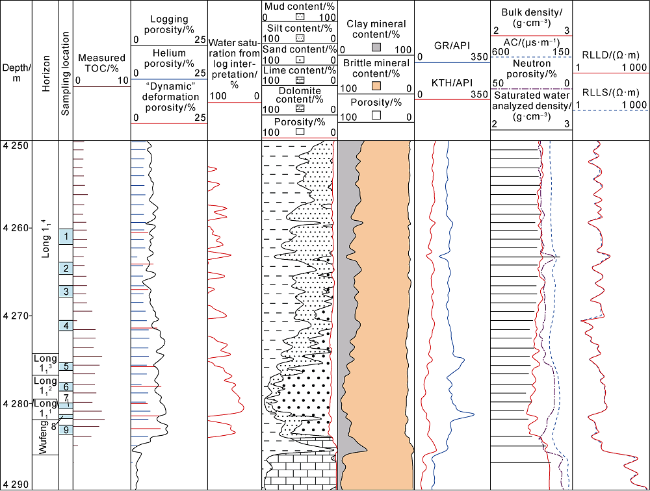
For conventional reservoirs, logging evaluation usually uses core data to calibrate logging data. However, due to the "abnormal" phenomenon that the porosity under formation conditions is greater than that under surface conditions in shale reservoirs, the porosity measured experimentally under surface normal pressure (or low pressure) is generally lower than that obtained from logging data. The blue bar in column 5 in Fig. 12 represents the shale porosity measured by the helium method (at injection pressure of 2 MPa), which ranges in 1.87%- 6.28%, mostly lower than 5%. The result is evidently lower than that calculated by logging data. It is noteworthy that the greater the TOC, the greater the deviation.
Fig. 12. Comparison of porosity measured by the helium method and "dynamic" deformation method and porosity calculated from logging data for Well L210 in southern Sichuan Basin. |
However, the porosity measured by the "dynamic" deformation method is much higher than that measured by the helium method (Fig. 12 ). Especially in Long 111 and Long 112, the difference can be 70% on average. Moreover, the porosity measured by the "dynamic" deformation method coincides well with the logging porosity; the two are highly comparable both in absolute value and change trend and fully conform to the basic principle of the "rigid-elastic chimera" model. As shown in Fig. 12 , in the interval with low content of brittle minerals and low TOC (4250-4272 m), the porosity increment caused by the elastoplastic skeleton deformation under pressure is small due to the original small porosity of the matrix in the reservoir, so the measured porosity is low; in the interval with high content of brittle minerals and high TOC (4272-4284 m), the porosity increment caused by the elastoplastic skeleton deformation under pressure is great due to the large porosity of matrix in the reservoir, so the measured porosity is far greater than that measured by the conventional helium method.
In conclusion, the "dynamic" deformation porosity measurement method derived from the "rigid-elastic chimera" pore model and based on the petrophysical research results can relatively accurately obtain the shale porosity under overpressure formation conditions. This provides a more accurate method for porosity evaluation of shale reservoir, and more accurately reflects the change of shale porosity under formation conditions, contributing a theoretical basis and technical means for accurately determining high-yield shale reservoir. This work breaks the traditional understanding that shale is an ultra-low porosity and ultra-low permeability reservoir, and recognizes that the porosity of the Longmaxi Formation shale in southern Sichuan Basin can reach 10% or even higher under ultra-high pressure formation conditions, which plays a positive role in the correct evaluation of shale porosity and reserves.
6. Conclusions
Unlike conventional reservoirs, the organic-rich shale reservoir is a mixture of inorganic rock particles and organic matters. It includes rigid skeleton, elastoplastic skeleton, inorganic pores and organic pores, forming a special "rigid-elastic chimera" pore structure consisting of rigid skeleton-supported inorganic pores and elastoplastic skeleton-supported organic pores.
Under formation overpressure, inorganic pores change relatively little to an extent that the inorganic porosity is considered unchanged. In contrast, organic pores deform greatly due to skeleton compression, leading to the increase of radius and connectivity of organic pores; as a result, the porosity of shale reservoir increases. The "rigid-elastic chimera" model can well explain the pore deformation mechanism of shale reservoirs.
The "dynamic" deformation porosity measurement method is established by combining the methods for porosity measurement through helium injection at high injection pressure and kerosene saturation at ultra-high pressure and variable pore pressure. This method can solve the problem in porosity measurement caused by the large number of nano-scale organic pores (micropores and mesopores) in shale reservoir and the deformation of elastoplastic skeleton. It can measure the microporosity that is difficult to measure by using the conventional helium method, but also determine the porosity increment caused by the overpressure deformation of elastoplastic skeletion. This method truly realizes the measurement of shale porosity under formation conditions.
The results of the "dynamic" deformation porosity measurement method show that the pore deformation mechanism of shale will produce an "abnormal" phenomenon that the porosity under formation conditions is higher than that under normal pressure. The porosity of overpressure shale reservoir will be seriously underestimated by conventional measurement. Under the real formation conditions, the porosity of the siliceous shale of Long 11 with pores in the overpressure shale gas reservoir of Longmaxi Formation in southern Sichuan Basin can reach 10% or even higher, rather than the real "ultra-low porosity" reservoir.
Nomenclature
C—rock compressibility, MPa−1;
Cp—pore compressibility of rock, or effective compressibility of rock, MPa−1;
Cpf—compressibility of rock skeleton, MPa-1;
Cpfs—compressibility of elastoplastic skeleton, MPa-1;
E—elastic modulus, MPa;
p—true formation pressure, MPa;
p°—pore pressure of organic pore, MPa;
P0—initial deformation pressure of elastoplastic skeleton, MPa;
p1—injection pressure of helium porosity measurement, MPa;
p2°—balance pressure of helium porosity measurement, MPa;
Δp—pressure change, MPa;
TOC—total organic carbon content, %;
V—rock volume, cm3;
V1—reference chamber volume, cm3;
V2—sum of the volumes of reference chamber and sample chamber, cm3;
V2°—sum of the volumes of reference chamber and sample chamber with the sample, cm3;
Vg—solid volume of sample, cm3;
Vf—volume of rock skeleton, cm3;
Vfr—rigid skeleton volume, cm3;
Vfs—elastoplastic skeleton volume, cm3;
Vp—pore volume of rock, cm3;
Vpr—inorganic pore volume, cm3;
Vps—organic pore volume, cm3;
ΔVf—skeleton volume reduction at the time of pressure increase Δp, cm3;
ΔVfs—volume reduction of elastoplastic skeleton at the time of pressure increase Δp, cm3;
ΔVp—pore volume increment of rock at the time of pore pressure increase Δp, cm3;
ΔVps—volume increment of organic pores at the time of pressure increase Δp, cm3;
ϕ—shale porosity, %;
ϕ0—initial porosity, %;
ϕr—porosity of inorganic pores, %;
ϕs—porosity of organic pores, %;
Δϕ—porosity increment, %;
Δϕs—porosity increment of organic pores, %;
σ—stress, MPa;
σh—horizontal stress of stratum, MPa;
σs—stress in skeleton, MPa;
σv—overburden pressure of formation, MPa;
σs—stress of rock skeleton, Mpa;
ε—strain, dimensionless;
ρ—volume density of rock, g/cm3;
ρTOC—actually measured density of organic matter skeleton, g/cm3.