

Introduction
With more extensive and deeper exploration and development of oil and gas reservoirs worldwide, the target has gradually changed from structural oil and gas reservoirs to lithologic oil and gas reservoirs. Reservoir fine characterization has long been one of the core areas of lithologic reservoir research. Many oil and gas reservoirs are generally related to the channels in the Oligocene Huagang Formation in the Xihu sag of the East China Sea Shelf basin. Understanding the distribution of the reservoirs by using seismic sedimentology will be the key re-search objective in future exploration and development of oil and gas.
Thick reservoirs can be interpreted from seismic data easily [1]. In comparison, it is difficult to predict thin reservoirs due to the limited seismic resolution [2]. Seismic sedimentology is widely used for the advantage of relative high horizontal resolution of seismic data (stratal slices) to characterize the thin reservoirs which can’t be identified by vertical resolution [3⇓⇓⇓⇓-8]. In recent years, seismic sedimentology has been increasingly applied in the prediction of clastic and carbonate reservoirs, especially for clastic reservoirs. In addition, seismic sedimentology is more widespread in characterization of channel sand bodies for its typical seismic geomorphologic response. As a result, seismic sedimentology has been successfully applied in the reservoir characterization of fluvial-delta reservoirs [9-10]. Up to now, the available techniques include −90° phase shift [11-12], stratal slicing [13-14] and RGB frequency division fusion [15], etc. Seismic facies interpretation using stratal slices is critical for the successful application of seismic sedimentology [16-17]. However, conventional slice attributes have poor morphology, making it difficult to predict reservoirs in most cases with interpretation ambiguity. Conventional technologies are usually difficult to achieve good results in the following cases: seismic data with poor quality, developed faults; vertical superposition, and fast lateral change of channel sand bodies; study area with larger scope, formation with rapid changing thickness, and rock physical property varied widely in different areas. Based on issues discussed above, this paper optimizes the three traditional technologies by using frequency division interpretation, nonlinear slices, and multi-attribute fusion in the study of fluvial-delta facies reservoirs and analyzes their advantages. Besides, inversion-conventional −90° phase shift joint construction of seismic lithologic bodies was first proposed. Using these methods above, the plane distribution of the fluvial-delta facies reservoirs was finely characterized, and the favorable exploration zones were proposed in the Huagang Formation in the Xihu sag.
1. Geologic setting
Located in the eastern margin of the Chinese mainland, the East China Sea Shelf basin is the largest hydrocarbon-bearing basin in offshore China. The NNE-striking Xihu sag (Fig. 1 a), located in the northeast of the East China Sea Shelf basin, is bounded by the Haijiao Uplift and the Yushan Low Uplift in the west, the Diaoyu Island Uplift in the east, the Fujiang sag in the north, and the Diaobei sag in the south, which is one of the most potential area for oil and gas exploration and development. Since the Cretaceous, the Xihu sag has experienced several regional tectonic movements, which can be divided into the Cretaceous-Eocene rifting period, the Oligocene-Miocene depression period, and the Pliocene-Quaternary subsidence period [18]. The Xihu sag is zoned from west to east and blocked from north to south. Generally, it is divided into five secondary structural units, the west slope zone, western sub-sag zone, central structural inversion zone, eastern sub-sag zone and eastern fault terrace zone (Fig. 1 b). The study area, located in the Huangyan structure in south of the central structural inversion zone, and the south of the west sub-sag (Fig. 1 b) with an area of about 2100 km2 (Fig. 1 c), with developed structural oil and gas reservoirs, and local structural-lithologic reservoirs in favorable zones in the structural wing and near oil source faults [19].
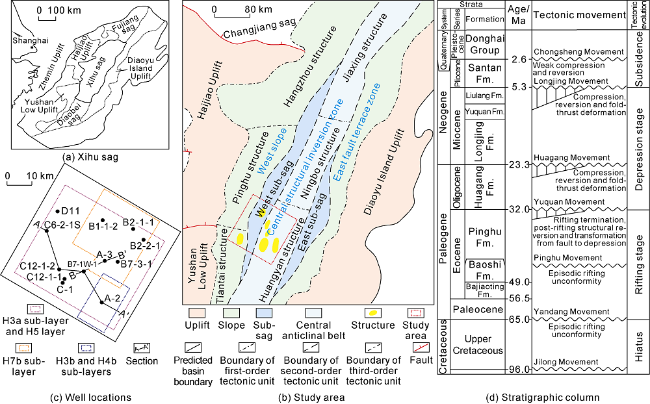
Fig. 1. Location of the study area, well location map and stratigraphic column map. |
From the bottom up, the strata in the study area develop the Paleocene, Bajiaoting Formation of the Lower Eocene, Baoshi Formation of Lower-Middle Eocene, Pinghu Formation of Middle-Upper Eocene, Huagang Formation of Oligocene, Longjing Formation of Miocene, Yuquan Formation, Liulang Formation, Pliocene Santan Formation and Quaternary Donghai Group (Fig. 1 d). The Oligocene Huagang Formation of our interest develops continental fluvial-deltaic deposits [20], which is an important oil-gas-bearing formation. The Huagang Formation can be divided into 12 thin layers, of which H1-H5 belong to the upper member of the Huagang Formation and H6-H12 belong to the lower member of the Huagang Formation. According to the unconformity interface and the corresponding conformity interface, the Huagang Formation can be divided into two long-term cycles from bottom to top (Fig. 2 ). Moreover, it can be further divided into five mid-term cycles (MSC1-MSC5) from top to bottom according to the lithological features [20]. Most wells are located at structural highs, and fewer wells are drilled at structural wings. In order to study the lithologic traps at structural wings, it is urgent to characterize the plane distribution of the reservoirs by using seismic sedimentology.
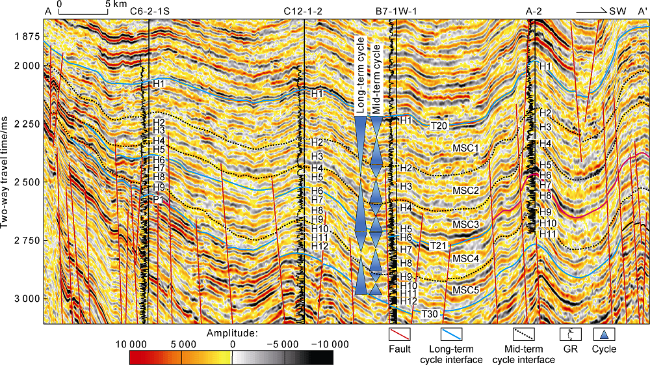
Fig. 2. Geological stratification and seismic sequence characteristics and stratigraphic overview of the study area (see |
2. Optimization of seismic sedimentology
Previous researches have been carried out on frequency division interpretation, nonlinear slices, paleogeomorphology restoration, and multi-attribute fusion. However, the specific advantages of the application of seismic sedimentology technology in river-delta facies are not pointed out. The authors have optimized the relevant technical advantages. They are shown in the following aspects: (1) Frequency division interpretation technology solves the problem of diachronism in fluvial-delta facies deposits with rapid lithologic changes and poor continuity of events. (2) The non-linear slicing technology is used to re-image the channel that is lost due to the change of sedimentation rate with time and location. (3) The multi-attribute fusion technology improves the features of geological attributes, not only the boundaries of sedimentary bodies, but also the sedimentary microfacies interpretation inside the sedimentary bodies. (4) The paleogeomorphology restoration technology is helpful to sedimentary interpretation.
To eliminate the limitation of constructing seismic lithologic bodies by only inversion or −90° phase shift seismic data, it’s proposed to joint inversion with conventional −90° phase shift for constructing seismic lithologic bodies.
2.1. Frequency division interpretation
An isochronous stratigraphic framework is the premise of seismic sedimentology analysis, and high-quality seismic horizon interpretation is the key to establish an isochronous stratigraphic framework. From the perspective of seismic sedimentology, seismic events are not strictly isochronous, and their geological significance is related to frequency. Generally speaking, seismic events with low frequencies reflect lithological information, and seismic events with high frequencies reflect isochronous sedimentary information [21-22]. The events which do not change significantly and maintain stable as the seismic frequency increases, are tend to be more isochronous. Therefore, it is a good way to find isochronous seismic events by analyzing the variation of seismic events with the change of frequency. In practice, we extracted the dip attributes of the original data and the seismic data after frequency division processing, respectively, and calculated the difference of two dip attributes to judge whether the seismic events change with frequency. More specifically, the larger of the dip difference, the more likely the seismic events are isochronous. In addition, appropriate frequency division within the effective frequency range can improve the resolution of seismic data, especially for thin layers. Choosing a suitable frequency division method for a specific geological object is important. In the research of seismic structural interpretation, the configuration of seismic events is the key point. Sedimentary reservoir prediction emphasizes amplitude maintenance, and hydrocarbon prediction focuses on the maintenance of the relative relationship of frequency bands. Generalized spectral decomposition [23-24] is a common post-stack frequency division technique that can improve the accuracy of seismic structural interpretation.
Lithology changes rapidly in the fluvial-deltaic deposits, and the continuity of the seismic events is poor. The dip difference was used to assist seismic horizon interpretation. At the same time, the frequency-division seismic data was referred to determine the interpretation scheme and avoid the diachronism in seismic events. Taking the H6 layer as an example (Fig. 3 a), the resolution of the original seismic data in the study area is low, and the main frequency is 28 Hz (Fig. 3 b). On the basis of accurate well-seismic calibration, the wave peak was traced from Well B7-1W-1 to Well A-3. While wave peak bifurcates up and down in the middle of the seismic profile to the east, it is easy to trace downward on the original seismic profile, which is the H7 layer in Well A-3, resulting in diachronism. By overlaying the conventional seismic profile with the frequency-division dip difference, it can be clearly seen that the dip difference in the middle of the seismic profile is relatively large (Fig. 3 a), indicating that the event is poorly diachronic. Therefore, it is necessary to refer to the frequency-division seismic data to improve the accuracy of seismic interpretation. The seismic resolution is higher on the seismic profile at 35 Hz dominant frequency, and the peak event in the middle of the seismic profile becomes narrower (Fig. 3 c, 3d). Combined with the geological stratification in Well A-3, it is more reasonable to interpret the H6 layer upward from the bifurcation point of the wave peak.
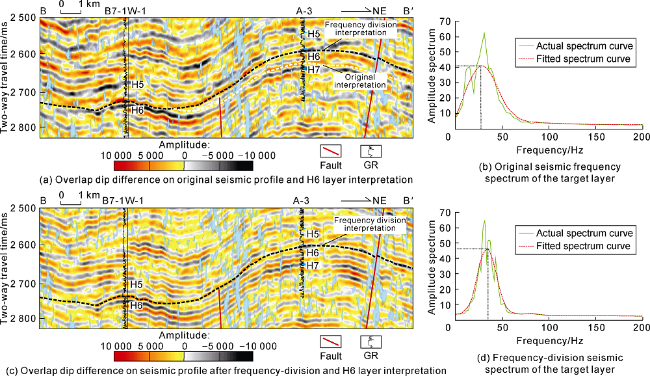
Fig. 3. Seismic profiles interpreted based on frequency-division dip difference (see |
2.2. Pre-stack inversion-conventional −90° phase shift joint construction of seismic lithologic bodies
Rock physical analysis is the premise of seismic lithology prediction. −90° phase shifted seismic data can represent the lithology when the impedance contrast is obvious between sandstone and mudstone, and the reservoir thickness is moderate (less than 1/2 seismic wave-length). Taking low-impedance sandstone, negative polarity and zero-phase seismic data as an example, the top of the thin sandstone is generally calibrated at the maximum of the trough through accurate well-seismic calibration. After −90° phase shifting, the top of the thin sandstone is at zero-phase, and the sandstone is completely corresponding to the seismic trough events. In general, it has been proved to be the most convenient way to characterize thin layers by shifting the seismic phase by −90° [11-12]. However, it is not effective for predicting thick sandstone layers or intervals with small impedance contrast between sandstone and mudstone. A thick sandstone interval has multiple sets of trough reflections on the −90° phase shifted seismic profile when the reservoir interval is thicker than half the wavelength. In addition, when the impedance contrast between sandstone and mudstone is not obvious, conventional seismic data cannot identify sandstone and mudstone. It is necessary to find sensitive parameters through petrophysical analysis, and conduct seismic inversion to represent the lithology. However, inversion also has uncertainties in the prediction of thin layers. Therefore, it is necessary to select appropriate seismic data to establish regional seismic lithologic bodies, especially when the petrophysical characteristics change rapidly in different areas. Multi-attribute splicing is a must to get accurate and reliable seismic facies in large areas. In theory, the splicing boundary of attributes is consistent with the point where the petrophysical characteristics change, but it is difficult to determine the specific point on plane. Buried depth has a great influence on rock physics. With the increase of depth, the lithology would transition from sandstone with low impedance to sandstone and mudstone with overlapped impedance, and finally to sandstone with high impedance. Therefore, the splicing boundaries can be determined by the assistance of structural depth. In practice, splicing attributes can be carried out by referring to the continuity of the geological morphology of plane attributes. Conventional seismic interpretation describes “morphology”, while seismic inversion delineates “lithology”Take H3 layer as an example. The shallow sandstone in the west of the study area (Well D11) is of low impedance (Fig. 4 a) while the relatively deep sandstone in the east (Well B1-1-2) is of overlapped impedance with small difference between sandstone and mudstone (Fig. 4 b). Conventional −90° phase shifted seismic attributes (Fig. 5 a) can better characterize the low-impedance sandstone in the west of the H3 layer, and the geological morphology of the channels is clear. But conventional seismic amplitude slices are not effective for distinguishing the sandstone from the mudstone in the east, and the geological morphology is not typical. Compared with post-stack conventional seismic data, pre-stack gradient seismic data is better for characterizing overlapped impedance sandstone. The eastern meandering rivers are typical in the minimum amplitude slices of gradient seismic data (Fig. 5 b). The corresponding plane attributes with clear channel morphology and high good fitting degree were spliced according to the continuity of the shape of the meandering river channel (Fig 5 c). The spliced seismic attributes of H3a sublayer (H3 is divided into H3a, H3b, and H3c) have the advantages of both conventional seismic slices and gradient slices, laying a solid foundation for regional sedimentary interpretation. In addition, for the formation with special lithology, appropriate inversion attributes should be selected. Taking H7b sublayer (H7 is divided into H7a and H7b) as an example, the reservoir in Well A-3 in the south of the study area has thin coal seams reflected as strong trough amplitude on the seismic profile, and it is difficult to distinguish from sandstone (Fig. 5 d). Pre-stack synchronous inversion (Fig. 5 e) can better characterize the reservoir in the south of H7b sublayer. The whole zone of the H7b attribute can be obtained by splicing the conventional seismic attribute with the sand content from pre-stack synchronous inversion (Fig. 5 f).
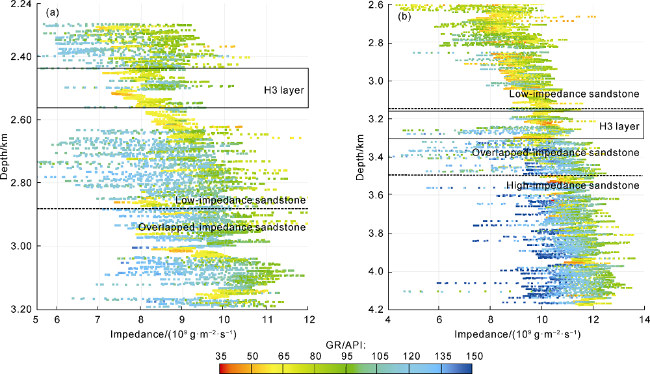
Fig. 4. Impedance changes with depth in Well D11 (a) and Well B1-1-2 (b). |
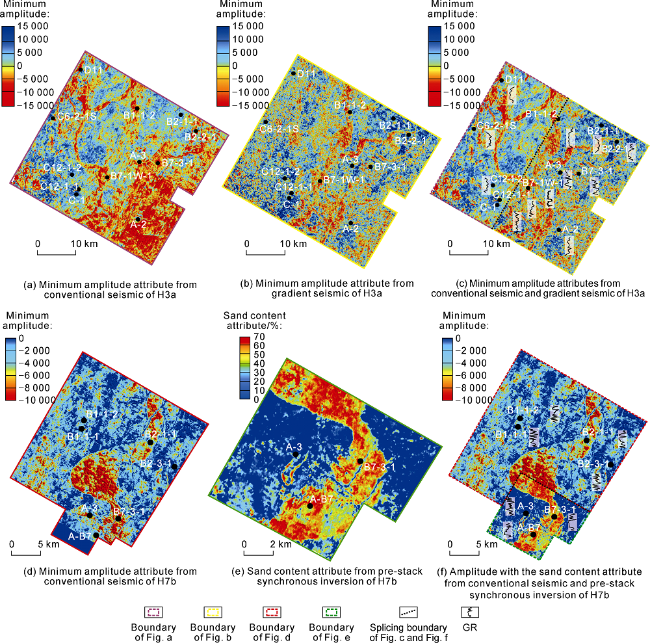
Fig. 5. Splicing plane attributes for H3a and H7b sublayers. |
2.3. Nonlinear slicing
Slicing is the core technology for seismic geomorphology characterization in seismic sedimentology. Compared with the traditional seismic interpretation of sand bodies, slicing has certain advantages. Affected by limited seismic resolution, not all sand bodies can be traced or interpreted. Slicing adopts the interpolation of the top and bottom of the layer, and extracts the attributes within a small time window. Combined with the sand body development in well sites, we can analyze the sedimentary evolution by slicing attributes. Currently, there are three slicing methods: time slicing, horizon slicing and stratal slicing. Stratal slicing is the method most used for the formation that is neither sheetlike nor flat-lying. But stratal slicing doesn't consider the change of depositional rate with time and location [25], because it is linear. So it is unsuitable for characterizing some special sedimentary bodies that the depositional rate varies with time and location. For example, the depositional rate of the main body is higher than the edge of the channel. In addition, it is difficult to get isochronous stratal slices in some situations, such as overlapping and downlap at top and bottom.
Non-linear strata slicing is an extension of conventional stratal slicing, and it can solve the problem of diachronism. Non-linear strata slicing not only consider the change of the depositional rate with the isochronous reference plane, but also consider the impact of the change of the termination point of the isochronous reference plane. At present, there are two types of nonlinear slicing, namely nonlinear chronological stratal slicing based on Wheeler transform [26] and locally optimized nonlinear stratal slicing [25]. The former can form relative geologic chronology intuitively, and without stretching or compressing. It has higher requirements on isochronous seismic unit, and is difficult to implement in cases of complex stratigraphic contact relations and poor data quality. The latter extracts the amplitude of adjacent slices for the delineated area that does not match the depositional model by adopting a bell-shaped function or elliptic function, and form a series of nonlinear stratal slices, which can quickly restore the discontinuous channels and missing fan bodies. The latter method was used in this study. Taking H3b sublayer as a case, the conventional stratal slices showed NS-oriented channel deposits. Due to the incision of the channel and the high depositional rate, the attributes of the conventional stratal slices only represented the mudstone deposits at the top of the channel in some area, which made local channel deposits lost and discontinuous (Fig. 6 a). By using local nonlinear slices, the channels were re-imaged, and continuous NS-oriented distributary channels were obtained (Fig. 6 b).
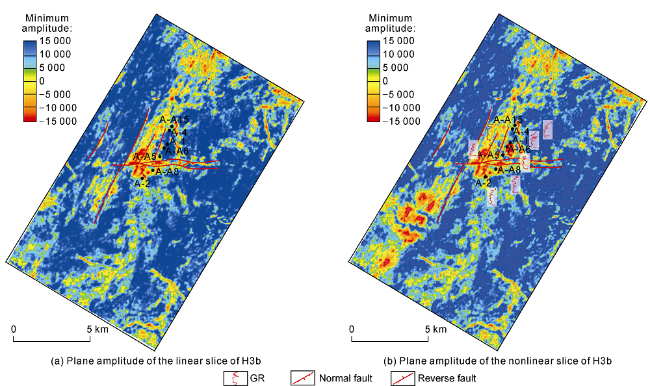
Fig. 6. Original stratal slice and nonlinear slice of H3b sublayer. |
2.4. Multi-attributes fusion
Attribute fusion generally includes RGB frequency-division fusion and neural network attributes fusion [10]. RGB frequency fusion is mostly used to characterize the plane distribution of reservoirs with different thickness, and it can improve the geological morphology of attributes. With the development of machine learning, various neural network algorithms are applied to the optimization of attributes, such as error backpropagation neural network (BP), probabilistic neural network (PNN), convolutional neural network (CNN) and support vector machine (SVM). Neural network attributes fusion has two aspects of contribution: (1) It can greatly improve the geological morphology of the attribute, highlight the boundary, and assist the interpretation of sedimentary microfacies. For example, on the basis of attribute optimization, the unsupervised clustering of BP neural network can be used to quickly and automatically divide sedimentary microfacies, and reduce the uncertainties of single attribute. (2) It can quantitatively predict the plane thickness of sand bodies. For example, convolutional neural network can improve the prediction accuracy of the thickness of the sand body with many faults and a few samples taken from wells. The original attributes input for fusion should well correlate with the thickness of the sand body. Multi-attribute fusion has advantages over single attribute in sedimentary interpretation, but only act as auxiliary tool.
2.5. Paleogeomorphology restoration
As the background for the development of sedimentary strata, paleogeomorphology not only reproduces the original tectonic framework, but also constructs the ancient source system [27]. At present, many scholars adopt the impression method to approximately reflect paleogeomorphology [28]. Paleogeomorphology reconstruction does not simply restore the paleo-thickness of strata, but also consider geological processes, such as the tectonic evolution, missing strata, sediment gravity subsidence, and compaction. The restoration process should include paleo-thickness restoration of sequence strata, missing strata restoration, compaction correction, crust isostatic restoration and fault restoration. This paper takes measures such as compaction correction, denudation recovery and differential subsidence correction to restore the paleogeomorphology of the target layer on the basis of the residual thickness (Fig. 7 ).
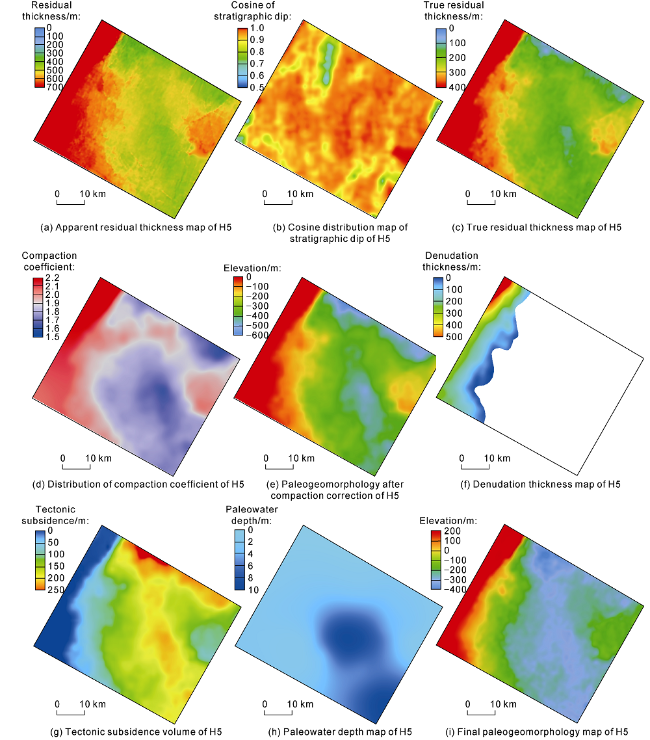
Fig. 7. Paleogeomorphology reconstruction of H5 layer in the study area. |
The procedures of paleogeomorphology restoration are as follows: (1) Subtract the structural depth between the reference planes to obtain the residual thickness of the target layer (Fig. 7 a). (2) Considering the formation dip (Fig. 7 b), calculate the true formation thickness after dip correction (Fig. 7 c). (3) Conduct compaction correction to restore the sedimentary thickness before buried and remove the impact of compaction. By analyzing the relationship between the porosity and the depth of different lithofacies, calculate the compaction coefficient and initial porosity. Analyze the burial history and compaction ratio by using basin simulation software. The planar distribution of compaction coefficient (Fig. 7 d) is obtained by interpolation, which is used for the restoration of paleogeomorphology after compaction correction (Fig. 7 e). (4) There exists local denudation in the west of H5 layer, which should be recovered. The denuded thickness in a single well can be quantitatively restored according to the acoustic transit time of mudstone. According to the structural trend, extrapolate the denudation volume in a single well to the entire H5 layer (Fig. 7 f). (5) Calculate the structural subsidence at initial deposition period (Fig. 7 g) and restore the paleowater depth (Fig. 7 h) through gravity balance and correction. After five steps above, the final paleogeomorphology map is obtained (Fig. 7 i). The final paleogeomorphology (Fig. 7 i) has the same trend as the residual thickness (Fig. 7 c), but there are some local differences in details. The uplifted scope and absolute elevation of the slope are more reasonable.
Paleogeomorphology can assist the sedimentary interpretation based on plane stratal slice attributes. Using multiple methods can enhance the reliability of the results. Taking the paleogeomorphology of the H5 layer (Fig. 7 i) as a case, the west is higher than the east. From west to east, H5 layer can be divided into a denudation zone (pass-by zone), a slope zone and a low-lying zone. The paleogeomorphology well matches the distribution of sand bodies. Sand bodies are enriched in the low-lying zone while less developed in the slope zone with limited accommodation space.
3. Typical seismic facies interpretation
Based on the different sedimentary characteristics of major intervals in the study area, different combination of technologies was used to do lithology identification, sedimentary interpretation and reservoir characterization.
3.1. Shallow water delta of H4b sublayer
H4b (H4 is divided into H4a, H4b, H4c, and H4d) is a thin interbed. Frequency-division seismic data was used for horizon tracking and interpretation to improve the isochronism of the stratigraphic framework. Attribute analysis found the minimum amplitude, average energy and arc length had the highest contribution to BP neural network fusion. The result shows a clear delta shape of H4b attribute (Fig. 8 a). On the plane, it is a narrow belt and potato-like shape developed in a shallow water delta environment. There are NW-SE distributary channels (Fig. 8 b) whose main bodies are located at the west of the study area. The sandstone-to-formation ratio is 38%, and the thickness of single sand body is small as 2.8 m. The logging curves are in the shapes of bell and superimposed boxes. On the whole, the sand body is thicker in the south and thinner in the north. Wells A-A7 and A-A8 were drilled into the main bodies of the channel in H4b sublayer, where the sand bodies are 20 m thick (10 m per sand body). Seismic prograding reflections of delta can be seen along the source direction. The river channel on the delta plain shows continuous trough reflections (Fig. 8 c). The seismic section perpendicular to the delta front channels shows point-like lenticular reflections which are seismic responses of distributary channels (Fig. 8 d).
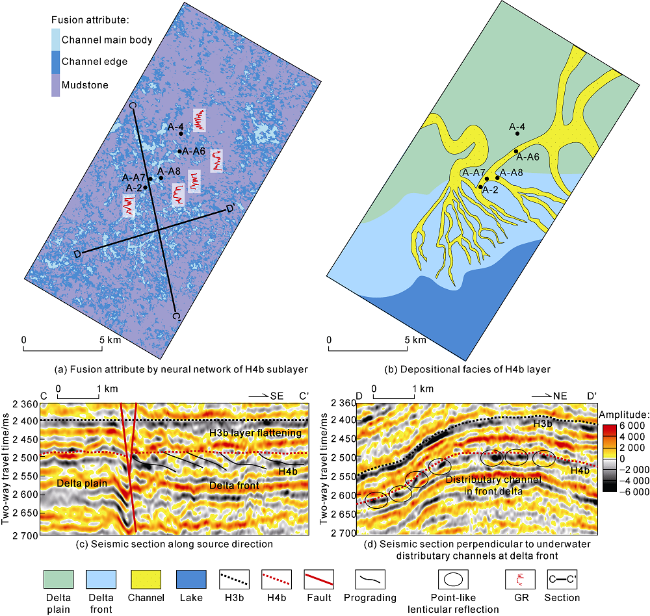
Fig. 8. Plane attributes, depositional facies and typical seismic facies of H4b sublayer. |
3.2. Braided river of H5 layer
For H5 with overlapped impedance of sandstone and mudstone, the minimum amplitude of pre-stack gradient seismic data (Fig. 9 a) is better for lithology characterization while the sedimentary microfacies can be analyzed by clustering attributes (Fig. 9 b). The channels with the clear minimum amplitude of H5 layer are north-south braided rivers (Fig. 9 c), and the sand bodies are distributed in a large scale in the study area. H5 layer was developed in the early-middle stage of the mid-term base-level ascending cycle, with sand bodies superimposed vertically. The sand bodies have been drilled in 30-50 m thick, with high sand-to-formation ratio more than 50%. The braided river deposits are mainly braided channels and channel bars. The logging curve of the braided river channels is box- or bell-shaped, with a sudden change at the bottom, indicating sufficient source supply and strong hydrodynamic energy. The down-cutting effect is obvious, and the composite sand bodies with large scale and good lateral continuity are formed. The width of the braided river is about 2-8 km, showing strong trough reflection axis on the seismic section. Lenticular sand bodies can be seen in the direction of cross-cutting the river channel (Fig. 9 d). The channel bar is the product of vertical accretion of multiple sand bodies. The sand bodies are distributed in a large scale, and the GR curve is box-shaped (Well B1-1-2). The amplitude of the channel bar is stronger than the braided channel. The channel bar can be distinguished by attributes clustering (Fig. 9 b).
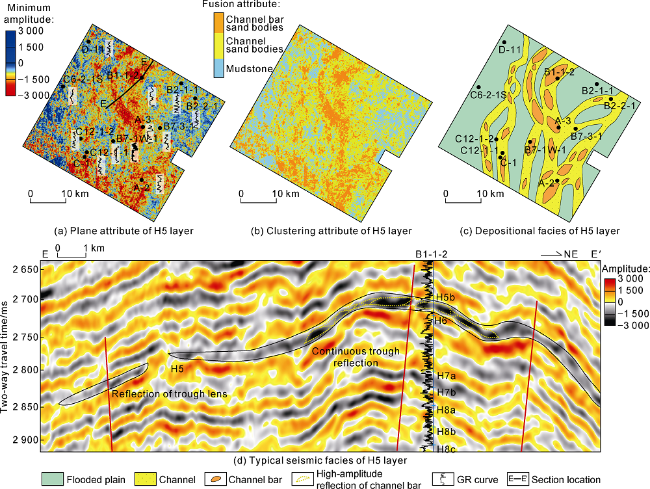
Fig. 9. Plane attribute, depositional facies and typical seismic facies of H5 layer. |
3.3. Meandering river of H7b sublayer
Due to the development of coal seams, the lithology in H7b sublayer (H7 is divided into H7a and H7b) can no longer be effectively distinguished using a single conventional seismic attribute (Fig. 5 d). But pre-stack synchronous inversion can better characterize the distribution of the sand bodies in the coal-bearing background (Fig. 5 e). By splicing the minimum conventional seismic amplitude with the minimum amplitude of the southern pre-stack synchronous inversion, we got the final planar attribute of H7b. The geological morphology of H7b sublayer is clear (Fig. 10 a), and shows a large north-south meandering river (Fig. 10 b). Wells B7-3-1 and B2-1-1 drilled in the point bars where the sandstone is 40 m thick. Well A-B7 drilled in the edge of a point bar. The rest wells drilled in the mudstone in the flooded plain. The point bar complex has a span of about 10 km and shows multiple lenticular troughs on the seismic profile (Fig. 10 c). Referring to the weak amplitude between the point bar complexes and the thickness (20 m) of a single point bar in Well B7-3-1, the point bar complex in the middle can be divided into three stages, spanning about 6 km per stage. In the south (Well A-3), thin coal seams show high frequency and strong trough reflection on the seismic profile (Fig. 10 d).
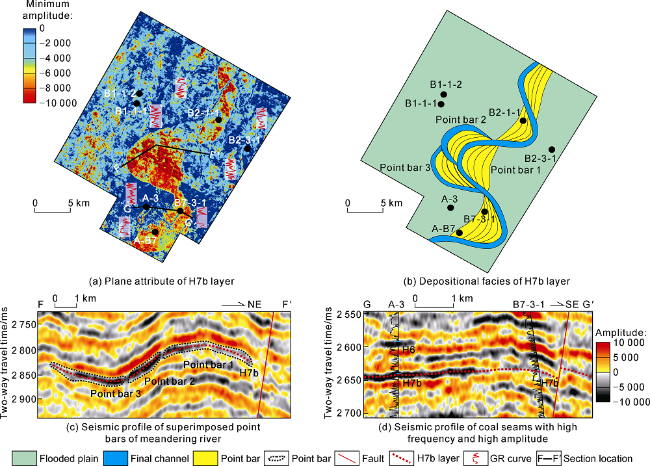
Fig. 10. Plane attribute, depositional facies and typical seismic facies of H7b sublayer. |
4. Sedimentary evolution and exploration significance
4.1. Sand body evolution and controlling factors
The study area is a fluvial-deltaic sedimentary system where the sedimentary evolution of the Huagang Formation (Fig. 11 a) is as follows from the bottom up: H12-H11 are braided rivers, H10-H9 are shallow water deltas, H8 is a braided river, H7 is a meandering river, H6 is a shallow water delta, H5 is a braided river, H4 is a shallow water delta, H3 is a braided river, and H2-H1 are meandering rivers.
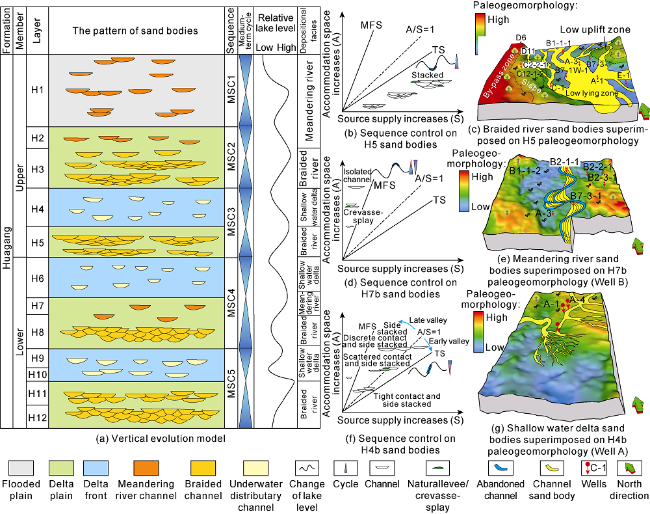
Fig. 11. Controls of sequence and paleogeomorphology on sand bodies. A—accommodation space; S—source supply; A/S—ratio of accommodation space to source supply; MFS—maximum flooding surface; TS—transgressive surface. |
The north-south axial source is dominant in the study area. The development of sand bodies is controlled by the mid-term base-level cycle and paleogeomorphology. With the rise and fall of the lake level, fast lake transgression and regression events occurred many times during the deposition of the Huagang Formation in the study area, resulting in a series of vertically successive fluvial-shallow water delta systems. (1) From the early to middle ascending stages of the mid-term base-level cycle (Fig. 11 b), the lake level was low, the accumulation space was large and source supply was sufficient, and braided channel deposits developed mainly (H5 layer). The channel was straight, the sand bodies were continuous, and superimposed vertically. The fluctuating and steep paleogeomorphology (Fig. 11 c) and restricted valleys imposed control on the distribution of the sand bodies. Most sand bodies are concentrated on the low-lying valleys, but not developed on the slope. (2) From the late ascending stage to the early descending stage of the mid-term base-level cycle (Fig. 11 d), the lake level rose rapidly to a high level, the accommodating space was moderate, and the source supply became less, resulting in meandering rivers (i.e., H7b sublayer). The sand bodies are distributed in narrow strips, and isolated in the vertical direction. The paleogeomorphology (Fig. 11 e) is relatively flat, with unrestricted valleys, and the meandering rivers migrate quickly laterally. (3) From the middle to late descending stages of the mid-term base-level cycle (Fig. 11 f), the lake level fell, entering the lake regression. The accommodating space became smaller, and the source supply was moderate, resulting in shallow water deltas, such as H4b. The sand bodies in the delta plain are distributed in locally narrow, continuous and interwoven strips. Vertically, they are migratory and in medium-large thickness. They are lobe-like underwater distributary channels and mouth bars at the mouth of the delta front. The paleogeomorphology is relatively flat (Fig. 11 g), and the delta front slope is less than 0.1°. The deposit is mainly shallow water delta. In the south of the study area, fore-delta-shallow lacustrine deposits can be observed. The lake shoreline changes frequently.
4.2. Indication significance for oil and gas exploration
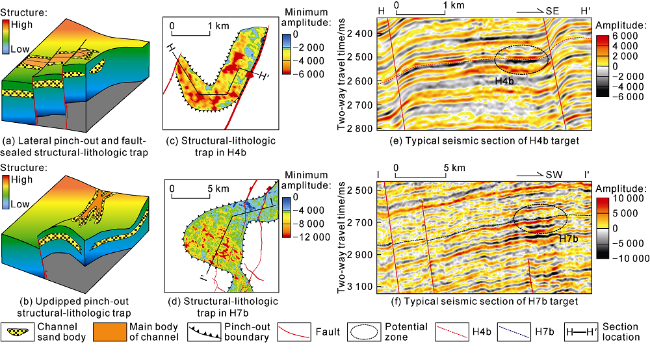
On the basis of reservoir characterization, structural features and fault development, favorable targets were selected in the study area. On a favorable structural background, favorable structural-lithological traps may develop in the case of rational spatial arrangement of trap-forming elements such as sand bodies and faults. Sealing conditions in high parts decide the effectiveness of lithologic traps. Through the analysis of the sealing condition in the study area, there are mainly two types of structural-lithological traps, namely lateral reservoir pinch-out and sealing fault structural-lithological traps (Fig. 12 a) and reservoir updipped pinch-out structural-lithologic traps (Fig. 12 b).
Fig. 12. Favorable structural-lithologic traps and target selection in the study area. |
Under the guidance of the types of trap models, two potential targets were selected. The delta plain channel in H4b sublayer pinches out laterally, and the high part is blocked by faults, forming a good lateral pinch-out and sealing fault structural-lithologic trap (Fig. 12 c). On the typical seismic section across the H4b target layer, the local amplitude is strong (Fig. 12 e) and the structural low of the sand body connects the oil-source fault, demonstrating a high possibility of hydrocarbon accumulation. The meandering river point bar in H7b sublayer pinches out toward the structural high, forming an updipped pinch-out structural-lithologic trap (Fig. 12 d). On the seismic section across the H7b target layer, the phase of the seismic events shifted to the structural high, the pinch-out point is clear (Fig. 12 f). The amplitude of the structural high is stronger than that of the structural low, which may be caused by gas. There are many similar updipped pinch-out structural-lithologic traps in the structural wings of the Xihu sag, which have a broad prospect for hydrocarbon exploration and development in the future.
5. Conclusions
By using techniques including frequency-division interpretation, inversion-conventional −90° phase shift joint construction of seismic lithologic bodies, nonlinear slices, multi-attribute fusion and paleogeomorphology restoration, better geological attributes can be obtained for sedimentary analysis. This provides guidance for the characterization of fluvial-delta reservoirs in other similar areas.
The distribution of sand bodies is controlled by the mid-term base-level cycle and paleogeomorphology in the study area. From the early to middle ascending stages of the mid-term base-level cycle, vertically superimposed sand bodies were developed, which are mainly braided channel deposits. From the late ascending stage to the early descending stage, isolated sand bodies were developed, which are mainly meandering river deposits. From the middle to late descending stages, migratory medium-thick sand bodies were developed, which are mainly shallow-water delta deposits. Restricted paleo-geomorphology controls the distribution of sand bodies, while non-restricted paleo-geomorphology has a little effect on it.