

Introduction
Carbonate gas reservoir is one of the most important types of gas reservoirs, contributing 46% of the recoverable reserves of large gas fields in China and abroad [1⇓-3]. The widespread development of fractures in carbonate gas reservoirs has a far-reaching influence on reservoir development and has been studied for a long time [4⇓-6]. During pressure depletion of gas reservoirs, fractures can significantly exacerbate the stress sensitivity of the reservoir and deteriorate the permeability, which severely affects the efficiency of reservoir development.
To simulate the pressure depletion process, stress sensitivity test on cores is generally carried out by fixed confining pressure and gradually reducing the pore pressure[7-8]. Shao et al. [9] evaluated the stress sensitivity of carbonate reservoirs in terms of the stress sensitivity coefficient. Cheng et al. [10] found that the stress sensitivity of reservoirs was mainly induced at high-pressure stage. Zhao et al. [11] and Yang et al. [12] showed that fractures significantly enhanced the stress sensitivity of cores and substantially reduced the degree of permeability recovery. These research results provide useful guidance for field production, but are limited in three aspects: (1) The stress used in these experiments was significantly lower than underground gas reservoir pressure, so it has not reproduced the actual conditions of the underground gas reservoirs during the experiments; (2) The physical properties of reservoir gas are easily affected by temperature, which has not been adequately considered in the studies to date; and (3) Although the effect of fracture density on stress sensitivity has been investigated, it remains challenging to determine how fracture opening and dip angle affect the reservoir permeability.
Mercury intrusion porosimetry (MIP) is the most reliable method for evaluating pore microstructure, but mercury is highly toxic and can damage samples, making sample reuse difficult. Low-field nuclear magnetic resonance (LF-NMR) technology is fast and accurate, without damaging samples and has been widely used to characterize pore structures. However, the challenge in using LF-NMR lies in accurately extracting a pore diameter from the relaxation time. Gong et al. [13] performed experiments on tight sandstone cores to determine the conversion coefficient between the NMR relaxation time and the pore diameter for tight oil reservoirs. Huang et al.[14] combined low-temperature nitrogen adsorption with NMR to calibrate the conversion coefficients for extracting the pore diameter from the relaxation time of shale reservoirs. However, in all the above studies, the conversion coefficient was considered to be constant, which is not suitable for fractured carbonate reservoirs with multi-scale properties. In addition, to investigate microscopic changes in pore space under different stress conditions, NMR test should be performed under pressure.
In this study, we selected core samples from the Amu Darya gas field in Turkmenistan, conducted stress sensitivity tests by simulating the in-situ temperature and stress, and evaluated the degree of stress sensitivity of the reservoir. We used high-pressure MIP and NMR to determine the parameters of the microscopic pore structure of the cores, and introduced a variable fractal dimension to develop a conversion between T2 spectrum and pore size, determining the volume change of pores and fractures at different scales. We explored the microscopic mechanism of stress sensitivity, and analyzed the influence of microscopic parameters on the permeability loss of the gas reservoir.
1. Experimental design
1.1. Core samples
Experimental cores were taken from the Callovian- Oxfordian Stage of the Middle and Upper Jurassic marine carbonate gas field on the right bank of Amu Darya, Turkmenistan at a burial depth of 3150-3620 m. The original formation pressure is 56.7-63.5 MPa, and the temperature is 105-120 °C in the middle of the reservoir. The reservoir space is mainly composed of secondary pores and fractures which are extensively developed at fracture density of 0.9-15.4 m−1. Twenty-five core samples were collected with porosity ranging from 2.01% to 11.27% (averaging 4.33%) and permeability of (0.000 3-18.921 5)× 10−3 μm2 (averaging 2.254 8×10⁻³ μm2). Ten samples have natural fractures which are mainly high-angle and inclined ones with fracture opening of 0.01-0.08 mm. The effective fractures are mostly unfilled and partially filled (Table 1 ).
Table 1. Basic physical characteristics of core samples |
| Sample No. | Porosity/ % | Permeability/ 10−3 μm2 | Fracture description |
|---|---|---|---|
| 1-1 | 2.56 | 0.001 6 | No fracture observed |
| 1-2 | 3.84 | 0.009 4 | Horizontal fractures |
| 1-3 | 2.66 | 3.904 4 | Multiple high-angle and inclined fractures |
| 1-4 | 8.53 | 0.031 8 | No fracture observed |
| 1-5 | 4.73 | 15.130 8 | 2 visible vertical fractures |
| 1-6 | 11.27 | 0.793 8 | No fracture observed |
| 1-7 | 4.74 | 0.028 3 | Reticular fractures |
| 1-8 | 3.18 | 0.000 3 | No fracture observed |
| 1-9 | 4.52 | 5.306 0 | High-angle fractures |
| 1-10 | 3.75 | 0.983 9 | No fracture observed |
| 2-1 | 2.01 | 18.921 5 | Multiple groups of reticular fractures |
| 2-2 | 2.98 | 0.001 2 | No fracture observed |
| 2-3 | 3.82 | 0.412 1 | No fracture observed |
| 2-4 | 2.40 | 5.697 6 | Multiple groups of inclined fractures |
| 2-5 | 2.24 | 0.000 4 | No fracture observed |
| 2-6 | 2.56 | 0.085 4 | No fracture observed |
| 2-7 | 4.25 | 0.541 3 | 1 high-angle fracture |
| 2-8 | 4.74 | 0.895 6 | No fracture observed |
| 2-9 | 3.35 | 0.027 9 | No fracture observed |
| 3-1 | 2.81 | 0.099 3 | Multiple inclined fractures |
| 3-2 | 4.88 | 0.048 3 | No fracture observed |
| 3-3 | 5.43 | 2.980 2 | No fracture observed |
| 3-4 | 7.22 | 0.263 4 | 1 horizontal fracture |
| 3-5 | 3.31 | 0.007 9 | No fracture observed |
| 3-6 | 6.55 | 0.196 8 | No fracture observed |
1.2. Equipment
The stress sensitivity of the cores was tested using an STL-II permeability meter. Considering that the gas properties are considerably affected by temperature, the core holder was placed in a thermostat to simulate the original formation temperature and stress conditions (Fig. 1 ). The Carr-Purcell-Meiboom-Gill (CPMG) pulse echo signal of the core was acquired by a Mini MR with an echo interval of 0.1 ms. The capillary pressure curve of the core was measured using a Pore Master GT automatic mercury porosimeter.
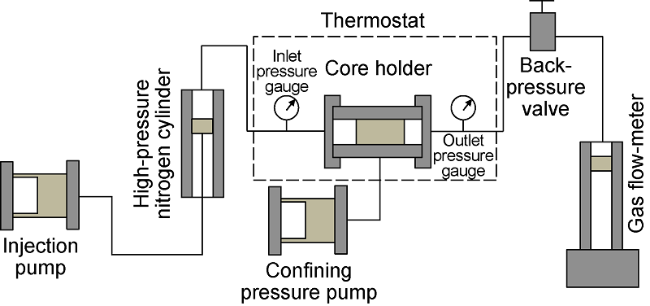
Fig. 1. Device for measuring the stress sensitivity of a core. |
1.3. Procedures
Stress-sensitivity experiments: (1) A sample was placed in a core holder after oil-washed and dried, and then the holder was pressurized to 30 MPa for 3 h for aging. (2) The confining pressure of the sample was set to 105 MPa, the thermostat temperature was set to 110 °C, and the core was saturated with nitrogen until the inlet pressure reached 60 MPa. (3) The inlet and outlet pressures were reduced simultaneously while maintaining the pressure difference at 3.5 MPa, and the permeability of the core was measured at inlet pressure of 60, 55, 40, 30, 20, 10, and 5 MPa, respectively. (4) The inlet pressure was increased by following the reverse order in Step 3 until the inlet pressure returned to 60 MPa, and the permeability of the core was measured at each pressure point.
LF-NMR T2 spectrum measurement: (1) A dry rock sample was vacuumed, and then placed in a pressurizing device, and saturated with simulated formation water for 48 h. (2) Confining pressure (60 MPa) was applied to the core at a constant temperature of 35 °C, and the inlet and outlet ends were connected to apply static pore pressure to the sample. The T2 spectrum of the saturated sample was collected using the NMR analyzer. (3) The rock sample was dehydrated using a high-speed centrifuge and dried in a constant-temperature chamber. Confining pressure (60 MPa) was applied to the dry sample, and the T2 spectrum reflecting the influence of rock skeleton and the errors of instrument was collected.
High-pressure MIP experiment: The pretreated rock sample was dried, and the relationship between the mercury saturation and mercury injection and withdrawal pressures was determined using an automatic mercury porosimeter. The maximum mercury injection pressure used in the experiment was 185 MPa. The capillary pressure curve and pore-throat distribution frequency graph of the sample were plotted.
2. Evaluation of the stress sensitivity of gas reservoir
2.1. Gas reservoir stress sensitivity
The results of the stress sensitivity experiments show that the permeability decreased with decreasing formation pressure (the pore pressure of the core), but the trends in the permeability loss and recovery degree with the formation pressure varied considerably in different cores (Fig. 2 ). The stress sensitivity was evaluated based on the stress sensitivity coefficient and permeability recovery rate [10], where the former reflects the level of the stress sensitivity and the latter mainly reflects the irreversible damage to the permeability after stress reduction and recovery.
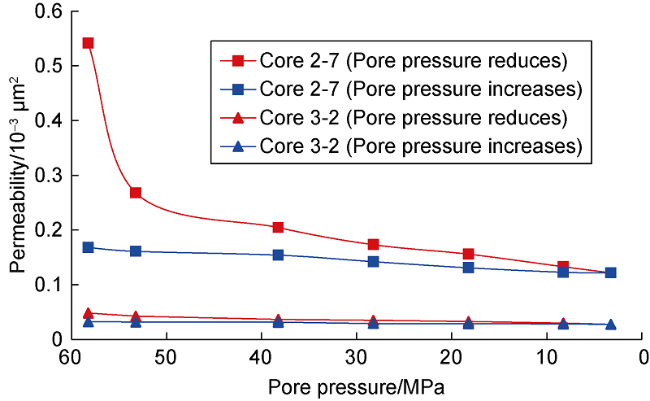
Fig. 2. Core permeability changes with the pore pressure. |
The analysis of the evaluation results shows that the larger the stress sensitivity coefficient is, the faster the permeability recovery rate decreases, and strong stress sensitivity would intensify the irreversible loss of permeability (Fig. 3 ). Based on the evaluation criteria for stress sensitivity [9], two samples didn’t exhibit stress sensitivity characteristics, four samples exhibited weak sensitivity, one sample exhibited strong sensitivity, and 18 samples which are dominant in the results exhibited moderately weak or strong sensitivity (Fig. 4 ).
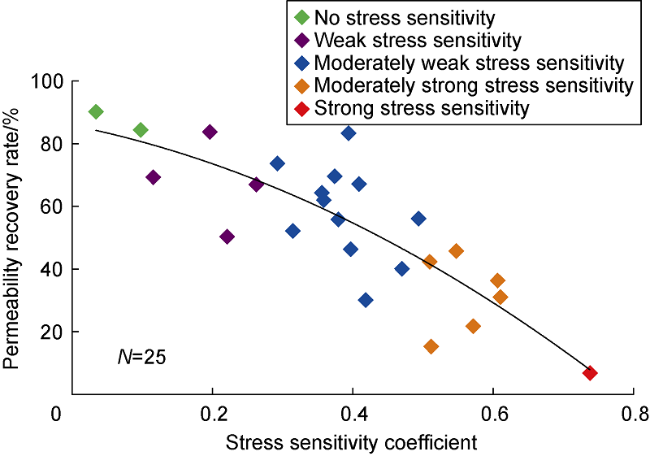
Fig. 3. Relationship of permeability recovery rate and stress sensitivity coefficient. |
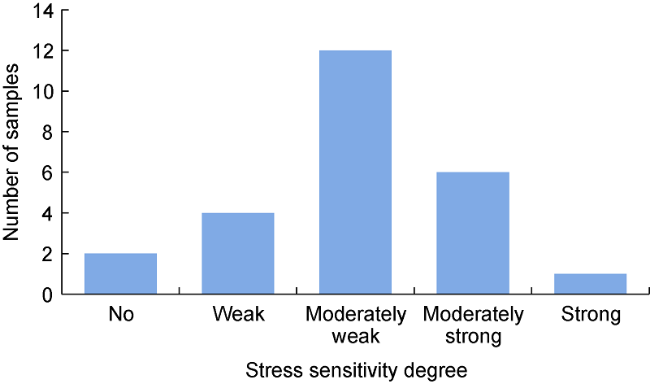
Fig. 4. Number of samples with different stress sensitivity levels. |
2.2. Effect of reservoir physical properties on stress sensitivity
In general, reservoir stress sensitivity is distinctly influenced by reservoir permeability. The stress sensitivity of fractured reservoirs is stronger than that of reservoirs without fractures at the same permeability. As the initial permeability of porous reservoirs (without fractures) increases, the stress sensitivity coefficient decreases and then increases, but the permeability recovery rate increases and then decreases. However, as the initial permeability of fractured-porous reservoirs increases, the stress sensitivity coefficient increases and the permeability recovery rate decreases (Figs. 5 and 6 ).
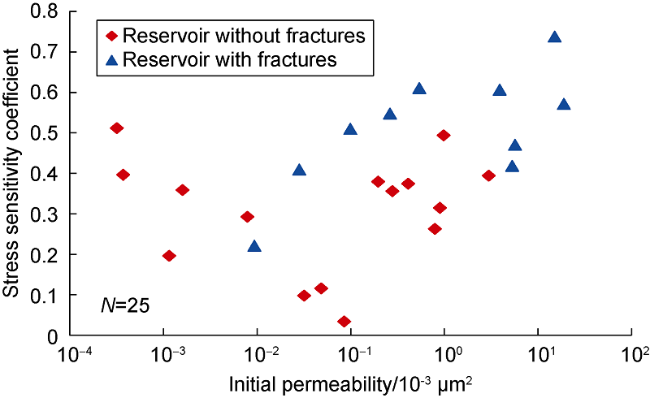
Fig. 5. Relationship of stress sensitivity coefficient and initial permeability. |
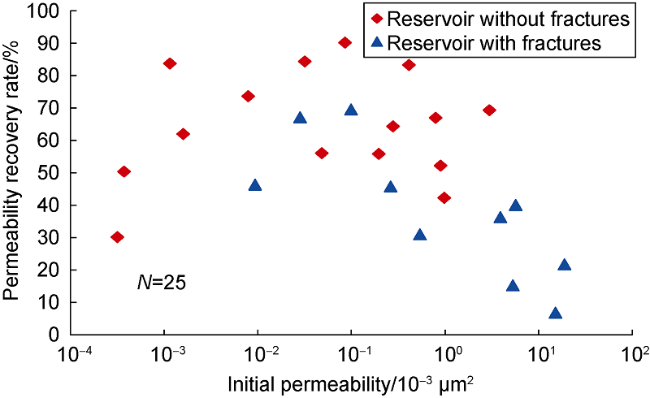
Fig. 6. Relationship of permeability recovery rate and initial permeability. |
2.3. Effect of fracture characteristics on stress sensitivity
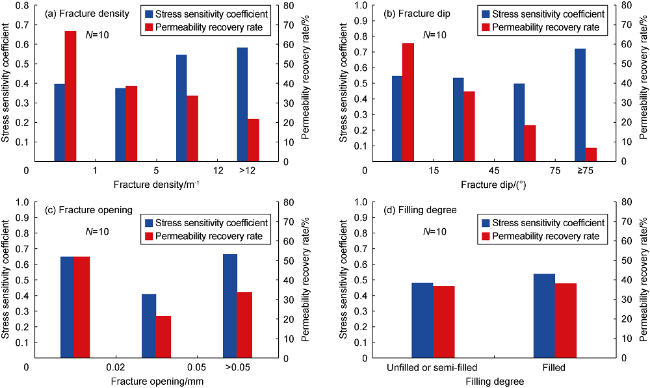
Fig. 7. Statistics of the relationships between fracture characteristic parameters and stress sensitivity. |
3. Microscopic characteristics of reservoir stress sensitivity
3.1. Reservoir microstructure description method
The multi-scale reservoir space can be described using fractal theory with both planar and spatial fractal dimensions. The planar fractal dimension Ds is determined by box-counting method on pore microstructure images processed by binarization [15]. An analysis of the SEM images of the samples from the right bank of Amu Darya using ImageJ software yielded Ds values ranging from 1.22 to 1.74 with an average value of 1.42. The spatial fractal dimension Dv determined from capillary pressure curve [2] is given below.
$\lg \left( 1-{{S}_{\text{Hg}}} \right)=\left( {{D}_{\text{v}}}-3 \right)\lg {{p}_{\text{c}}}-\left( {{D}_{\text{v}}}-3 \right)\lg {{p}_{\text{c min}}}$
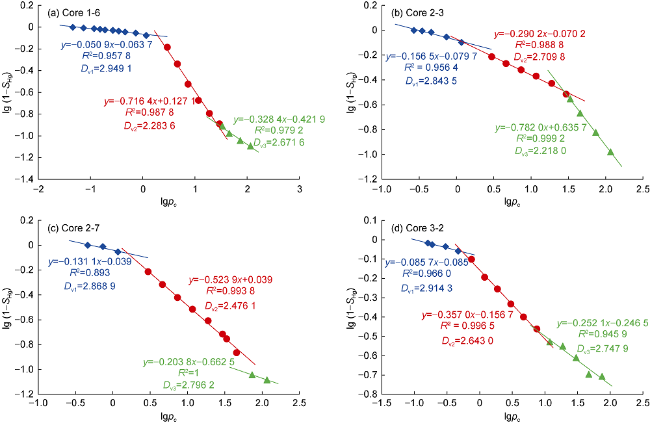
Fig. 8. Fractal dimension analysis of the pore structure based on the capillary pressure curve. |
To evaluate the pore structure using NMR data, the distribution of pore sizes must be extracted from the NMR T2 spectra. The relationship between the transverse relaxation time T2 and pore size r in a porous medium is given below [13]:
$\frac{1}{{{T}_{2}}}=\rho \frac{S}{V}=\rho \frac{{{F}_{\text{s}}}}{r}$
The ratio of pore internal surface area to pore volume can be expressed in terms of fractal dimension as given below [16]:
$\frac{S}{V}=2\frac{2-{{D}_{\text{v}}}}{{{D}_{\text{v}}}-1}\frac{r_{\min }^{1-{{D}_{\text{v}}}}-{{r}^{1-{{D}_{\text{v}}}}}}{{{r}^{2-{{D}_{\text{v}}}}}-r_{\min }^{2-{{D}_{\text{v}}}}}$
Considering the detection scope of relaxation time, the actual pore size range measured by NMR satisfies r>>rmin; thus, Eq. (3) can be simplified to
$\frac{S}{V}=2\frac{2-{{D}_{\text{v}}}}{1-{{D}_{\text{v}}}}\frac{1}{r}$
Combining Eqs. (2) and (4) yields the conversion equation for NMR pore size and transverse relaxation time in terms of spatial fractal dimension:
$r=2\rho \frac{2-{{D}_{\text{v}}}}{1-{{D}_{\text{v}}}}{{T}_{2}}={{C}_{D}}{{T}_{2}}$
Obviously, the conversion coefficient CD in Eq. (5) cannot be regarded as a constant value but should be obtained in segments corresponding to different fractal dimensions. Taking sample 2-7 as a case, the surface relaxation rate of the sample was initially fitted by a constant value, and then segmental conversion of pore size was performed by using the spatial fractal dimension Dv in Fig. 8 c for the different pore size ranges (Fig. 9 ). Compared with the results obtained using the constant conversion coefficient method, the accuracy of pore size conversion was significantly improved by introducing the fractal dimension. The distribution frequencies of the micro- and macro- pores using the fractal dimension method are more consistent with the result of the MIP method.
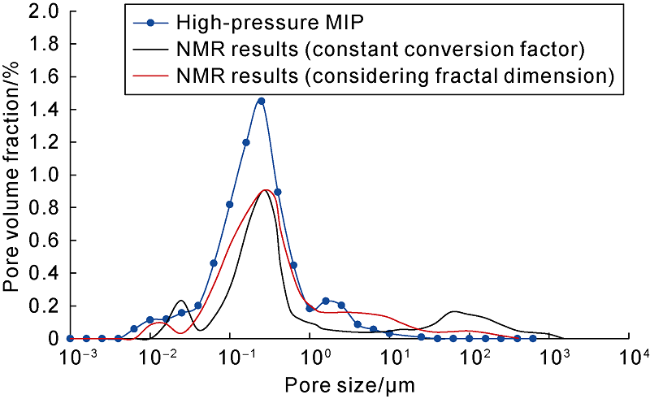
Fig. 9. Comparison of pore size distribution obtained using NMR with that using high-pressure MIP method. Black Line: constant conversion factor; Red Line: considering fractal dimension. |
3.2 Characterization of stress sensitivity for different pore throat scales
The pore size distribution curves obtained by NMR were used to calculate the reduction in the pore volume under different stress conditions to quantitatively assess the damage characteristics associated with the stress sensitivity corresponding to the pore-throat distribution (Fig. 10 ). The following results were obtained: (1) Core 3-2 has a large range of pore-throat distribution and good sortability, and the corresponding stress sensitivity is moderately weak. As stress changed, the reduction in the pore volume was in good agreement with the frequency of the pore size distribution, and the irreversible pore loss was relatively low, indicating that the stress sensitivity had an almost similar effect on the pore throats with different sizes (Fig. 10 a and 10b). (2) The dominant pore sizes of core 3-4 are 0.01-0.50 μm, and the corresponding stress sensitivity is moderately weak. Stress-induced reduction of the pore volume mainly appeared at the mesopore scale. One horizontal fracture was observed but it did not have a discernible effect on the pore volume because of the small fracture opening (only 0.01 mm) and poor effectiveness (Fig. 10 c and 10d). (3) The micropores and macropores-fractures in core 2-7 take up a relatively large volume proportion locally and the corresponding stress sensitivity is moderately strong. The macropores-fractures has a very strong influence on the irreversible loss of the pore volume, especially for pore diameters larger than 35 μm (mainly corresponding to the characteristic section of the fractures), where most of the reduction in the pore volume was irreversible (Fig. 10 e and 10f).
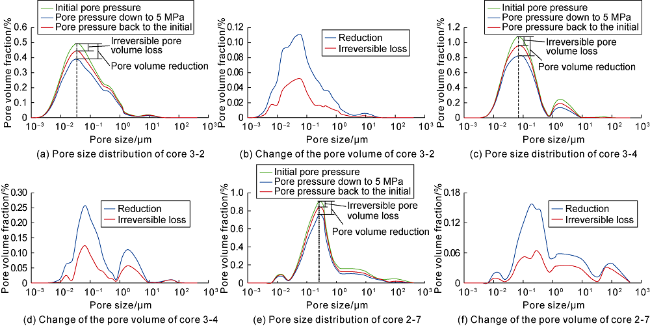
Fig. 10. Relationship between change of pore volume and pore size under different stress conditions. |
To quantitatively describe the influences of different pore-throat sizes on the stress sensitivity, 0.02, 0.50 and 35.00 μm were taken as the boundaries between micropores and mesopores, mesopores and macropores, and macropores and fractures, respectively. Using the data from the pore pressure dropping to 5 MPa, the ratio of the cumulative pore volume reduction on each pore size scale to the total pore volume reduction was calculated to determine their contribution rate to the stress sensitivity. Similarly, with the data from the pore pressure returning to the initial value, the corresponding contribution rate to irreversible loss was obtained from the ratio of the cumulative pore volume reduction on each pore scale to the total pore volume reduction (Fig. 11 ). The following results were obtained: (1) The stress sensitivity of the carbonate reservoirs was mainly originated from the mesopores, which contributed by more than 50%. (2) The micropores made significant contribution to the stress sensitivity (as evidenced on core 3-2), and the contribution rate was approximately 35%. (3) The fractures significantly exacerbated the stress sensitivity. The contribution rates of a single high-angle fracture in core 2-7 to the stress sensitivity and irreversible damage are 9.6% and 15.7%, respectively. Note that the analysis is based on the pore volume. For fractures typically with low-porosity and high-permeability characteristics, their effect on the stress sensitivity would be more significant in actual cases.
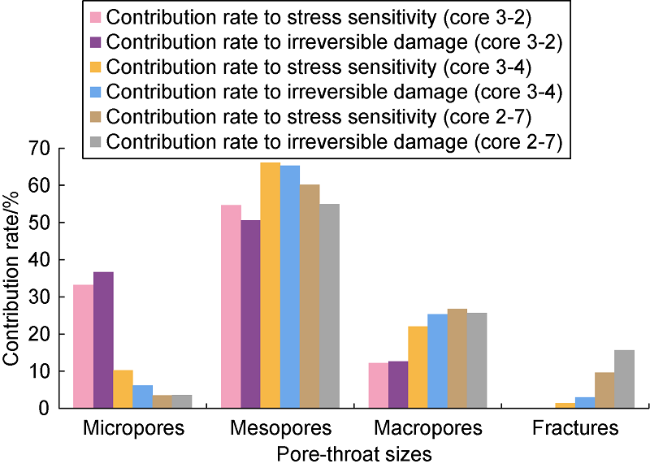
Fig. 11. Contributions rate of different pore-throat sizes to stress sensitivity and irreversible damage. |
4. Microscopic mechanisms for reservoir stress sensitivity
Based on the differences in mechanical properties between pores and fractures [17], the dominant microscopic mechanism of stress sensitivity of carbonate reservoirs can be concluded in Fig. 12 . As the formation pressure decreases, the stress sensitivity to matrix is mainly resulted from the elastic contraction of pores, bending deflection of pore throats, plastic deformation of rock skeleton and fragmentation and migration of particles; the stress sensitivity to fractures is mainly originated from fracture closing, bending, surface displacing and micro-particle filling. In general, elastic contraction of pores, bending deflection of pore throats and fracture closing are the dominant factors on the stress sensitivity of gas reservoirs. However, under special conditions, such as abnormally high pressure, plastic compaction of rock skeleton would become a non-negligible factor.
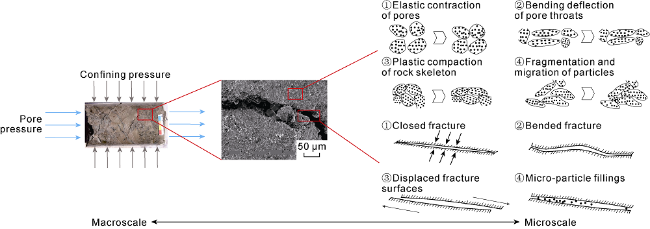
Fig. 12. Microscopic mechanism for stress sensitivity of fractured carbonate reservoirs. |
This mechanistic description effectively explains the differences in the stress sensitivity characteristics of the different types of reservoirs shown in Figs. 5 and 6 . When fractures are the dominant contributor to permeability, fracture closure caused by pressure depletion leads to a rapid decrease in the permeability, and the stress sensitivity degree thus increases with the initial permeability. However, for porous reservoirs with no fractures, the general permeability is extremely low for micropores which are prone to plastic compaction under stress, causing irreversible damage. When the scale of the pore throats gradually increases, the stress sensitivity begins to increases with permeability.
To quantitatively characterize the effect of different factors on the stress sensitivity, expressions were developed for the permeability of matrix pores and single fractures (Eqs. (6) [18] and (7)):
${{K}_{\text{m}}}={{c}_{\text{kc}}}\frac{1}{{{\tau }^{2}}}\frac{{{\phi }_{\text{m}}}}{{{\left( 1-{{\phi }_{\text{m}}} \right)}^{q}}}$
where $q={\left( 2-{{D}_{\text{s}}} \right)}/{\left( 3-{{D}_{\text{v}}} \right)}\;$
${{K}_{\text{f}}}={{c}_{0}}\frac{{{b}^{2}}}{12}$
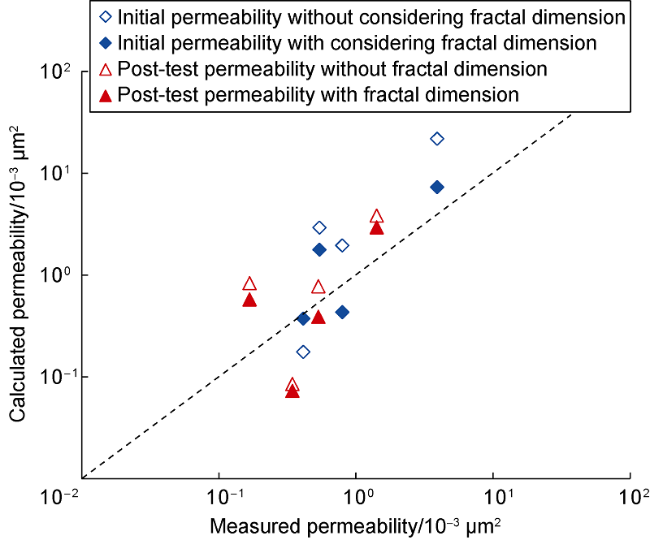
For a reservoir with n fractures, the equivalent permeability of the matrix-fracture system can be calculated using Eq. (8). The test data and the fractal dimension mentioned above were used to develop an empirical relationship (Eq. (9)) for the permeability of the carbonate gas reservoirs on the right bank of Amu Darya through regression analysis. This relationship is mainly applicable to carbonate gas reservoirs containing pores and fractures which are mainly medium- to small high-dip ones with the fracture density less than 10 m−1.
${{K}_{\text{e}}}={{K}_{\text{m}}}+\sum\limits_{i=1}^{n}{{{\phi }_{_{\text{f}i}}}{{K}_{\text{f}i}}\cos {{\alpha }_{i}}}$
${{K}_{\text{e}}}=\frac{132.88}{{{\tau }^{2}}}\frac{{{\phi }_{\text{m}}}}{{{\left( 1-{{\phi }_{\text{m}}} \right)}^{1.51}}}+1.05\times {{10}^{6}}{{\phi }_{_{\text{f}}}}{{b}^{2}}$
Fig. 13. Comparison of measured permeability with calculated permeability. |
According to Eq. (9), the dominant microscopic mechanism for permeability damage due to stress sensitivity in carbonate gas reservoirs can be summarized as fracture closure, elastic contraction of pores, and plastic deformation of rock skeleton. The influences of specific factors on the stress sensitivity can be accurately described using the permeability calculation method proposed in this study.
5. Conclusions
As the initial permeability of porous reservoirs increases, the stress sensitivity coefficient decreases and then increases, and the permeability recovery rate increases and then decreases. As the initial permeability of fractured-porous reservoirs increases, the stress sensitivity coefficient increases monotonically and the permeability recovery rate decreases monotonically.
The pore structure of carbonate reservoirs exhibits multiple fractal characteristics and the fractal dimension on the macropore-fracture scale is larger than that on the mesopore and micropore scales. The loss of pore volume induced by stress sensitivity mainly occurs on mesopores with contribution rate more than 50%. The contribution rates of a single high-dip fracture to the stress sensitivity and irreversible damage are 9.6% and 15.7%, respectively.
The dominant microscopic mechanisms for the stress sensitivity of carbonate gas reservoirs can be concluded as fracture closure, elastic contraction of pores and plastic deformation of rock skeleton.
Nomenclature
b—fracture opening, mm;
c0—unit conversion factor, 1×10⁹, dimensionless;
CD—conversion factor considering fractal dimension, μm/ms;
cKC—constant related to Kozeny-Carman coefficient, 10−3 μm2;
Dv—spatial fractal dimension, dimensionless;
Ds—planar fractal dimension, dimensionless;
Fs—shape factor (2 for cylinder; 3 for sphere), dimensionless;
i—serial number of fractures;
Ke—equivalent permeability, 10−3 μm2;
Kf—fracture permeability, 10−3 μm2;
Km—matrix permeability, 10−3 μm2;
n—total number of fractures;
N—number of core samples;
pc—capillary pressure, MPa;
pc,min—mercury injection pressure corresponding to the minimum pore size, MPa;
q—constant related to fractal dimension, dimensionless;
r—pore size, μm;
rmin—the minimum pore size, μm;
SHg—mercury saturation, f;
S—internal surface area of pores, μm2;
T2—transverse relaxation time, ms;
V—pore volume, μm3;
αi—angle between the ith fracture and flow direction, (°);
ρ—surface relaxation rate of media, μm/ms;
τ—pore tortuosity, dimensionless;
ϕfi—porosity of the ith fracture, f;
ϕm—matrix porosity, f.