

Introduction
The Santos Basin in Brazil is by far the passive continental margin basin with the most abundant hydrocarbon resources in the deep-water field of the world. Oil and gas discoveries are mainly concentrated beneath the thick salt rock in the deep-water São Paulo plateau (also known as the Lula-Sugar uplift belt) [1-2]. Since the discovery of Lula Field in 2006, Petrobras has focused its efforts on exploration and development of deep-water pre-salt hydrocarbon in the Santos Basin. A total of 38 pre-salt oil and gas fields have been discovered by the end of 2021, of which seven are mega-oilfields (an individual field with probable PIIP (petroleum initially-in-place) exceeding 10×108 t), and the cumulative proven recoverable reserves of oil and gas are approximately 60×108 t oil equivalent, accounting for 97% of the total proven reserves in the basin. It is revealed that the pre-salt strata in the basin have a great exploration potential for oil and gas resources. Since 2013, oil and gas companies from China have been involved in hydrocarbon exploration and development in about 15 pre-salt blocks and the most important achievement is the exploratory success of Well Curaçao-1 (1-SPS-108-SPS), which was considered to be the largest oil discovery in the world in 2021. Located in the Aram Block in the Aram-Uirapuru uplift belt [1] of the Santos Basin, Well Curaçao-1 is one of the major oil discoveries made so far outside the São Paulo plateau.
The geological characteristics of oil and gas in the São Paulo plateau have been extensively studied and discussed, mainly focusing on the uplift and depression pattern and structural evolution of the basin [3⇓⇓⇓-7], the regional source-reservoir-cap associations [8⇓⇓-11], the igneous rock [12-13] and petroleum systems in the São Paulo plateau[14⇓⇓⇓-18], etc. However, there are relatively few discussions on the distribution characteristics and regularity of pre-salt oil and gas in other areas of the basin (e.g. the Aram-Uirapuru uplift belt). Moreover, scholars have not reached an agreement on the division scheme of tectonic units in the Santos Basin, and there are big differences in the understanding of the main controlling factors and exploration potential of pre-salt oil and gas accumulation in different belts, which restricts the expansion of exploration activities for oil and gas beyond the São Paulo plateau.
Regarding the key technologies for pre-salt oil and gas exploration in the Santos basin, previous authors have done a lot of work in carbonate reservoir prediction, igneous rock prediction and well-log interpretation by using seismic attribute analysis [19-20], seismic facies analysis[21⇓-23], post-stack wave impedance inversion [24-25], pre- stack elastic inversion [26⇓-28], spectrum decomposition [29-30], amplitude variation with offset (AVO) analysis [31-32], etc. However, the pre-salt lacustrine carbonates in the Santos basin have undergone complex superimposed modifications of volcanism, diagenesis and tectonism etc., resulting in strong reservoir heterogeneity. The characteristics of seismic response to carbonate reservoirs with different paleogeomorphologies are complex. In addition, the accurate prediction of reservoir and fluid distribution is very challenging due to the high content of supercritical CO2. Therefore, it is urgent to summarize and develop a set of key oil and gas exploration technologies that are applicable to the study area.
Based on a systematic review of the history of oil and gas exploration in the Santos Basin, Brazil, this paper focuses on the significant theoretical understanding and technological progress acquired by CNPC in the discovery of deep-water pre-salt large oil and gas fields in the basin. It is expected to provide some reference for the exploration of large pre-salt oil and gas fields in the Santos Basin and even the deep-water salt basins on both sides of the South Atlantic.
1. Geological background and exploration history
1.1. Geological setting
The Santos Basin is located in the southeastern waters of South America, adjacent to the Campos Basin to the north and the Pelotas Basin to the south, covering an area of 32×104 km2. There are two major exploration systems in the basin, namely pre-salt and post-salt, with the pre- salt system being the main focus. The pre-salt structure, generally NE-SW striking, shows a tectonic pattern of “two uplifts and three depressions”. From west to east, the western depression, the Aram-Uirapuru uplift, the central depression, the Lula-Sugar uplift and the eastern depression are developed successively (Fig. 1 a).
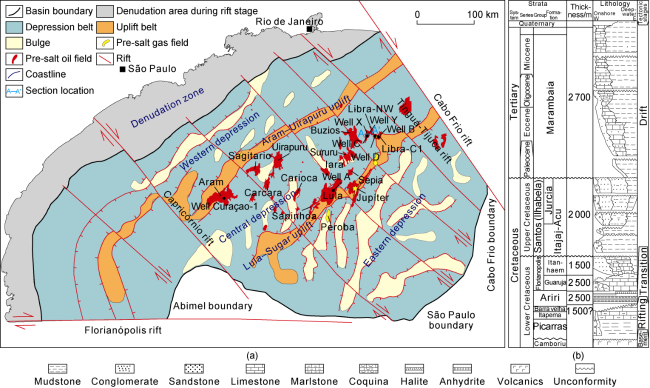
Fig. 1. (a) Division of structural units and (b) stratigraphic histogram in the Santos Basin, Brazil. |
The tectonic evolution of the Santos Basin is related to the disintegration of the Gondwana continent and the expansion of the South Atlantic since the Mesozoic, with three stages of rifting, transition and drift. Three ultra-thick sedimentary sequences were developed correspondingly, i.e., the rifting mega-sequence, transitional mega-sequence and drift mega-sequence [17]. The rifting mega-sequence includes the Picarras Formation, Itapema Formation and Barra Velha Formation. The Picarras Formation is mainly composed of deep lacustrine mudstone and shale, and the lacustrine shale is one of the main hydrocarbon source rocks in the Santos Basin. The Itapema Formation is dominated by lacustrine shale, marl and coquina. The coquina stratum is one of the main pre-salt reservoirs. The Barra Velha Formation is mainly composed of stromatolites and spherulites which is the main pre-salt reservoirs. The Ariri Formation is formed within the transitional mega-sequence, which is under an evaporative environment with mainly a set of thick evaporite deposits (halite and anhydrite) to form a regional cap rock. The drifting mega-sequence is dominated by marine deposition (Fig. 1 b).
1.2. Exploration history
The oil and gas exploration activities of the Santos Basin began in the 1980s. Early exploration mainly aimed at structural traps in the shallow-water area. The discoveries of hydrocarbon were mainly small- to medium-sized gas reservoirs and minor oil reservoirs. At the beginning of 21th century, pre-salt exploration commenced in the basin until the Lula oilfield was discovered in 2006, which confirmed the existence of an effective pre-salt petroleum system and opened the exploration prelude of deep-water pre-salt hydrocarbon. The history of oil and gas exploration can be divided into 3 phases.
1.2.1. Exploration of the main body of the Lula-Sugar uplift belt (2005-2010)
In 2005, the first deep-water pre-salt exploration well in the Santos Basin yielded oil and gas, and then in 2006, the second deep-water pre-salt exploration well declared the discovery of a mega-oilfield (Lula oilfield with probable PIIP of 35×108 t) ( Table 1 ). The Lula-Sugar uplift belt was confirmed as the most favorable oil and gas accumulation zone in pre-salt layers.
Table 1. Mega pre-salt oil and gas fields in the Santos Basin, Brazil |
| Field name | Type | Year of discovery | Water depth/ m | Area/ km2 | Structural unit | Discovery formation | PIIP (oil equivalent)/108 t | Relative density | GOR/ (m3·m−3) | Content of CO2/ % | Discovery well |
|---|---|---|---|---|---|---|---|---|---|---|---|
| Lula | Oil field | 2006 | 2126 | 1100 | Lula-Sugar uplift belt | Lower Cretaceous Barra Velha Formation, Itapema Formation | 35.48 | 0.865 4- 0.892 7 | 301 | 1-20 | 1-RJS-628A |
| Jupiter | Oil and gas field | 2008 | 2187 | 603 | Lula-Sugar uplift belt | Lower Cretaceous, Barra Velha Formation | 10.94 | 0.876 2- 0.952 9 | 180 | 79 | 1-RJS-652 |
| Sururu | Oil field | 2008 | 2230 | 159 | Lula-Sugar uplift belt | Lower Cretaceous Barra Velha Formation, Itapema Formation | 12.34 | 0.876 2- 0.898 4 | 611 | 8-26 | 1-RJS-656 |
| Buzios | Oil field | 2010 | 1889 | 511 | Lula-Sugar uplift belt | Lower Cretaceous Barra Velha Formation, Itapema Formation | 47.54 | 0.887 1 | 255 | 23 | 2-ANP-1- RJS |
| Libra | Oil field | 2010 | 1964 | 192 | Lula-Sugar uplift belt | Lower Cretaceous Barra Velha Formation, Itapema Formation | 17.72 | 0.892 7 | 440 | 45 | 2-ANP-2A- RJS |
| Sepia | Oil field | 2012 | 2197 | 107 | Lula-Sugar uplift belt | Lower Cretaceous Barra Velha Formation, Itapema Formation | 11.43 | 0.898 4 | 262 | 23 | 1-RJS-691A- RJS |
| Aram | Oil field | 2021 | 1905 | 798 | Aram-Uirapuru uplift belt | Lower Cretaceous Barra Velha Formation | 12.15* | 0.849 8- 0.865 4 | 350 | 5 | 1-SPS-108- SPS |
Note: the data source from IHS; and data with * represents predicted PIIP. |
Drilling operation was mainly concentrated in the core area of the pre-salt structure in Lula-Sugar uplift at that stage, with a 74% success rate of exploration wells. 17 oil and gas fields were discovered with cumulative probable PIIP of 152×108 t. Among them, 5 oil and gas fields were characterized by probable PIIP at the scale of 10×108 t (up to 48×108 t) (Table 1 ), 2 fields with probable PIIP at the scale of 5×10⁸ t, and 6 fields with probable PIIP at the scale of 1x10⁸ t. Large-scale structural traps (covering 1100 km2 in Lula oilfield), large reservoir thickness (up to 400 m thick in Mero oilfield), high degree of trap filling crude oil with relative density of 0.865 4 -0.952 9, medium to high GOR (gas-oil ratio of 180-611 m3/m3), and the existence of CO2 (generally less than 45%), all have confirmed that the Lula-Sugar uplift belt has excellent conditions for hydrocarbon accumulation (Table 1 ).
1.2.2. Exploration stage in the periphery of the Lula-Sugar uplift belt (2011-2019)
In 2011, pre-salt oil and gas exploration was expanded to the periphery of the Lula-Sugar uplift belt. In total, 17 oil and gas fields were discovered with a success rate of 57% for exploration wells during this stage. The cumulative probable PIIP was 47×108 t. Among them, one oil and gas field held probable PIIP at the scale of 10×108 t (Table 1 ), three oil and gas fields at the scale of 5×10⁸ t probable PIIP, and three oil and gas fields at the scale of 1×10⁸ t probable PIIP.
In the western margin of the Lula-Sugar uplift belt, volcanism is relatively active. The area of structural trap is limited and the lateral variation of the reservoir is rapid. The degree of trap filling is high, and the crude oil has a relative density of 0.855 0-0.898 4. The GOR is medium to high (240-450 m3/m3) and CO2 content is less than 25%. Anomalous high pressure presents with a pressure coefficient about 1.5. The main reason for drilling failure may be the underdeveloped reservoirs during the later stage of tectonic inversion. The eastern margin of the Lula-Sugar uplift belt is relatively deficient in oil sources and at risk of strong CO2 charging. The filling degree is approximately 70% in some structural traps. The crude oil has a relative density of 0.887 1-0.959 3 and the GOR is medium to high. Gas caps are developed with a high content of CO2 up to 96%. Drilling failure of some exploration wells is due to strong charging of CO2 and underdeveloped reservoirs, which may be caused by denudation during tectonic uplifting, only leaving low-energy deposits.
Exploration practice in the periphery of the Lula-Sugar uplift belt shows that there are significant differences in hydrocarbon accumulation conditions in different tectonic zones, which brings increasing geological risks. To avoid taking on the risk of investment failure alone, Brazil National Energy Agency launched a tender proposal for the pre-salt blocks in 2013 to bring in international oil and gas companies to carry out joint pre-salt exploration and development. However, the overall results of exploration in the bidding blocks are lower than expected, with a total of seven oil and gas discoveries mainly in small- and medium-sized oil and gas reservoirs with high CO2 content. In particular, the CO2 content is as high as 96% in the gas reservoirs drilled in the eastern margin of the Lula-Sugar uplift belt, with the CO2 column predicted to be over 500 m. This reveals the complex conditions of hydrocarbon formation and accumulation on the eastern margin of the Lula-Sugar uplift belt.
1.2.3. Exploration in the Aram-Uirapuru uplift belt (2020-present)
The complex pre-salt structures in the Santos Basin have restricted the study of structural units. Previous studies have mainly classified structural units according to the structural features of the top surfaces of the pre-salt target layer, but the characteristics of the tectonic evolution of passive continental margin have not been fully considered, which posed a challenge to the rational division of structural pattern during the rift period. Through the processing and interpretation of gravity and magnetic data, as well as the structural analysis of the regional two-dimensional seismic data, CNPC researchers have newly identified the Aram-Uirapuru uplift belt in the western margin of the central depression. It is recognized that the Aram-Uirapuru uplift belt is a large-scale and inherited paleo-uplift belt, which is located opposite the Lula-Sugar uplift belt across the paleo-lake and has similar hydrocarbon formation conditions and great exploration potential.
In 2020, a crude oil discovery was made in the Uirapuru block in the middle of the Aram-Uirapuru uplift belt. In 2021, the first exploration well, Curaçao-1, drilled in the Aram Block in the western margin of the Aram- Uirapuru uplift belt, made a major discovery with light crude oil (relative density of 0.849 8-0.865 4), high GOR (about 350 m3/m3), anomalously high pressure, and CO2 content about 5%. High production was obtained in the DST (drill stem test) in 2022, which further confirmed that the Aram-Uirapuru uplift belt is a favorable oil and gas accumulation belt (Table 1 ).
2. Progress in the understanding of oil and gas geological theory
2.1. Identification of the structural pattern of “two uplifts and three depressions” and Aram-Uirapuru uplift belt
Six principles for tectonic unit division have been proposed based on the tectonic evolution and sedimentary sequences of the Santos Basin: namely, determining the units based on the tectonic characteristics of rift basin, dividing the units based on the structural pattern of uplift-depression at the late rift stage, determining the uplift-depression boundary based on the primary faults and sedimentary characteristics of the late rift stage, determining the bulge-sag boundary based on the secondary faults and sedimentary characteristics of the late rift stage, determining the segment boundary based on the slip-strike faults of the early rift stage, and combining geological and geographical information to name the units. The six principles have laid the foundation for the division of tectonic units in the Santos Basin.
Based on gravity anomaly and seismic data, an accurate post-salt stratigraphic distribution was obtained and its gravity anomaly was stripped by forward modeling. The gravity anomaly of the salt layer was obtained by the method of minimum curvature separation, and then the accurate pre-salt gravity anomaly was obtained. Combined with the pre-salt fault system inferred by the NVDR-THDR (normalized vertical derivative of the total horizontal derivative) method, the pre-salt structural pattern of the Santos Basin was restored under the constraints of seismic, drilling and ODP (ocean drilling program) data. A new tectonic unit division scheme was proposed. Under the guidance of the above ideas, seven criteria for tectonic unit division were determined: high-precision Bouguer gravity anomaly is the basic data for determining the unit division of the basin; the cross-basin seismic profile is the key data for determining the structural pattern and unit division; high-precision three-dimensional seismic data is the main basis for determining the unit boundary; logging and core data are important basis for determining paleogeography; stratigraphic thickness based on two-dimensional seismic data is the reference for determining the unit boundary; magnetic anomaly is the auxiliary data for identifying the basin boundary and structural pattern; and regional tectonic information is auxiliary for determining the control factors of tectonic evolution. The determination of the seven criteria has indicated the implementation method for the tectonic unit division of the Santos Basin.
Based on the above principles and criteria, the Santos Basin is divided into five first-order tectonic units, including two uplifts (Lula-Sugar uplift and Aram-Uirapuru uplift) and three depressions (central depression, western depression and eastern depression) (Fig. 1 a). In the previous structural pattern, the Aram-Uirapuru uplift was considered to be part of the central depression [8-9] (due to its low topography, it was considered to have reservoir risks, resulting in few international petroleum companies bidding). In the new structural pattern, the Aram-Uirapuru uplift is considered to be a paleo-uplift adjacent to the central depression, and in the paleogeographical location, it was separated from the Lula- Sugar uplift (known mature hydrocarbon area) across the lake, so that the two should have similar hydrocarbon accumulation conditions. The great discovery and drilling results made in the Alarm Block in 2021 have fully confirmed the correctness of the understandings above.
2.2. Oil and gas enrichment was controlled by the main hydrocarbon source kitchen in rift period
The pre-salt source rocks in the Santos Basin mainly consist of lacustrine black shale of Picarras and Itapema formations of Lower Cretaceous, which are characterized by wide distribution, large thickness, good organic matter types, high abundance and great generation potential [1]. Drilling data reveals that this set of source rocks is 100 to 300 m thick and deposited in the lacustrine environment during the syn-rift period, especially the source rocks in the three structural units, namely the central depression, the western depression and the eastern depression, are of good quality with TOC of 0.51%-7.32% (the average value of 1.67%), HI of 292.13-998.00 mg/g (the average value of 721.61 mg/g), the average value of generation potential (the sum of S1 and S2) of 18.2 mg/g, and primarily Type I and Type II1 kerogen. The hydrocarbon-generating sag in Santos Basin is over 100 000 km2, which has great hydrocarbon-generating potential and resources.
The maturity of the pre-salt source rocks in Santos Basin is characterized by the zonation of "mature in the central and east, over-mature in the west", and the central depression provides the main oil sources. The thick salt rock in the central depression distributes continuously, which delays the pre-salt source rocks evolution. The pre-salt source rocks are at the peak stage of oil generation with Ro of 0.7%-1.3%, which shows that oil generation is dominant. Due to the large scale and strong hydrocarbon supply capacity of hydrocarbon generation kitchens in the central depression, sufficient oil sources are provided for the pre-salt oil and gas fields. The eastern depression also develops continuous thick salt layer, which mainly generates oil. However, the bulge belt and sag belt of the eastern depression are arranged alternately, and the sag distribution is discontinuous, leading to the great changes in the sedimentary thickness of source rocks. Only several small hydrocarbon source kitchens are developed locally, with a relatively insufficient hydrocarbon supply capacity. The salt rock is thin and discrete in the western depression, and the Ro values of most source rocks are over 1.7%, which is at the peak stage of gas generation. Therefore, the western depression generates gas due to the limited scale of hydrocarbon generation kitchens, and the hydrocarbon supply capacity is far less than that in the central depression.
Based on basin modeling, it is predicted that the pre-salt oil and gas resources in the Santos Basin are about 3899.0×108 t, of which the oil and gas resources of Itapema Formation and Picarras Formation are 2446.3× 108 t and 1452.7×108 t, accounting for 62.74% and 37.26% of the total resources, respectively. Since the end of the Barra Velha Formation deposition, the Santos Basin has experienced multiple phases of hydrocarbon generation and expulsion, which is mainly manifested by the migration and accumulation of oil and gas from the hydrocarbon source kitchens along faults or structural ridges to the structural traps in the uplift zone. The central depression, as the primary hydrocarbon source kitchens of pre-salt reservoirs, has supplied more than 95% of the total discovered PIIP in the discovered oil and gas fields. The probable PIIP in Buzios oilfield on the eastern Lula-Sugar uplift belt exceeds 48×108 t oil equivalent, and that of the Lula oilfield is about 35×108 t. The Aram oil field, on the western Aram-Uirapuru uplift belt, has a huge amount of PIIP as well, and the structural traps on the uplift have a high degree of oil and gas filling, demonstrating a very strong oil and gas supply capacity of the source rocks in the central depression.
2.3. Control of paleo-structures on the scale and quality of lacustrine carbonate reservoirs
Paleo-structures refer to the positive paleogeomorphy formed mainly by extension, which can be divided into a rift stage and a depression stage during rift period in the Santos Basin. During the rift stage, the tectonic activities determined the embryonic form of the "two uplifts and three depressions" structural pattern, forming two carbonate platforms sandwiched between three deep lake zones, with the main lake located in the central depression. On the two platforms and many islands in lake zones and their periphery, the coquina, represented as freshwater lake basin carbonate rocks, was deposited with a thickness ranging from tens of meters to hundreds of meters, which is an important reservoir body for pre-salt hydrocarbon. During the depression stage, the tectonic activity was weakened and the structural pattern was inherited and developed. The Santos Basin evolved into a shallow saline lake basin, and spherulite and stromatolite facies were deposited with a thickness ranging from tens of meters to hundreds of meters (Fig. 2 ). It is the main reservoir body for pre-salt hydrocarbon distributed more widespread than the coquina reservoir.
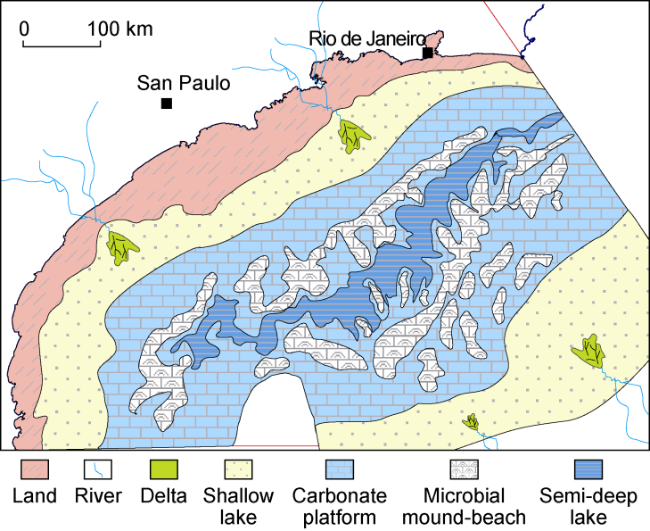
Fig. 2. Sedimentary facies of the Lower Cretaceous pre-salt Barra Velha Formation in the Santos Basin. |
Four types of positive paleogeomorphy, namely monoclinic fault block, fault-uplift, fault horst and volcanic high, control the thickness and scale of carbonate rock, thus controlling the distribution of favorable lacustrine carbonate reservoirs (Fig. 3 ). Monoclinic fault block and fault-uplift are the main positive paleogeomorphic units for the development of carbonate reservoir. The sedimentation is mainly characterized by accumulation and progradation. The mounded beach is commonly found with vertical superposition and lateral migration. The reservoir has a large thickness and wide distribution, which can be found in Lula-Sugar uplift, Aram-Uirapuru uplift and eastern depression. The total area of carbonate reservoir in the Lula-Sugar uplift exceeds 12 000 km2. For example, in the Buzios oilfield whose tectonic background is a fault-uplift, coquina, spherulite and stromatolite reservoirs cover about 800 km2, with an average thickness of about 200 m and a maximum thickness of 500 m. Fault horst and volcanic high are also important positive paleogeomorphic units for the development of carbonate reservoir, mainly distributed in the central depression and western depression, and characterized by independent structures. Carbonate sedimentation is characterized by accumulation. The area of carbonate reservoir is usually less than 200 km2, and the thickness varies from tens of meters to 400 m, with large lateral variation.
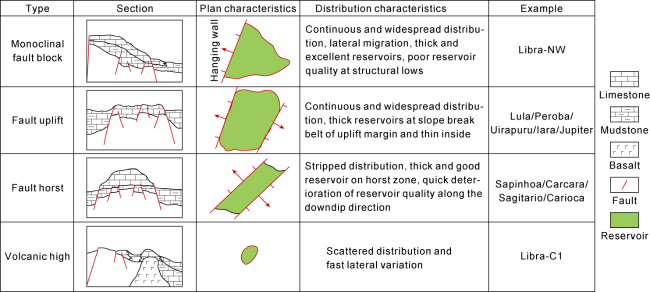
Fig. 3. Pattern diagram of four types of paleogeomorphgy controlling the pre-salt carbonate reservoirs in the Santos Basin. |
In the pre-salt lacustrine carbonate intervals, three types of medium porosity and medium permeability reservoirs are developed, including coquinas, spherulite and stromatolite. The reservoir storage space is mainly composed of primary pores which are almost intergranular pores, intragranular pores and growth-framework pores. The average porosity is 8%-15%, and the maximum porosity may exceed 25%. The average permeability ranges from tens to hundreds of millidarcies (Fig. 4 ). The average net-to-gross ratio is about 62%, and the highest ratio may reach 95%. The distribution of the reservoirs is generally controlled by the sedimentary facies, but the burial diagenesis is relatively weak.
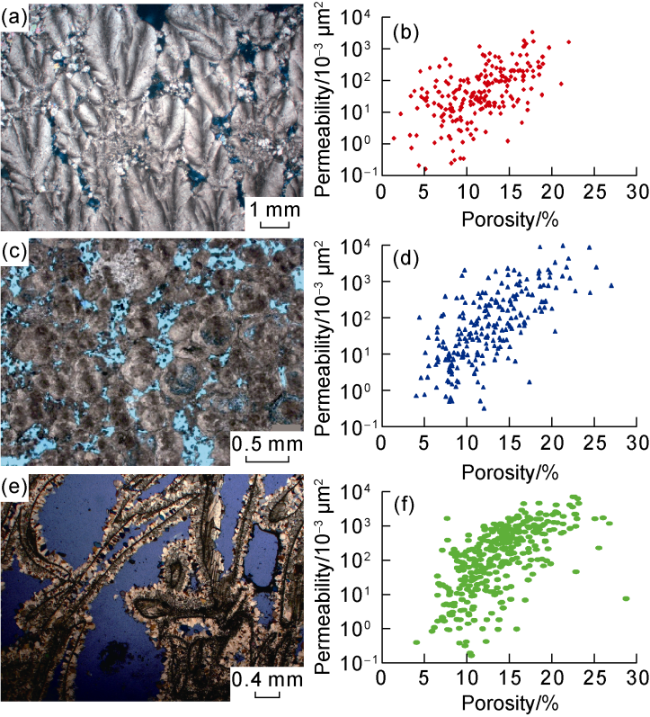
Fig. 4. Types and porosity vs. permeability of pre-salt lacustrine carbonate reservoirs in the Santos Basin. (a) Intergranular pores, stromatolite, 5438.0 m, Well A; (b) Porosity vs. permeability of stromatolite reservoir; (c) Intergranular and intragranular pores, spherulite, 5058.0 m, Well B; (d) Porosity vs. permeability of spherulite reservoir; (e) Intragranular and moldic pore, coquinas, 5364.0 m, Well C; (f) Porosity vs. permeability of coquinas reservoir. |
2.4. Continuous thick salt rock controls the accumulation and preservation of oil and gas
The salt rocks of the Lower Cretaceous Ariri Formation, which have large thickness and strong sealing capacity, are widely distributed in the Santos Basin. The salt rock is distributed in the NE-SW direction, about 650 km long from north to south, and 380 km wide from east to west. The thick salt rocks are mainly distributed in the central depression, eastern depression, the south and central sections of Lula-Sugar uplift and Aram-Uirapuru uplift, with a thickness of hundreds of meters to 4500 m and continuous lateral spread, without the development of salt windows. The thick salt rocks directly cover the carbonate rocks and become efficient regional cap rocks. Oil and gas are effectively preserved and sealed in the pre-salt traps. At present, all the large oil and gas fields discovered under the salt interval are covered by thick salt rocks, such as Lula oilfield. However, in the western depression and the northern section of the Aram-Uirapuru uplift, the salt rocks are obviously thinner or missing, with many salt windows developed. Oil and gas migrate to the post-salt interval through the salt windows and salt-related faults to form reservoirs, such as Mexilh oil and gas field.
Continuous thick salt layers have an influence on the thermal evolution of hydrocarbon source rocks and reservoir diagenesis. Firstly, due to the high thermal conductivity of salt rocks, the temperature below the thick salt layer is generally lower. When the salt layer reaches 2000 m thick, the temperature of the hydrocarbon source rock below the salt layer may decrease by 25.1 °C, and the Ro of the source rock may be lower than that of the area without salt by 0.6% [33], which delays the thermal evolution of the hydrocarbon source rock, and it is beneficial for late-stage oil generation and long-term oil charging. Secondly, due to the strong plasticity, strong sealing ability and high thermal conductivity of the ultra thick salt rock layer, the diagenesis of the pre-salt strata is significantly weakened, which enables primary reservoir pores to be retained [34]. At present, pre-salt carbonate reservoirs in the basin are in the early-middle diagenetic stage, with weak cementation and good reservoir physical properties.
2.5. Reconstruction of oil and gas reservoirs by CO2 charging
Currently, several oil and gas fields with high-CO2- content gas cap have been discovered in the pre-salt strata of the Santos Basin, such as the Jupiter reservoir, Abare West reservoir, Central Libra reservoir and Peroba reservoir, with CO2 content ranging from 67% to 96%, δ13CCO2 ranging from −8.11‰ to −5.35‰, and helium isotope R/Ra of 5.6-8.8. According to the discrimination diagram of geochemical parameters established by Dai et al. [35], the CO2 in the Santos Basin is mainly of inorganic-mantle origin.
The distribution of CO2 content in the Santos Basin is controlled by crustal thinning and through-going faults, and generally has the characteristics of “high in the east and low in the west” (Fig. 5 ). Reservoirs with high CO2 content are all located near the large strike-slip pull-apart fault in the east of the basin, and the fault throw of its adjacent faults in the later stage is up to 1000-3000 m, indicating a strong late-stage tectonic activity. These faults are all located in the thinned crust area, providing channels for mantle CO2, resulting in strong CO2 charging and forming a gas cap. On the contrary, in the western part of the basin, the fault throw of the uplift-controlled fault is less than 1000 m, indicating that its activity was significantly weaker than that in the eastern uplift zone of the basin. The tectonic activity was dominated by the subsidence of the passive continental margin, with large crustal thickness and low CO2 content.
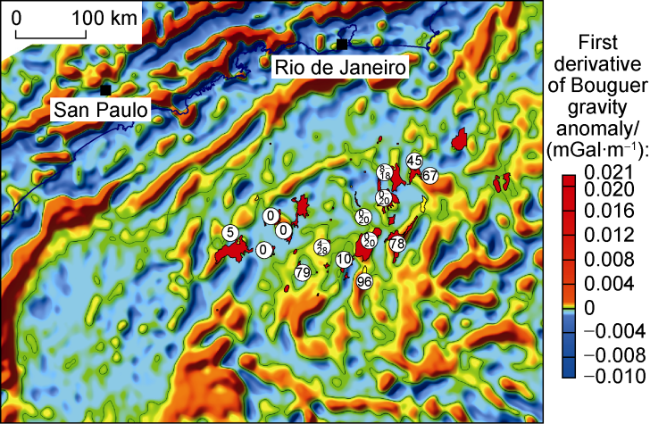
Fig. 5. Superimposition of CO2 distribution and Bouguer gravity anomaly in the Santos Basin (the number in the white circle is the percentage of CO2 in the oil field). |
A new understanding is proposed that the CO2 charging is later than oil and gas charging. Due to the strong fluorescence of crude oil, which can shield the Raman spectrum signal of bubbles and make the bubble components of inclusions difficult to be analyzed and restrict the determination of CO2 charging time in the Santos Basin. Based on the improved experimental process of detecting the gas phase of hydrocarbon inclusions by laser Raman spectroscopy, it was found that only CH4 was detected in the early oil and gas inclusions, and CH4 and CO2 were detected in the late salt water inclusions. Based on this, it is proposed the new understanding of CO2 charging later than oil and gas, which breaks the traditional understanding of "CO2 first and then oil" based on basin modeling by the operators, and indicates that the early volcanic activity contributed limitedly to CO2 charging. The discovered oil and gas fields also confirm that the correlation between CO2 content and early volcanic activity is not close.
Currently, the petroleum reservoirs formed by CO2 charging in the Santos Basin can be roughly divided into three types: oil reservoirs with dissolved CO2, oil reservoirs with CO2 gas-cap, and CO2 reservoirs. Based on numerical simulation and physical experiments of CO2 charging, it is found that the size of oil rim is negatively proportional to the amount of CO2 charging, and positively correlated with GOR [36]. (1) In the early stage of CO2 charging, CO2 is mainly dissolved in oil to form CO2-dissolved oil reservoirs, with a high GOR and CO2 content of generally less than 58%. (2) In the middle stage of CO2 charging, CO2 extracts light components from oil to form a gas-cap oil reservoir with high-content CO2. The volume of the oil rim decreases by 5.7%-6.0% when CO2 increasing by 10%, and the CO2 content is 58%-84%. (3) In the late stage, CO2 almost occupies reservoir space and form CO2 reservoirs. With more and more CO2 filling, the volume of oil rim begins to decrease significantly. And with the decrease of light components in the oil and the extracting capacity of CO2 in the gas cap reaching the limit, the exchange at the gas-liquid interface begins to be weak gradually, and the CO2 content is generally higher than 84%.
Based on numerical simulation and physical experiment, it is predicted that the oil rim in the Central Libra block is 18%-20%, and that in the Peroba block is 4%-5%. The research results provide important technical supports for the exploration plan of the Santos Basin, so CNPC decisively abandoned the Peroba block and successfully acquired the risk exploration area of Aram block.
3. Key exploration technologies
3.1. Variable velocity mapping for layer-controlled facies-controlled pre-salt structure
The salt domes of the Santos Basin are complex in shape and different in thickness. Multiple phases of gypsum rock were mixed in the process of salt rock deformation, resulting in large spatial differences in seismic velocity in the salt domes (the maximum difference up to 2000 m/s). In the velocity model for pre-stack depth migration, the salt layer always uses relatively uniform seismic velocity. The velocity error of the salt layer has an impact on the precision of the pre-salt structural map, leading to a depth error up to hundreds of meters. This poses challenges and operational risks to the evaluation of exploration targets, the deployment of well positions, and the forecasting of drilling engineering.
This study has innovated a seismic velocity modeling technology for the complex salt domes with the joint control of strata and facies. By utilizing the lithology information from mud logging data, numerical statistics of logging velocity, seismic facies identification, seismic interpretation and other data, various types of salt dome lithology, seismic facies and seismic velocity models were established. Based on the original seismic velocity model, the spatial distribution of the salt layer was constrained by seismic horizon interpretation, and the seismic velocity was constrained by the lithology-seismic facies-velocity model. The seismic velocity model reconstructed for the complex salt domes has effectively eliminated the influence of the velocity difference of thick salt layer.
This technology has drastically improved the precision of variable-velocity mapping of the deep-water pre-salt target layer in Brazil. The depth prediction error of the target layer has been reduced from 72-250 m to 4-35 m. It provides powerful technical supports for reserve evaluation and drilling engineering.
3.2. Prediction of lacustrine carbonate reservoirs
The pre-salt lacustrine carbonate reservoirs in the Santos Basin have the characteristics of deep burial, complex lithology, multi-phase migration, strong heterogeneity, and distinct seismic responses, making it difficult to accurately predict by using a simple conventional reservoir prediction method. This study has integrated a series of lacustrine carbonate reservoir prediction technologies based on the combination of seismic facies, highlights and pre-stack elastic inversion. (1) Lacustrine carbonate reservoir prediction based on seismic facies. There is a certain correspondence between seismic facies units and geological facies units. As lithology changes, some physical parameters of reflected waves will vary. Seismic facies reflects the characteristics of lithology to a certain extent, thus unifying the units with similar seismic-stratigraphic parameters in the same seismic sequence into the same seismic facies (Table 2 ). First, by analyzing the lithology and seismic facies, a facies model is established. Then the mound morphology of grainstone and coquinas is identified and characterized by attribute fusion, texture attributes, and clustering analysis. By comparing with similar geological bodies, the associated attributes of the geological body are confirmed, and the seismic recognition model of different geological bodies is established. This eliminates the ambiguity of seismic phenomena, improves interpretation accuracy and effectively recognizes the carbonate shoal and its distribution [20]. (2) Carbonate reservoir prediction based on highlights. Highlights are mainly used to identify the abnormal amplitude of the reflected wave at dominant frequency, and reflect the difference between the peak and the average amplitude in an effective frequency band. After comprehensive analysis of the seismic characteristics of the carbonate shoal, the highlight technology combining amplitude and frequency was adopted (Fig. 6 ). This further improves the distinction between limestone and tight limestone reservoirs. It enables the accurate delineation of the target shoal boundaries and multi-episode features [19,21 -22]. (3) Reservoir prediction based on multi-parameter pre-stack inversion. Rock physics analysis reveals that a single elastic parameter can differentiate igneous rock to a certain extent, but it is hard to effectively distinguish carbonate reservoir from non-reservoir. Multi-parameter cross-plot analysis indicates that P-wave and S-wave impedances, density and GR values can be utilized to better differentiate reservoirs. Consequently, pre-stack elastic inversion, waveform indication inversion, pre-stack Bayesian inversion and other technologies are applied for multi-elastic-parameter quantitative prediction of carbonate reservoirs. Especially based on a FWI velocity model, wave impedance inversion has remarkable improvement on the deep high-impedance layer and the low-impedance layer under igneous rock, and wave impedance continuity of limestone reservoir. The effect of igneous rock has been effectively eliminated, thus improving the accuracy of reservoir prediction. The pre-salt carbonate reservoirs in Libra and Aram blocks have been successfully predicted, and the prediction accuracy in complex lithology zones has been increased from 60% to 85%, providing an effective approach for well location and reserve evaluation [10,12,26⇓ -28].
Table 2. Seismic facies characteristics of pre-salt carbonates of different structural types in the Santos Basin, Brazil |
| Structure type | Typical seismic profile | Seismic facies characteristics | Reservoir characteristics | Example |
|---|---|---|---|---|
| Basement uplift | 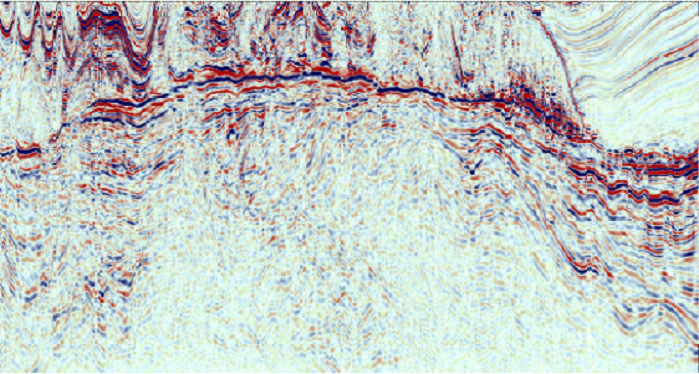 | Shoal facies: sub-parallel, weakly-moderately continuous, weak-moderate amplitude | The reservoir in the uplift is developed in a large scale with small thickness. | Aram Oilfield |
| Non-shoal facies: wedge thickening, continuous, moderate-strong reflection | The reservoir quality becomes poor at the low structural position. | The low position of Aram Oilfield | ||
| Tilted fault block | 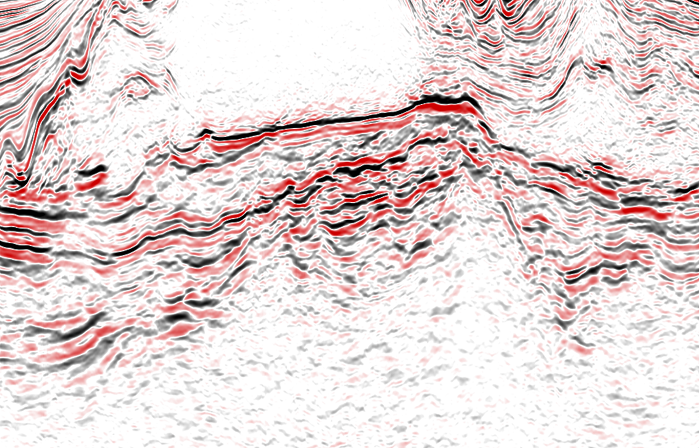 | Shoal facies: S-type foreset deposit, mounded, sub-parallel, weakly continuous, weak- moderate reflection | The reservoirs in the tilted fault block are overlapped and contiguously developed with large thickness and large scale. | Northwest Libra Oilfield |
| Non-shoal facies: continuous, moderate-strong reflection | The reservoir quality becomes poor at the low structural position. | The low position of Northwest Libra Oilfield | ||
| Fault-horst in depression | 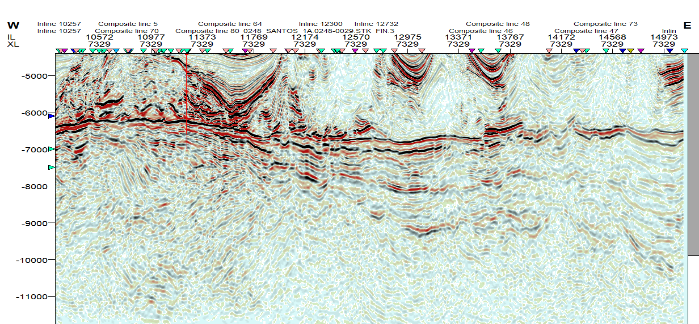 | Shoal facies: mounded, weak reflection | The reservoir is distributed in strips along the horst. | Guanxuma Oilfield |
| Non-shoal facies: continuous, moderate-strong reflection | The reservoir in the graben zone is not developed. | The low position of two flanks of Guanxuma Oilfield | ||
| Volcanic high in depression | 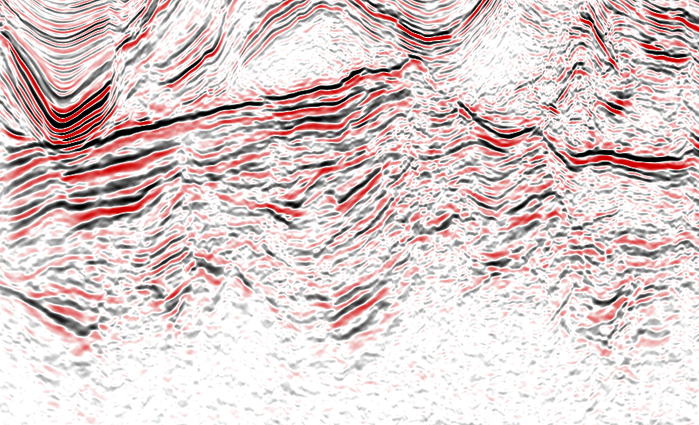 | Shoal facies: mounded, weak amplitude | The reservoir in the volcanic uplift high is limited. | Carcará Oilfield and Well B in Libra Oilfield |
| Non-shoal facies: wedge thickening, continuous, moderate-strong reflection | The reservoir is not developed at the low structural position. | Well D in Middle Libra Oilfield |
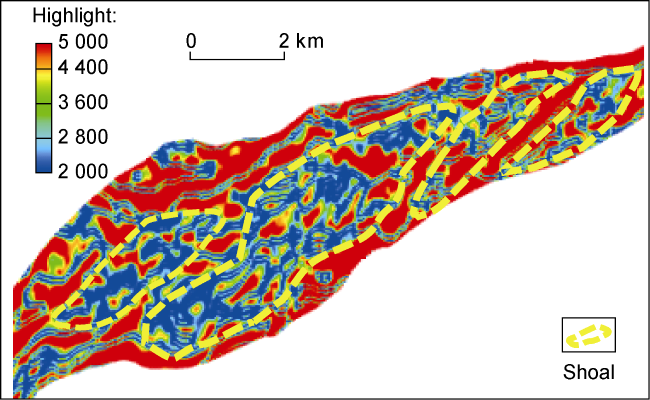
Fig. 6. Identification of carbonate shoal by highlights. |
3.3. Prediction of intrusive/effusive rock distribution
Two types of pre-salt igneous rocks, intrusive rock (diabase) and effusive rock (basalt), are developed in the Santos Basin [37]. The intrusive rock shows strong amplitude, low frequency and parallel continuous reflections on seismic sections, and high velocity and high impedance on logging curves. The intrusive rock is different from carbonate reservoirs, but it has similar lithological characteristics as tight mudstone, calcium/siliceous mudstone. This leads to multiple solutions to recognition and prediction. Through deep analysis of amplitude, frequency and wave impedance characteristics, an intrusive rock identification combination technology featured by strong amplitude, low frequency and high impedance was developed to achieve accurate prediction of intrusive rock (Fig. 7 ). The prediction coincidence rate is currently 100% and the thickness error is less than 3 m. Because of multi-phase eruption, small velocity difference from carbonate rock, various types of seismic facies and complex spatial distribution, seismic prediction is difficult for effusive rock. In this study, a seismic facies combination identification model and pre-stack elastic inversion technology under the guidance of underwater volcanic mechanism model was developed. It effectively improves effusive rock prediction by increasing the prediction coincidence rate up to 86%. This technology provides a powerful technical support for distribution prediction, optimization of well locations and reserve evaluation of pre-salt igneous reservoirs in Brazil.
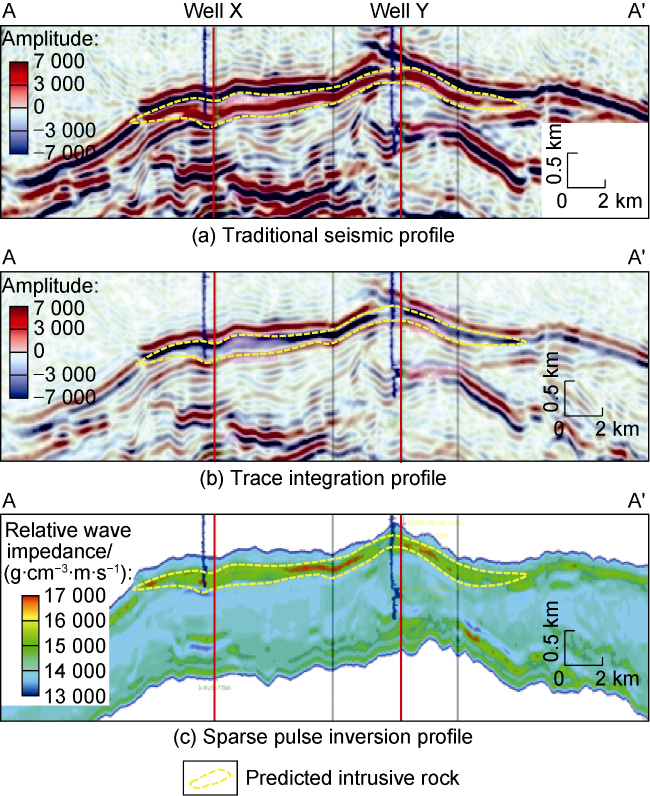
Fig. 7. Seismic prediction of intrusive rock (see the profile location in |
3.4. Hydrocarbon detection
Considering the difficulty of hydrocarbon detection in carbonate reservoirs, a series of hydrocarbon detection technologies for lacustrine carbonates have been integrated based on spectral decomposition, AVO and pre-stack dual parameters inversion. (1) Hydrocarbon detection based on spectral decomposition. Research on fluid substitution and forward modeling in carbonate reservoirs with different fluids and saturations has revealed that with the increase of oil saturation, the reflection amplitude at the top of the oil layer would be enhanced. Well-seismic analysis has shown that the top of the oil layer is characterized by strong amplitude and a large attenuation gradient. The hydrocarbon-rich reservoir follows a dynamic principle of “low-frequency resonance and high-frequency attenuation”. After analyzing and comparing the seismic amplitudes of different frequency components by spectral decomposition to optimize the dominant frequency component for seismic hydrocarbon detection (Fig. 8 ), this study has demonstrated that the hydrocarbon responses of high-frequency and low-frequency components are stronger in the hydrocarbon-bearing zone [24,29]. (2) Hydrocarbon detection based on AVO gradient. The AVO characteristics of different fluids in carbonate reservoirs are similar, making it challenging to differentiate between them. Exploring and analyzing the AVO attribute of oil-bearing and water-bearing reservoirs reveals that the gradients of different fluids are similar, but the absolute AVO intercept is greater when the reservoir contains oil. Through fluid substitution and forward modeling analysis of well data, a fluid identification chart based on absolute AVO intercept is established. The intercept sensitive to oil layers is used for hydrocarbon detection in carbonate reservoirs [30]. (3) Hydrocarbon detection based on pre-stack elastic dual parameters. This method involves the analysis of petrophysics and seismic forward modeling to optimize the P-wave impedance and density which can identify different fluids in carbonate reservoirs. In this study, a dual-parameters fluid identification chart was established, and pre-stack P-wave impedance and density dual-parameters inversion was effectively used for hydrocarbon detection. The prediction accuracy of this method can be 85%. (4) To overcome the difficulty of seismic identification of supercritical CO2 fluid in carbonate reservoirs, pre-stack and post-stack seismic prediction technologies for supercritical CO2 fluid have been developed. Research on pre-stack frequency dispersion AVO gradient attributes has shown that the CO2 gradient of pre-stack frequency dispersion AVO is larger, while the oil and water gradient of pre-stack frequency dispersion AVO is relatively small. By considering peak frequency and absorption attenuation, this technology can qualitatively predict the reservoir fluids in different structural parts. It has been successfully used to predict the CO2 caps and oil rims in the central part of the Libra block and the Peroba block in Brazil, as well as the CO2 content in the Aram block. It provides important technical supports for target evaluation, well deployment, and exploration strategy [31].
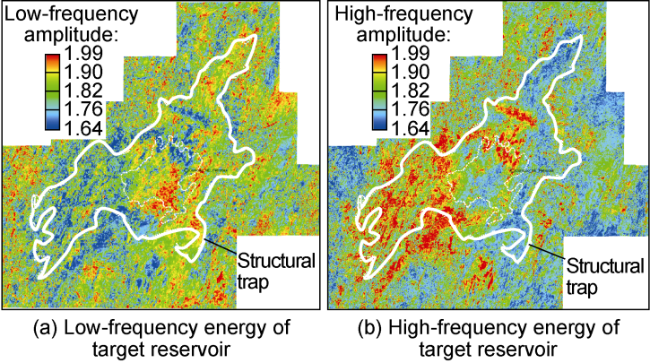
Fig. 8. Hydrocarbon detection based on spectral decomposition in Aram block. |
3.5. Complex lithology and fluid logging identification
In view of the complex lithology of carbonate rock, intrusive rock and effusive rock in Brazil, and the difficulty of logging identification, a complex lithology identification technology for lacustrine carbonate rock has been developed based on "conventional logging data+ element capture logging data + artificial intelligence" through calibrating logging, whole core, sidewall core, thinsection data in three steps: (1) Classify carbonate rock and igneous rock by element capture logging data; (2) Identify basalt and diabase in igneous rock by element capture logging data and gamma spectrometry logging data [38-39], and identify igneous rock by crossplot and new lithology index parameters; (3) Select the sensitive lithology curve to identify carbonate rock in different intervals through intelligent fuzzy clustering identification. The coincidence rate of identifying igneous rock and carbonate rock is up to 95%, the coincidence rate of identifying basalt and diabase in igneous rock is up to 86%, and the coincidence rate of identifying lithology in carbonate rock is up to 70%. This technology lays a solid foundation for logging evaluation of pre-salt carbonate reservoirs and investigating igneous rock in Brazil.
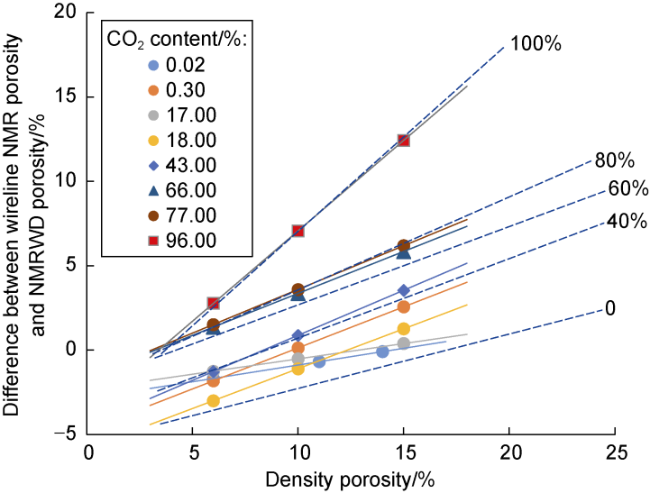
The coexistence of different fluids (i.e., oil, gas, water and CO2) in the pre-salt carbonate reservoirs makes it difficult for logging identification. Therefore, a semi- quantitative evaluation and fluid identification technology for supercritical CO2 was developed based on conventional logging data, NMR while drilling data (NMRWD), wireline NMR logging data and formation test data. It makes full use of the physical properties of CO2 without hydrogen atoms and its density in supercritical state is comparable to that of oil [40]. A semi-quantitative CO2 identification chart was established by drawing a neutron-density crossplot and analyzing the difference between total wireline NMR porosity and total NMRWD porosity. First the semi-quantitative CO2 evaluation limits were set to be 0, 40%, 60%, 80%, 100% (the blue dotted line in Fig. 9 ). Then the fluid type was further evaluated by CO2 content [41]. Based on the above techniques, this paper carried out a semi-quantitative evaluation of CO2 and fluid type identification based on 15 wells and 42 intervals in the Santos Basin. Comparing the identified results with the measured data, it was found that the coincidence rates of semi-quantitative evaluation of CO2 and fluid identification reached 73% and 80% by using the neutron-density crossplot. This technique provides a new method for logging fluid identification, especially for supercritical CO2 identification and evaluation of pre-salt carbonate reservoirs in the Santos Basin, Brazil.
Fig. 9. Semi-quantitative identification of supercritical CO2 fluid in the Santos Basin. |
4. Conclusions
This paper puts forward a new insight into the structural pattern of "two uplifts and three depressions" in the Santos Basin and a new understanding of the Aram-Uirapuru uplift, and clarifies that the lacustrine shale of the Picarras Formation and the Itapema Formation developed during the rift period are primary pre-salt source rocks in the Basin. It is pointed out that four types of paleogeomorphology, namely monoclinal fault block, fault uplift, fault horst and volcanic high, control the scale and quality of three kinds of favorable carbonate reservoirs (coquina, spherulite and stromatolite); the continuous and thick salt interval dominates hydrocarbon formation and preservation, and the Lula-Sugar uplift and the Aram-Uirapuru uplift adjacent to the primary hydrocarbon source kitchen in the central depression provide space for hydrocarbon accumulation. The first exploration well in the Aram Block, Well Curaçao-1, strongly confirmed the new understanding of oil and gas geology.
Several key exploration technologies were developed and applied in the Aram block, which are variable-velocity mapping for layer-controlled facies-controlled pre-salt structures, prediction of lacustrine carbonate reservoirs, prediction of intrusive/effusive rock distribution, hydrocarbon detection in lacustrine carbonates, and logging identification of supercritical CO2 fluid. These technologies provide powerful technical supports for optimization of exploration targets, demonstration of the first exploration well and significant oil discovery in the Aram Block.
After more than 10 years of continuous research, PetroChina has made an important breakthrough in pre-salt oil and gas exploration in the Santos Basin, improved the theoretical understanding of pre-salt lacustrine carbonate reservoirs and developed a series of special technologies for oil and gas exploration. These achievements have greatly enhanced the core competitiveness of PetroChina in deep-water oil and gas exploration in Brazil and provided powerful decisive and technical supports for the great-leap-forward development of China overseas and offshore oil and gas business.
Nomenclature
HI—hydrogen index, mg/g;
Ro—vitrinite reflectance, %;
S1—free hydrocarbon content in rock, mg/g;
S2—pyrolytic hydrocarbon content in rock, mg/g;
TOC—total organic carbon content, %.