

Introduction
Shale oil is usually defined as an oil resource enriched in organic-rich shale formations [1-2]. At present, shale oil is mainly developed by horizontal wells and volume fracturing. Due to the relatively developed micro- and nano-pore throats in shale reservoirs, it is difficult to replenish energy by conventional water injection, which resulting in a rapid decline of shale oil production in the early stage. It is urgent to explore advanced development methods because large amounts of crude oil in the matrix have not been effectively produced [3-4].
Previous studies have demonstrated that gas injection (CO2, N2, and air) can effectively improve the development of shale oil [5-6]. Especially, air has attracted much attention due to its low cost, abundant source, and low temperature oxidation (LTO) [7]. Many scholars have carried out a series of studies on the oxidation mechanism and oxidation model of crude oil in air/oxygen-reducing air flooding [8-9], applicable types of reservoirs, and the characteristics of oxidation kinetics in the whole temperature domain [10⇓⇓-13]. However, the above studies mostly adopted conventional displacement devices or static oxidation tubes. Due to the tight lithology of shale, conventional experimental studies are greatly affected by experimental conditions and human operation, which easily cause large measurement errors. Some scholars have car-ried out basic research on shale oil production mechanisms by numerical simulation and microfluidic systems[14⇓⇓-17]. In general, the current researches mainly focused on the static oxidation mechanism of crude oil and the optimization of injection parameters. Few scholars studied the mechanism and influencing factors of air flooding from fluid production in shale pore throats and swept area. In particular, there is a lack of visualization and quantitative study on the fluid production characteristics and displacement mechanism in the process of air flooding. In this paper, an online physical simulation experiment method for enhancing shale oil recovery by air injection was established by combining high-temperature and high-pressure CT scanning and NMR (nuclear magnetic resonance) online physical simulation experiment system. Through real-time monitoring of the distribution of oil saturation and the process of crude oil production, the mechanism of air flooding shale oil was explored. Additionally, the effects of air oxygen content, pressure, permeability and fracture development degree on EOR (enhanced oil recovery) were studied.
1. On-line physical simulation experiment method for enhanced shale oil recovery by air injection
The conventional physical simulation experiment device can only measure the fluid at the inlet and outlet ends, and the oil displacement effect is evaluated by collecting data at both ends of the core holder. However, the fluid flowing process inside the core is a “black box” with unclear understanding about fluid production characteristics, and as a result, there are some issues in the in-depth analysis of fluid saturation distribution and migration mechanism in rock. In this paper, the oil displacement process and production of pore throats by air flooding in shale cores were studied by high-temperature and high-pressure CT scanning and NMR large-scale online physical simulation experiment system.
Through the on-line CT scanning experiment of air injection flooding, the distribution of fluid saturation in the core and the swept area of the displacement front at different times can be obtained, and the visual comparison of swept area of the fluid can be realized, thereby the macroscopic mechanism of air injection in shale oil to enhance oil recovery can be clarified. However, CT scanning experiments cannot quantitatively analyze the fluid production of different pore throats in the core. With the help of on-line NMR experimental platform for air flooding oil, the amplitude variation characteristics of the NMR T2 spectrum signal under different injection volumes were compared. The quantitative data of crude oil production and the position of remaining oil in different pores can be obtained, which can quantitatively analyze the fluid migration law in the pore throats during air flooding shale oil and the influencing factors of EOR. Moreover, through the online physical simulation experiment of air flooding, the core is placed in the holder during the experiment, that is, the whole experiment is carried out under the condition of a completely closed core, which can avoid the test error caused by the change of stress and placement position when the core is taken out.
1.1. On-line CT scanning experimental method for air flooding shale oil
When using CT scanning technology, due to the different substances corresponding to different CT values, different fluid saturations in the core can be identified. The calculation formula of core oil saturation is as follows:
${{S}_{\text{o}}}=\frac{C{{T}_{\text{dry}}}-C{{T}_{\text{x}}}}{C{{T}_{\text{wet}}}-C{{T}_{\text{dry}}}}\frac{C{{T}_{\text{water}}}-C{{T}_{\text{air}}}}{C{{T}_{\text{water}}}-C{{T}_{\text{oil}}}}\times \text{100 }\%$
In this paper, the core displacement experiment was carried out using a self-developed online CT scanning system (Fig. 1 ). The scanning equipment is a LIGHTSPEED 8-slice spiral CT scanner developed by General Electric Company of the United States, with the maximum transmission power per tube of 53.2 kW. The CT image analysis software (CCTAS) developed by PetroChina Research Institute of Petroleum Exploration & Development was used for data processing. Also, a special core holder with a shell made of polyether ether ketone (PEEK) material was used to hold the core position. The X-rays could penetrate the core and reduce the scanning error caused by the ray hardening effect, and the on-line CT scanning for air flooding process can be carried out. The QUZIE5200 pump was used as the injection pump, and the ISCO pump was used to accurately control the confining pressure.
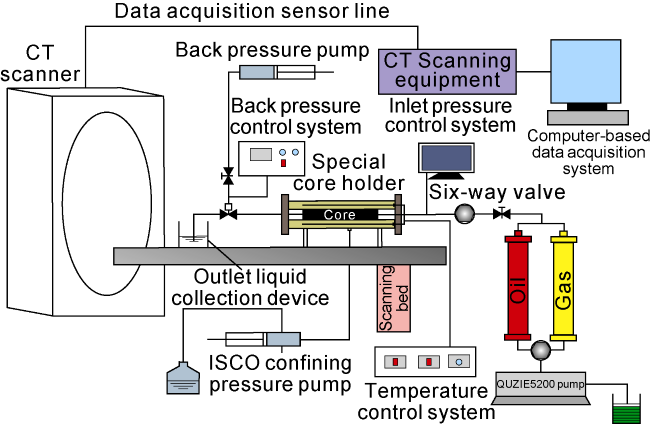
Fig. 1. Schematic diagram of on-line CT scanning experimental system for air flooding shale oil. |
Three shale samples were parallelly taken from the Permian Lucaogou Formation in the Jimsar Sag, Junggar Basin, and used to carry out on-line CT scanning experiment on air flooding shale oil. The development effects of shale oil by starting injecting air at different depletion pressures (28, 21, 13 MPa) were simulated. The basic physical parameters of the cores are shown in Table 1 .
Table 1. Physical parameters of samples for air flooding online CT scanning experiment |
| Core No. | Diameter/ cm | Length/ cm | Porosity/ % | Permeability/ 10-3 μm2 | Injection point |
|---|---|---|---|---|---|
| J1 | 2.493 | 7.107 | 16.4 | 0.019 | Injecting air at 28 MPa |
| J2 | 2.506 | 7.312 | 10.1 | 0.021 | Injecting air at 21 MPa |
| J3 | 2.498 | 7.127 | 11.6 | 0.020 | Injecting air at 13 MPa |
The experimental steps are as follows: (1) Dry scanning. The oil and salt in the core were washed out with organic solvent, and the core was dried. The dry core was scanned after setting the scanning parameters as tube voltage of 120 kV and tube current of 130 mA. (2) Wet scanning. The simulated oil with a viscosity of 10.4 mPa·s under formation conditions was prepared by using crude oil and white oil in the study area, and the simulated oil was used as experimental oil. The experimental temperature was raised to 85 °C, and the shale core was vacuumed, saturated with oil and aged. The core saturated with oil (wet core) was scanned at the parameters used for dry scanning. (3) Simulation to depletion development. The depletion development was carried out by setting the back pressure to 28 MPa, recording the oil production, and calculating the recovery degree in the depletion stage. (4) Gas flooding simulation. After depletion development, gas flooding was carried out by injecting air into the core samples with a high-pressure displacement pump. An on-line CT scanning test was conducted on the core every 5 min, and relevant experimental data were recorded. The experiment ended when oil was no longer produced. (5) CT image processing. Imported the CT scan image into the CCTAS software, selected regional parameters, and obtained the saturation image of the whole process of air flooding. (6) Steps (1)-(5) were repeated on two other core samples by setting the depletion pressure at 21 MPa and 13 MPa, respectively.
1.2. On-line NMR experimental method for air flooding shale oil
It has been proved mathematically that the attenuation curve related to pore size is a single exponential function, and the attenuation coefficient is positively correlated with pore size. The molecular surface force of the fluid in a large pore is small, and the T2 value is large. Conversely, the molecular surface force of the fluid in a small pore is large, and the T2 value is small. That is, the T2 value can represent the proportion of pores with different sizes to the total pores [18-19]. The relationship between pore size and T2 value can be expressed as Eq. (2). In addition, a large number of scholars have proved that the pore throat distribution measured by mercury intrusion experiment has a good correlation with the pore throat distribution measured by NMR. Therefore in this study, the conversion coefficient (C) in Eq. (2) was determined based on the experimental results of high-pressure mercury injection on shale samples. First, a small sample was cut from the experimental core to carry out the high-pressure mercury injection experiment. The experimental results (Fig. 2a ) show that the pore throat radius of shale reservoirs in this area presents a typical bimodal distribution, which can be divided into four orders of magnitude: nanopores, sub-micropores, micropores, mesopores and macropores. The pore throat radius is mainly distributed in 0.01-10.00 μm, and a large number of nano-scale pore throats are developed. The main contribution to permeability is from sub-micropores and micropores, and the pore throat radius is concentrated at 0.15-1.75 μm. In addition, the shale samples saturated with crude oil were tested by NMR, and the conversion coefficient was calculated to be 0.02 μm/ms. Thus, the NMR pore size conversion results shown in Fig. 2b can be obtained.
$r=C{{T}_{2}}$
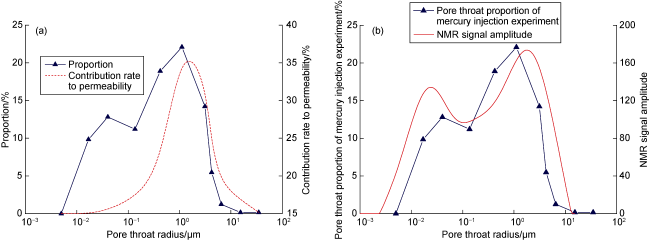
Fig. 2. (a) Experimental results of high-pressure mercury intrusion on shale samples and (b) NMR pore size conversion result. |
The on-line NMR experimental system for shale oil by air flooding was developed by combining the high-temperature and high-pressure core displacement physical simulation system and NMR technology (Fig. 3 ). The system mainly consisted of three parts: (1) A constant- temperature oil bath heating cycle control system. The experimental temperature is controlled by circulating fluorine oil around the core holder, and the experimental temperature and pressure could reach 90 °C and 50 MPa, respectively by special core holder and bath temperature sensor. (2) Fluid displacement physical simulation system, which consists of constant-speed constant-pressure pump, core device, gas-liquid separation device, etc. (3) On-line NMR experimental system, MacroMR12, with resonance frequency of 12.798 MHz, magnet strength of 0.3 T. The shortest echo time of the device is 0.1 ms, which could capture the fluid signals of the nano-scale pore throats in shale samples, and can accurately observe the change of fluid signal in the core pore throats at different displacement times. Before each experiment, the parameters of the NMR T2 spectrum are adjusted, and central frequency calibration, electronic shimming, and hard pulse amplitude adjustment are carried out according to the specific samples.

Fig. 3. Schematic diagram of on-line NMR scanning experimental system for air flooding shale oil. |
Ten shale samples of the Lucaogou Formation in Jimsar Sag were selected to carry out on-line NMR experiments on air flooding shale oil, and the influencing factors on air flooding were analyzed. The basic physical parameters of the cores are shown in Table 2 .
Table 2. Physical parameters of online NMR experiment for air flooding shale oil |
| Core No. | Diameter/ cm | Length/ cm | Porosity/% | Permeability/ 10-3 μm2 | Oxygen content of injected air/% | Injection pressure/MPa | Core type |
|---|---|---|---|---|---|---|---|
| J4 | 2.487 | 7.127 | 14.3 | 0.315 | 5 | 36 | matrix |
| J5 | 2.507 | 6.915 | 14.1 | 0.301 | 8 | 36 | matrix |
| J6 | 2.496 | 6.843 | 14.2 | 0.315 | 21 | 36 | matrix |
| J7 | 2.503 | 6.637 | 15.8 | 0.074 | 21 | 36 | matrix |
| J8 | 2.493 | 6.581 | 16.6 | 0.919 | 21 | 36 | matrix |
| J9 | 2.493 | 6.782 | 17.1 | 0.331 | 21 | 34 | matrix |
| J10 | 2.487 | 6.825 | 17.2 | 0.312 | 21 | 36 | matrix |
| J11 | 2.501 | 6.791 | 17.2 | 0.311 | 21 | 38 | matrix |
| J12 | 2.496 | 6.377 | 14.1 | 0.307 | 21 | 36 | matrix |
| J13 | 2.507 | 6.829 | 16.4 | 0.794 | 21 | 36 | fractured |
The experimental steps are as follows: (1) The air tightness of the experimental system was checked. The system pressure was maintained at 37 MPa, and the pressure change within 24 h was less than 5%. The oil and salt in the core were washed out via organic solvent extraction, the cores were dried and weighed, and the T2 spectrum curve of original dry core was tested. (2) The experimental temperature was raised to 85 °C, and the core was vacuumed, saturated with oil and aged. (3) The core saturated with oil was put in the holder, the T2 spectrum curve of core saturated oil was tested, and the saturated oil volume and porosity were calculated using the gravimetric method and NMR method. (4) The air was injected into the core by a high-pressure pump, and then NMR tests were performed at different injection volumes (0.2, 0.4, 0.6, 0.8, 1.0, 1.2 PV (multiples of pore volume)) under constant temperature and pressure. The gas and oil samples were collected at the outlet for chromatographic analysis. The experiment ended when the NMR spectrum did not change. (5) Steps (1)-(4) were repeated on the different core samples, and the effects of oxygen content, permeability and fractures on air flooding oil were analyzed. (6) Steps (1)-(3) were repeated on the different core samples. The gas injection pressure was changed to 34, 36, 38 MPa, and the NMR tests were carried out at different displacement times (2, 4, 6, 8, 10, 12 h), respectively. Then the influence of gas injection pressure on air flooding was analyzed. The standard sample was used to correct the NMR signal for each scan test, which ensures that the experimental results are comparable.
2. Mechanism of EOR by air injection in shale oil
2.1. Development effect of shale oil by air flooding under different depletion pressures

Fig. 4. CT images after air flooding at different depletion pressures. |
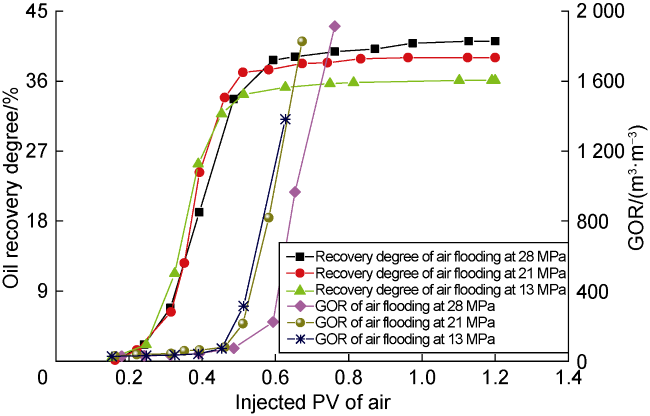
Fig. 5. Recovery degree curves of air flooding at different depletion pressures. |
The variation characteristics of oil saturation at different positions of the core sample during air flooding were further analyzed by taking the gas flooding after depletion to 21 MPa as an example. The CT values at different times were obtained by CT scanning, and the distribution of oil saturation at the corresponding stages was calculated as shown in Fig. 6 . It can be observed that the oil saturation in the swept area of the gas flooding front was significantly decreased, and an oil front appeared in the sweeping zone, moving to the outlet end, like a piston pushing. Additionally, it can be seen that the oil saturation in the inlet and middle of the core sample decreased obviously, and the crude oil in these areas was swept thoroughly by the gas phase, while there was a considerable amount of crude oil “accumulation” at the outlet end. It can be concluded that the gas phase is a non-wetting phase in the core. Under the action of pressure difference, the gas can not only enter the main seepage channel, but also occupy the micro-pore space where oil is difficult to produce. As a result, the residual oil after depletion development is forced to “start-up” and move to the outlet end. The residual oil in different zones of the core can be “coalescent” to form an “enrichment block” during the migration process, which is pushed by the injected gas to the outlet end, resulting in higher oil saturation near the outlet end. At the end of the experiment, some oil flowed out when the pressure was released. When the core holder was opened, the oil saturation at the core outlet was higher than that at the inlet, which could prove the above phenomenon.
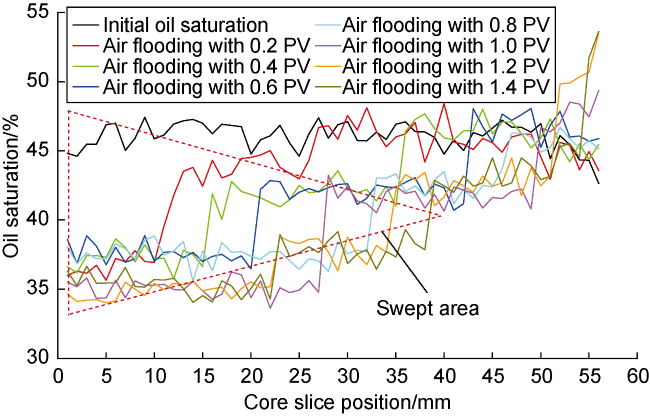
Fig. 6. Distribution of oil saturation after air flooding when depleting to 21 MPa. |
After the end of gas flooding, according to the CT value, the remaining oil saturation at 28, 21, 13 MPa is 40.3%, 41.6%, and 43.3% respectively, which are close to the experimental results of oil saturation based on the measurement data of oil and gas output at the outlet. The error between them is within 1%, indicating that it is feasible to evaluate the variation characteristics of core oil saturation via the on-line CT scanning experiment method.
2.2. Microscopic production characteristics in different sizes of pores by air flooding
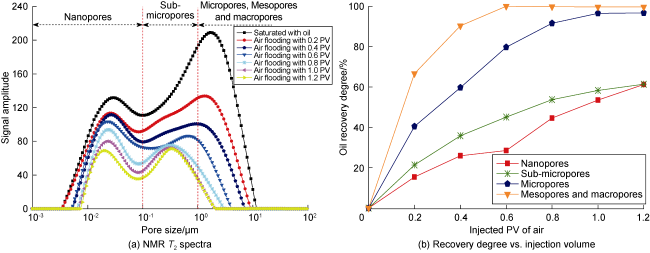
Fig. 7. NMR T2 spectra of core J6 and relation of recovery degree and injected volume for pores with different sizes. |
2.3. Mechanism of air flooding shale oil
Based on the differences in air flooding sweeping mode and production characteristics of shale oil, the core can be divided into reaction trailing edge area, reaction front edge area, and unswept area. Among them, the reaction front edge area can be driven by pressure difference and dissolution. The main flooding mechanism of differential pressure is that high-pressure air enters the matrix pore throats under pressure and displaces the crude oil by differential pressure. The main oil displacement mechanism of dissolution is LTO reaction between oxygen in the air injected and crude oil. The CO, CO2, ether, aldehyde and ketone produced by the reaction can expand the volume of crude oil, reduce the viscosity and enhance the fluidity. Meanwhile, the mass exchange between oil and gas makes the reaction products further dissolve into the crude oil, which can effectively supplement the formation energy. With the decrease of depletion pressure, the gas dissolved in the crude oil separates and forms dissolved gas flooding. Moreover, the light components evaporated from the oil, together with the CO and CO2 etc. can play a role similar to flue gas flooding. The flue gas continuously extracts the low-carbon components in the crude oil, which makes the injected gas continuously enriched and close to the properties of the oil. Meanwhile, the crude oil produces a slow component mass transfer under the action of extraction, and gradually depletes and closes to the properties of the injected gas. As a result, the interfacial tension of oil and gas decreases, and the injected gas, light and medium hydrocarbon gas, and crude oil act as nearly miscible or partially thermal miscible flooding under high temperature and high pressure. Therefore, under various oil recovery mechanisms, during air flooding, LTO reaction induces a high-temperature displacement front which is similar to the bulldozing effect proposed by Gutierrez et al. [20]. This high-temperature displacement front pushes crude oil forward, like a bulldozer, which can greatly improve the oil recovery. Jiang et al. [21-22] proposed that the EOR by air flooding is the collaboration of N2 flooding, flue gas flooding, LTO reaction and heating expansion via numerical simulation and experimental demonstration. The heat generated by the LTO reaction can accelerate carbon bond stripping effect and induce fire flooding, which has good miscible, gasification/distillation volatilization effects. In this case, thermal flooding, steam flooding, miscible flooding, and gas flooding are main mechanisms of EOR.
Notably, it is extremely important to select the appropriate injection and production timing for shale oil by air flooding. When the depletion pressure is low, the reservoir energy cannot be replenished in time, so that the pressure in pores and fractures decreases rapidly, which easily leads to a sharp increase in effective stress. The reservoir will elastically deform, resulting in a decrease in the cementation degree among the micro- and nano-scale mineral particles. These mineral particles may slip under pressure, and their contact mode and arrangement will change. Meanwhile, nano-micron pore throats will be easily filled, which will result in a decrease in reservoir seepage capacity and poor air injection effect. In shale reservoirs, in addition to primary intergranular pores, there are also complex low permeability channels such as cement micropores and intragranular pores that haven’t undergone strong compaction. CT images show that micropores and microfractures are easy to close under high stress, indicating that the micro-and nano-pores in shale are difficult to support overlying pressure when the effective stress increases. Even a small pressure change will lead to a significant change in the extremely small seepage channels in shale reservoirs. If injecting air at this time, it is easy to cause stress sensitivity and make air injection effect worse.
3. Influencing factors on EOR by air flooding
The NMR T2 spectra of different air flooding states were obtained by on-line NMR experiments. The recovery was calculated according to the area change of the NMR T2 spectra before and after flooding, as shown in Eq. (3). In this paper, the effects of air oxygen content, core permeability, injection pressure and fractures on the development effect of shale oil by air flooding and the oil recovery from pores with different sizes are analyzed. The relevant calculation results are shown in Table 3 .
$E=\frac{S1-S2}{S1}\times 100\text{ }\!\!%\!\!\text{ }$
Table 3. On-line NMR experimental results under different influencing factors |
| Influencing factor | Core number | Recovery factor/% | The proportions of oil recovered from pores of different sizes to the total oil recovered/% | |||
|---|---|---|---|---|---|---|
| Nanopores | Sub-micropores | Micropores | Mesopores and macropores | |||
| Air oxygen content | J4 | 41.62 | 24.8 | 27.1 | 36.4 | 11.7 |
| J5 | 43.57 | 25.9 | 30.5 | 38.9 | 4.7 | |
| J6 | 45.71 | 27.4 | 31.4 | 38.2 | 3.0 | |
| Core permeability | J7 | 17.81 | 8.2 | 19.8 | 28.9 | 43.1 |
| J8 | 46.37 | 33.6 | 31.1 | 32.5 | 2.8 | |
| Injection pressure | J9 | 37.66 | 33.6 | 45.2 | 2.3 | 18.9 |
| J10 | 43.81 | 41.2 | 49.8 | 6.7 | 2.3 | |
| J11 | 39.46 | 71.0 | 20.0 | 7.7 | 1.3 | |
| Core fractures | J12 | 34.54 | 43.1 | 32.2 | 14.8 | 9.9 |
| J13 | 57.94 | 18.9 | 34.3 | 42.7 | 4.1 | |
3.1. Air oxygen content
Air oxygen content is an important factor affecting the development effect of shale oil by air flooding. Fig. 8 shows the NMR T2 spectra of air flooding at different oxygen contents. It’s found that as the oxygen content in the air increases from 5% to 21%, the recovery factor increases from 41.62% to 45.71%, indicating that the increase of oxygen content is favorable for improving oil recovery. Oil produced from nanopores increases from 24.8% to 27.4%, that from sub-micropores increases from 27.1% to 31.4%, and that from micropores increases from 36.4% to 38.2%, but oil from mesopores and macropores decreases from 11.7% to 3.0%. It can be found that the small number of mesopores and macropores in shale cores leads to less oil and less contribution to total recovery factor. In comparison, the amount of crude oil in nanopores, micropores, and sub-micropores is large and the production characteristic is more obvious, indicating that the total oil production of air flooding mainly comes from nanopores, sub-micropores, and micropores, and the oil recovery from the three kinds of pores increases with the increase of air oxygen content.
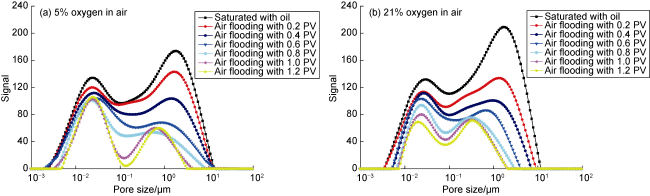
Fig. 8. NMR T2 spectra of air flooding at different air oxygen contents. |
From the above results, it can be concluded that when the oxygen content is low (5%), the air composition is mainly N2, and the injected air plays a role similar to N2 flooding. N2 molecules are small and can evenly enter mesopores and macropores, playing a role in increasing pore pressure and supplementing formation energy. When the reservoir pressure decreases, the gas dissolved in crude oil can be released, and dissolved gas flooding can occur under the action of elastic energy and pressure difference. Then, the crude oil in large pore throats can be displaced and the recovery degree increases, but the production effect on the crude oil in micro- and nano-pores is poor. When the oxygen content is high (21%), with the increase of air injection, LTO reaction between air and crude oil in micro- and nano-pores is mainly oxygen addition reaction and decomposition reaction. From the above mechanism analysis of EOR by air flooding, CO2 and aldehydes produced by LTO reaction at high oxygen content plays a good role in viscosity reduction by expansion for crude oil in micro- and nano-pore (Fig. 9a ). The resulting flue gas flooding can further enhance the recovery degree from micro- and nano-pores. This is consistent with the LOT model proposed by Ren et al. [23] after experimental demonstration of the LTO process of crude oil in the core. Meanwhile, as the viscosity decreases, light and medium components in the crude oil and flue gas can form a supercritical and miscible front zone under the action of thermal expansion and gasification/distillation, to significantly enhance oil recovery by “thermally miscible flooding”. It is worth noting that the high oxygen content produced higher oxygen pressure in the experiment, which promoted LTO reaction, as a result, the temperature in the core holder increased by about 2-3 °C, measured at the oil-gas contact front. This proves that the thermal effect produced by LTO reaction can increase reservoir temperature. Limited by short contact time between crude oil and gas in the core under experimental conditions, the LOT effect is not sufficient, therefore the oxygen content of the air injected can be increased in the field within the safety range to enhance oil recovery. Of course, at this point, the residual amount of oxygen after reacting with crude oil becomes larger, and the probability of oxygen concentration in production wells may be risky if exceeding the explosion limit, so an appropriate air oxygen content should be selected.
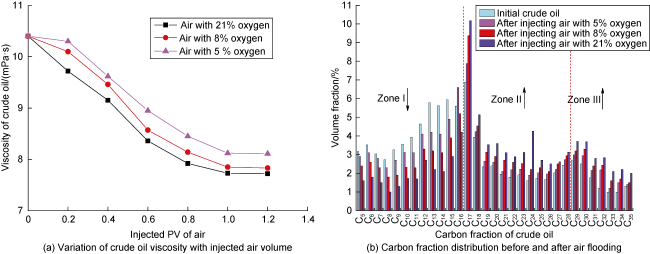
Fig. 9. Variation of crude oil viscosity with injected volume of air, and the distribution of carbon fraction in crude oil after air flooding at different oxygen contents. |
The chromatographic analysis of produced oil at different oxygen content during air flooding is shown in Fig. 9b . The composition of crude oil after air flooding showed a trend of decrease in zone I (light component C5-C16 in crude oil), an increase in zone II (heavy component C17-C28 in crude oil), and a slight increase in zone III (C29-C35). The higher the oxygen content, the more sufficient the LTO reaction is, and the more obvious the trend of each zone. This is because the expansion and extraction of dissolved gas in oil can extract the light components in crude oil into the gas phase, and some light components are converted to heavy components. The more sufficient the LTO reaction, the smaller the proportion of light components in crude oil is. Meanwhile, the thermal effect produced by LTO reaction also causes the light components in the oil to evaporate, the proportion of medium and heavy components increases, and the density of the crude oil gradually increases. The medium and heavy components have larger relative molecular mass, more branched chains, and more complex spatial three- dimensional structures which can play a role in blocking the dominant channels in the core, and slow down the phenomenon of fingering and channeling [12,23 -24].
3.2. Core permeability
In general, the evaluation index of physical properties of high-permeability core is high, and the air has good seepage characteristics in the core during gas flooding development. When the core permeability is low, the injection-production pressure difference is difficult to be effectively established and transmitted to the outlet end, which will cause high injection pressure at the inlet. Fig. 10a and Fig. 10b are NMR T2 spectra after air flooding of shale samples with different permeabilities. Compared with the low-permeability core (0.074×10⁻³ μm2), the high-permeability core (0.919×10⁻³ μm2) has more large- scale pore throats and higher initial oil content. The NMR signal values of nanopores, sub-micropores, micropores, mesopores, and macropores decreased significantly. Combined with Fig. 10c and Table 3 , it can be seen that the recovery degrees of pores with different sizes in high permeability core are 33.6%, 31.1%, 32.5% and 2.8% respectively, which are significantly higher than those in the low permeability core. The final recovery factors of the low-permeability core and the high-permeability core is 17.81% and 46.37% respectively. This means that high permeability means strong fluid flow ability and better pore throat connectivity. Not only the crude oil in large-scale pore throats can be produced, but also the oil from nano-scale pore throats can be produced to a higher degree. In addition, the T2 spectral signals in the 0.01-0.05 μm pores of the low-permeability core increases slightly and then decreases during the gas flooding, which is caused by the tight lithology of the low-permeability core. Some crude oil is carried by air and transferred to smaller pores during air flooding, which makes the residual oil redistributed. In the later stage, with the increase of gas injection, the air is an excess phase relative to crude oil, which leads to the change of physical properties of the crude oil in micropores, so the oil is produced under the action of air displacement.

Fig. 10. NMR T2 spectra of cores with different permeabilities and recovery degree from different sizes of pores during air flooding. |
It is notable that during the gas flooding, air first sweeps the oil in high-permeability zone of the low-permeability core, and the oil content in high-permeability zone decreases significantly. However, due to the poor pore throat connectivity, there is a “bypass effect” in the low-permeability zone, so the oil production is poor [25]. Gas is easy to enter the high-permeability dominant channels during gas flooding in low-permeability cores, resulting in the rapid breakthrough of displacement pressure and gas channeling, and leaving oil in some non-dominant channels. This is reflected by relatively low oil production from nanopores and sub-micropores and high oil production from mesopores and macropores in the low-permeability core. In field application, if the reservoir seepage capacity can be improved by fracturing before gas injection, the shale oil recovery will be greatly improved.
3.3. Injection pressure
The injection pressure is a key factor influencing air injection development of shale oil. Injection pressure mainly affects the stability of the oil-gas front interface and thereby affects the microscopic pore-throat swept area of the core. Al-Mudhafar et al. [26] reported that the injection pressure has an important influence on the recovery factor. When the injection pressure is greater than the critical injection pressure, the stability of the flooding front is poor, which is mainly manifested as unstable flooding and low recovery. When the injection pressure is less than the critical injection pressure, high recovery and stable flooding are obtained. As shown in Fig. 11a , with the increase of flooding time, the T2 spectra gradually moves down, indicating that crude oil is effectively produced under a certain pressure difference. When the injection pressure is 36 MPa, the crude oil from the pores of 0.05-10.00 μm is mainly produced. When the injection pressure increases to 38 MPa, the crude oil in pores of 0.01-10.00 μm can be produced. When the injection pressure decreases to 34 MPa, the crude oil in pores of 0.08-10.00 μm is producible. In general, the T2 spectrum moves left and the signal amplitude moves down with the increase of injection pressure. This shows that when the injection pressure increases, the lower limit of oil production of pore throats decreases from 0.08 μm corresponding to 34 MPa to 0.01 μm corresponding to 38 MPa. It can be concluded that the interfacial tension between air and crude oil decreases continuously under higher injection pressure, and the resistance of air entering small pore throat decreases, thereby the crude oil in small pore throats can be effectively produced [27-28].
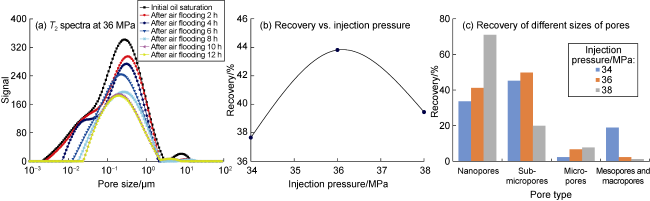
Fig. 11. NMR T2 spectra after air flooding at 36 MPa and recovery at different injection pressures. |
According to the principle of NMR, the occurrence of pore fluid is positively correlated with the signal amplitude, the corresponding signal amplitude will decrease when the occurrence of crude oil in the smallest pore decreases; that is, the pore size is the lower limit of pore throat production. In porous media, fluid flow with Reynolds number between 1×10⁻⁶ and 0.2 is Darcy flow; when the Reynolds number is higher than 0.2, it is high-speed nonlinear flow; when the Reynolds number is less than 1×10⁻⁶, it is low-speed nonlinear flow. The crude oil viscosity of the shale reservoir in the study area is 10.41 mPa·s, and the crude oil density is 0.886 g/cm3. Combined with the daily liquid production per well, fluid flow in the shale matrix is mostly low-speed nonlinear flow. The lower limit of pore throat production corresponding to this flow regime is about 0.01 μm, which is close to the result calibrated by the on-line NMR experiment. Therefore, the target for air flooding in the study area should focus on the pore throat space with a certain flowing capacity and larger than 0.01 μm.
3.4. Fractures
The indoor experimental results show that the air injection capacity is significantly enhanced when the shale core contains fractures. Combined with digital core images and logging data, it can be found that there are obvious micro-fractures such as small-angle bedding fractures, fracturing fractures, diagenetic shrinkage fractures, structural fractures and slip fractures in shale samples, which are arranged in light and dark layers. The horizontal layer connectivity is better, but the vertical connectivity is poor. Micro-fractures such as bedding fractures provide shale reservoir space, and improve shale permeability. They are effective channels for shale oil to flow out of matrix pores, and greatly improve the efficiency of air displacing crude oil. Fractures have a significant influence on shale oil recovery by air flooding.
Cores J12 and J13 in Table 2 were selected to analyze the effect of fractures on EOR by air injection in shale oil. Core J13 has a microfracture with a width of about 0.1 mm, and permeability of 0.794×10⁻³ μm2, which can represent the fractured core. Core J12 is a matrix core with a permeability of 0.307×10⁻³ μm2. Fig.12 shows the NMR T2 spectra of matrix and fractured cores under different gas injection volumes. It can be seen that the matrix core mainly develops nanopores, with some sub-micropores, and micropores, but the development degree of mesopores and macropores is low. The fractured core not only develops nanopores, sub-micropores, micropores, mesopores and macropores, but also has two T2 spectral peaks at pore sizes greater than 12 μm. The signal amplitude decreases with the air injection volume, which is caused by the change of residual oil saturation in core fractures during air flooding. Therefore, pores with pore size greater than 12 μm are defined as fracture. Compared with the matrix core, the NMR signals of all sizes of pores in the fractured core decreased significantly during air flooding, indicating that the fracture effectively improved the connectivity of the core.
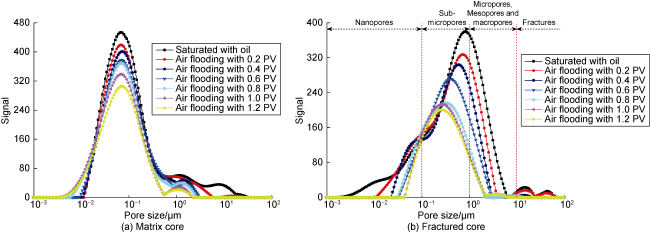
Fig. 12. NMR T2 spectra of matrix core and fractured core after air flooding. |
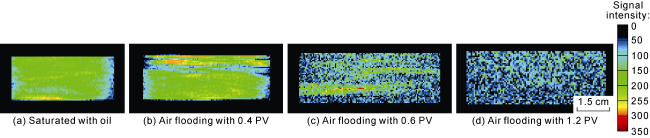
Fig. 13. NMR sagittal images of fractured core under different air injection volumes. |
In essence, when shale fractures are developed, crude oil in the macropores around the fractures can be produced in the early stage of air injection, by the differential pressure that plays a major role. With the increase of air injection volume, the pressure will be transmitted to the matrix, and the air in the macropores and fractures sweeps the small pores, and the dissolution contributes more to oil recovery. The crude oil in the macropores first flows rapidly to the fractures, and then the crude oil in the small pores flows through the large pores to the fractures as the seepage distance and resistance decrease. Consequently, the total recovery increases. In addition, under the indoor experimental conditions, the back pressure corresponding to the injection pressure was established at the outlet of the fractured core, the stable and effective displacement pressure difference can be established inside the core, and the possibility of gas channeling is reduced, thereby improving the oil displacement effect. The ultimate oil recovery factor can be calculated by dividing the difference between the gray value of the NMR image at initial oil saturation and that after air flooding by the gray value of the NMR image at initial oil saturation. The ultimate recovery factor of the matrix core and fractured core is 34.54% and 57.94%, respectively. The fracture can effectively increase the contact area between gas and crude oil and the range of displacement front, reduce the seepage resistance and distance of matrix crude oil, and improve the sweeping coefficient and matrix oil drainage area. In field operation, comprehensive factors should be considered to select gas injection parameters. Under the premise of appropriately increasing the injection pressure, it is necessary to select a reasonable pressure difference to prolong the contact between gas and crude oil and delay gas breakthrough. Meanwhile, the reservoir can be adjusted by combining the anti-channeling system such as air foam, which can decrease the risk of gas channeling and improve the recovery degree.
4. Conclusions
The recovery of shale oil can be greatly improved by injecting air into the depleted shale reservoir, but the oil displacement efficiency and the production degree of different sizes of pore throats vary with injection time.
After injecting air, the remaining oil may accumulate into blocks, and migrate to the outlet with the injected gas. The remaining oil accumulated at the outlet end is the target for further production. Air flooding mainly produces the crude oil in the pore throats with transverse relaxation time of 0.5-500.0 ms, corresponding to the pores of 0.01-10.00 μm. The lower the depletion pressure, the lower the recovery of air flooding after depletion.
When the oxygen content of air is low, N2 flooding plays the leading role. The higher the oxygen content and the stronger the LTO, the more obvious the thermal effect and the viscosity reduction effect, the higher the production degree from pores with different sizes and the higher the shale oil recovery. The higher the permeability and the better the pore throat connectivity, the stronger the fluid flow capacity, and the higher the shale oil recovery. As the injection pressure increases, the lower limit of the production degree of pore throats decreases, but gas channeling may occur to cause a premature breakthrough. As a result, the recovery increases and then decreases. In field operation, it is necessary to select optimal air injection pressure, and try to delay gas breakthrough and avoid gas channeling caused by excessive gas injection pressure. Fractures can effectively increase the contact area between gas and crude oil, promote the mass exchange between matrix and fractures, and increase the air sweep coefficient and matrix oil drainage area by supplying oil to fractures from the matrix, which means that a proper fracturing before air injection is helpful to improve the oil displacement effect.
Nomenclature
C—conversion coefficient, μm/ms;
CTair—CT value of air;
CTdry—CT value of the fault plane in a dry core;
CToil—CT value of oil;
CTwater—CT value of water;
CTwet—CT value of the fault plane in a wet core;
CTx—CT value of core fault plane at one point during flooding;
E—recovery, %;
r—pore throat radius, μm;
So—oil saturation, %;
S1—T2 spectrum area at initial oil saturation state, m2;
S2—T2 spectral area after air flooding, m2;
T2—transverse relaxation time, ms.