

Introduction
The volumetric fracturing technology is a necessary means for the economic development of unconventional oil and gas reservoir [1]. The ultimate goal of volumetric fracturing is to break the reservoir into small pieces and maximize fracture complexity to create a fracture network [2⇓⇓-5]. The transport and placement of proppants within fractures are critical for fracture conductivity and stimulation effect. True triaxial fracturing experiments have revealed that opened branched and bedding fractures contain relatively low amounts of proppants, resulting in poor fracture support [6-7]. The complex shape of fractures makes it challenging to predict the transport law of proppants within the fractures, and the transport behavior of proppants in main and branched fractures is not clarified yet [8-9].
The transparent parallel plate model is the primary tool for investigating the transport law of proppants within fractures. Smooth, straight fracture equipment is commonly used to study conventional sandstone reservoirs [10⇓-12] and analyze the transport of proppants at the microscopic level [13-14]. To facilitate the study of proppant transport in complex fractures, various types of equipment have been developed, such as single-branched fracture equipment [15], multi-branched fracture equipment [16], multi-stage branched fracture equipment [17], main fracture width-changing equipment [18], and main fracture height-changing equipment [19]. Researchers have explored factors such as fluid viscosity and density, proppant density, particle size and concentration, injection rate, branched fracture inclination, variation in fracture width and height, and diversion of branched fractures [20-21], so as to basically understand the influences of these factors on proppant transport in main and branched fractures. However, there is currently limited research on the transport law of proppants under the condition with a number of various branched fractures. Moreover, small-sized proppants have a greater transport capacity and can easily enter micro-fractures [22] to increase the volume of the effective fracture network while maintaining long-term conductivity under high closure pressure [23]. In field applications, it is common to use a combination of large-sized and small-sized proppants to improve the propping effect near the wellbore. However, the impact of the injection sequences of proppant with different particle sizes on proppant transport in complex fractures remains unclear. Additionally, research by Chun et al. [24] has shown that proppants have a stronger transport capacity in inclined fractures. Jiang et al. [25] found significant differences in the transport and settling of proppants within rough fractures compared with smooth fractures. The large-scale fracture simulation device can more accurately depict the transport of proppants under actual conditions [8].
This article uses the equipment that considers fracture roughness and multiple types of branched fractures to conduct proppant transport simulation experiments. This further clarifies the transport law of proppants in complex fractures, providing guidance for optimizing the design of volumetric fracturing programs.
1. Experiment
1.1. Experimental equipment
The large-scale and visualized device for particle transport simulation in complex fracture (Fig. 1 ) has a main fracture length of 5 m, a height of 0.6 m, and a width of 5 mm. There are ten branched fractures on both sides of the main fracture, which include three vertical branched fractures (30°, 45° and 90°), one horizontal branched fracture, and one 60° inclined branched fracture on one side, and three vertical branched fractures (150°, 135° and 90°), one horizontal branched fracture, and one 60° inclined branched fracture on the other side. In this paper, these branched fractures are abbreviated as 30°, 45°, 90°, 135°, 150°, horizontal, and 60° inclined branched fractures. The branched fractures are 1 m in length, 0.6 m in height, and 3 mm in width. The combination and relative positions of the main fracture and branched fractures are shown in Fig. 1 . The 30° and 150° branched fractures are located 1 m from the inlet, the 45° and 135° branched fractures are located 2 m from the inlet, the 90° branched fracture is located 3 m from the inlet, the horizontal branched fracture is located 3-4 m from the inlet, and the 60° inclined branched fracture is located 4-5 m from the inlet. Different shapes of complex fractures can be formed by controlling the valve at the outlet of each branched fracture to open or close the fracture.
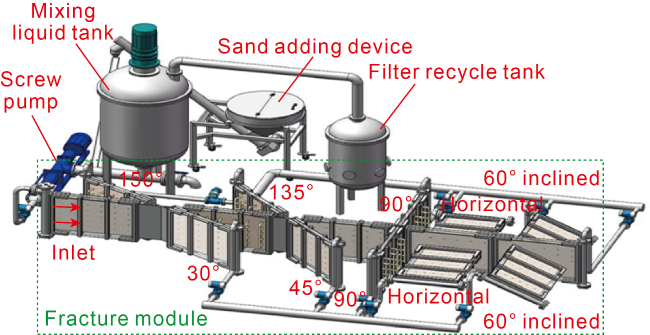
Fig. 1. Schematic diagram of the large-scale visualized device for particle transport simulation in complex fracture. |
Related research has shown that proppant settling speed and transport speed are negatively correlated with the roughness of the fracture surface. Studies have found that proppant settling increases when the flow rate inside the fracture exceeds 0.35 m/s [25-26]. Conversely, when the fracture width is less than twice the size of the proppants, proppant settling is significantly reduced [27]. To more accurately simulate actual fractures, one side of the fracture surface in the experimental device is sticked with quartz sand to simulate a rough fracture surface [28]. Fig. 2 displays a scan of the rough fracture surface, which exhibits a fractal dimension of 1.24 [29-30].
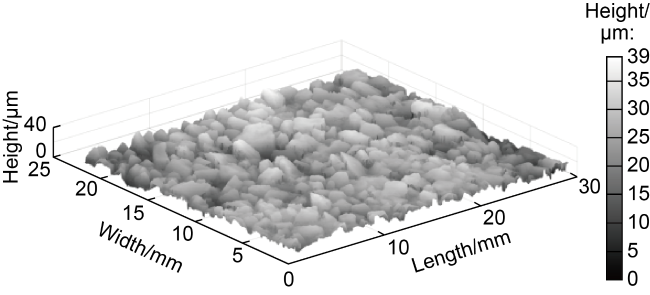
Fig. 2. Scanning image of the fracture surface. |
According to the principle of similarity, the actual fracture parameters are converted to the parameters of the laboratory experiment to ensure the scientific validity of the experiment. Viscous forces are the primary driving force of proppant transport within fractures, and it is necessary to ensure that the Reynolds number of fluid flow in the laboratory experiment is equal to that in actual fractures. The formula for calculating Reynolds number is:
$Re=\frac{\rho vL}{\mu }$
The Reynolds number is derived from flow in circular pipes, where the characteristic length of the flow field is its diameter D. The cross-sectional area of the circular pipe is defined as A, and the wetted perimeter is defined as P, to get the following equation:
$D=\frac{4\left( {\pi {{D}^{2}}}/{4}\; \right)}{\pi D}=\frac{4A}{P}$
For non-circular pipe (filled with fluid) flow, the hydraulic diameter is defined as four times the ratio of cross- sectional area to wetted perimeter, and it serves as the characteristic length of the flow field. For a fracture with height H and width w, its hydraulic diameter is given by:
${{d}_{\text{f}}}=\frac{4A}{P}=\frac{4wH}{2\left( w+H \right)}=\frac{4w}{2\left( \frac{w}{H}+1 \right)}$
As the height of the actual fracture is significantly greater than its width, with w/H being a negligible quantity, we can approximate df=2w. By substituting this expression into Eq. (1), we get:
$R{{e}_{\text{f}}}=\frac{2\rho vw}{\mu }$
Equating the Reynolds number based on actual and experimental flow inside the fracture yields:
$\frac{{{\rho }_{\text{n}}}{{v}_{\text{n}}}{{w}_{\text{n}}}}{{{\mu }_{\text{n}}}}=\frac{{{\rho }_{\text{m}}}{{v}_{\text{m}}}{{w}_{\text{m}}}}{{{\mu }_{\text{m}}}}$
The laboratory experiment and the actual fracture both have a width of 5 mm. The density and viscosity of the fracturing fluid used in the experiment, as well as the diameter and density of the proppant, are the same as those used in actual fracturing. Thus, Eq. (5) can be simplified as vn=vm, which means flow similarity can be realized by ensuring the flow velocity of fluid in both experimental and actual fractures is equal. The actual flow rate corresponds to the total flow rate of a bi-wing fracture, while the experiment simulates a single-wing fracture. Therefore, the relationship between the experimental and actual flow rate can be expressed as:
$\frac{{{Q}_{\text{n}}}}{2{{A}_{\text{n}}}}=\frac{{{Q}_{\text{m}}}}{{{A}_{\text{m}}}}$
1.2. Materials and experimental program
The experimental proppants used in the study were quartz sands of different sizes, including 830/380 μm (20/40 mesh), 380/212 μm (40/70 mesh), and 212/109 μm (70/140 mesh). The fracturing fluid used was slickwater with a viscosity of 5 mPa·s. The sand ratios remained constant throughout the experiments. The other experimental parameters are listed in Table 1 . The experimental flow rate was 16.2 m3/h, and based on Eq. (6), the fluid velocity inside the fracture was calculated to be 1.5 m/s, which is equivalent to a actual flow rate of 9 m3/min for a reservoir with a thickness of 10 m.
Table 1. Parameter settings for different experiments |
| No. | Flow rate/ (m3·h-1) | Sand ratio/% | Particle size | Branched fracture inclination | Opening timing of branched fracture |
|---|---|---|---|---|---|
| 1 | 16.2 | 10 | 380/212 μm (40/70 mesh) | 30°, 150°, 45°, 135°, 90° | Always open |
| 2 | 16.2 | 10 | 380/212 μm (40/70 mesh) | 90°, horizontal, 60° inclined | Always open |
| 3 | 16.2 | 10 | 380/212 μm (40/70 mesh) | 30°, 150°, 45°, 135°, 90°, horizontal, 60° inclined | Always open |
| 4 | 16.2 | 10 | 212/109 μm (70/140 mesh) | 30°, 150°, 45°, 135°, 90°, horizontal, 60° inclined | Always open |
| 5 | 16.2 | 8 | 380/212 μm (40/70 mesh) | 30°, 150°, 45°, 135°, 90° | Always open |
| 6 | 16.2 | 12 | 380/212 μm (40/70 mesh) | 30°, 150°, 45°, 135°, 90° | Always open |
| 7 | 16.2 | 10 | 380/212 μm (40/70 mesh) | 30°, 150°, 45°, 135°, 90° | Closed first and then opened |
| 8 | 16.2 | 10 | 380/212 μm (40/70 mesh) | 30°, 150°, 45°, 135°, 90° | Opened first and then closed |
| 9 | 16.2 | 10 | Ascending order | 30°, 150°, 45°, 135°, 90° | Always open |
| 10 | 16.2 | 10 | Descending order | 30°, 150°, 45°, 135°, 90° | Always open |
Before conducting the experiment, the slickwater with a viscosity of 5 mPa·s was prepared in the mixing liquid tank and a certain amount of proppant was also prepared. The branched fractures needed in the experiment were opened by controlling the valve at the outlet of branched fracture. Based on the experimental flow rate of 16.2 m3/h, the liquid injection speed was calculated to be 4.5 L/s, which is multiplied by the sand ratio to obtain the sand injection rate per second (sand injection rate). The injection time of the proppant is equal to the volume of the proppant divided by the sand injection rate.
The experiment was conducted based on the determined experimental flow rate and sand injection rate. During the experiment, the flow rates of the main and branched fractures were collected every second and the images of the sand pack shape were taken every 5 s. After the proppant injection was completed, the injection of proppant-free fracturing fluid continued for 60 s to ensure complete image collection during the experiment.
The sand pack shape was selected for analysis when the sand pack height in the main fracture was stable (equilibrium phase) during the process of proppant injection. Since the amount of injected proppant in the experiment was greater than the volume of the fracture, the sand packs could reach the equilibrium state. The contour data of the sand pack were extracted using MATLAB's image recognition function, and the 3D sand pack image was generated to intuitively display the sand pack shape and spatial relationship with complex fractures. Furthermore, the sand pack shape comparison curve can be drawn based on the contour data.
Two evaluation parameters were defined: the fracture filling ratio and the degree of near-well unfilled space. The fracture filling ratio is the proportion of the volume of sand pack to the total volume of fractures. The degree of near-well unfilled space refers to the area enclosed by the average height horizontal line of the main fracture sand pack, the wellbore (the left boundary of the main fracture), and the contour of the sand pack shape.
The experimental plan is as follows: (1) Investigation of proppant transport behavior in fractures with different complex shapes. Three sets of experiments (experiment 1-3) were conducted by opening near-well, far-well, and all branched fractures respectively using 380/212 μm (40/70 mesh) quartz sand, which was followed by Experiment 4, where all branched fractures were opened using 212/109 μm (70/140 mesh) quartz sand. The proppant volume was 40 L, and the proppant injection time was 90 s. (2) Investigation of proppant transport behavior under different sand ratios. Constant sand ratio experiments were conducted with sand ratios of 8%, 10% and 12% (experiments 5, 1, 6, respectively). The proppant volumes were 32, 40, 49 L. The proppant injection time was 90 s for all experiments. (3) Investigation of proppant transport behavior with different opening time of branched fractures. We conducted proppant transport experiments under three conditions: Always opening the branched fracture (where the branched fracture continuously expands and accepts fluid injection); First closed and then opened of the branched fracture (where initially only the main fracture is opened for fluid injection, and later, the branched fracture opens and both fractures accept fluid injection); First opened and then closed of the branched fracture (where the branched fracture expands and accepts fluid injection at the beginning, but later stops expanding and does not accept any more fluid injection). These experiments were numbered as 1, 7, and 8, respectively. The proppant volume used for all experiments was 40 L, and the proppant injection time was 90 s. In experiments 7 and 8, we opened and closed the branched fracture respectively after injecting proppant for 45 s. (4) Investigation of proppant transport behavior under different injection sequence of proppants in varied particle sizes. We conducted experiments 9 and 10 to investigate the effect of sand injection sequence on the transport and placement of proppant in complex fractures. For these experiments, we used three types of quartz sand with particle sizes of 830/380 μm (20/40 mesh), 380/212 μm (40/70 mesh), and 212/109 μm (70/140 mesh), with two injection sequences of ascending order and descending order of particle size. The proppant volume used for both experiments was 40 L, the proppant injection time was 90 s, and the volume ratio of the three types of proppant was 1:1:1.
2. Experimental results and discussion
2.1. Proppant transport law under different complex fracture shapes
2.1.1. Comparison between opening near-well and far-well branched fractures
2.1.1.1. Formation process and shape of sand pack in main fracture
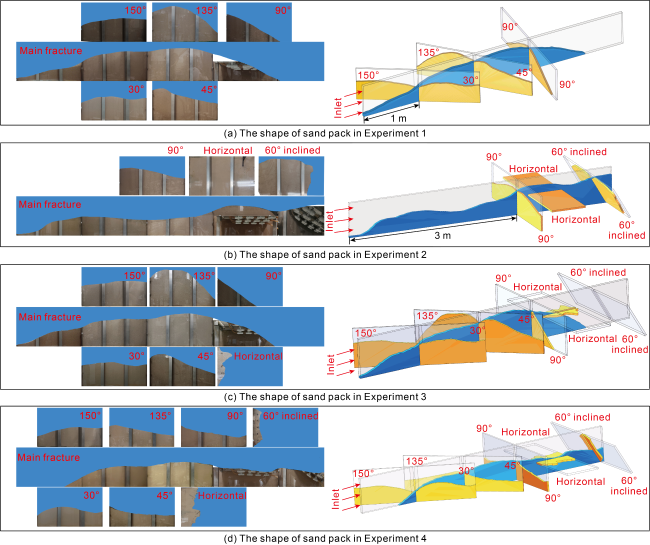
Fig. 3. Results of experiments on complex fractures with various shapes. |
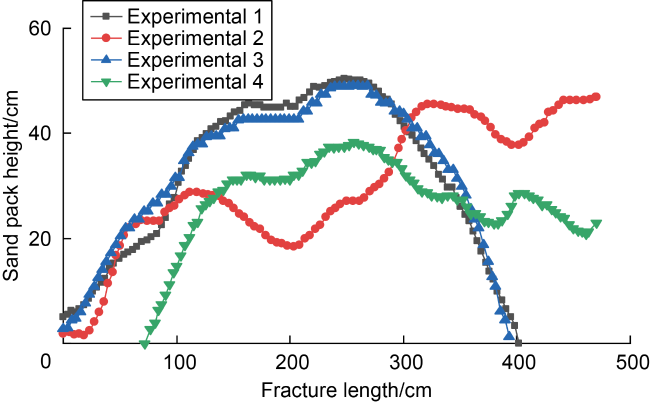
Fig. 4. Comparison of sand pack shape in the main fractures of complex fractures with different shapes. |
Analyzing the process of the height increase of sand pack in the main fracture after branched fracture can enhance our understanding of proppant transport in complex fractures. Assuming laminar flow of the sand-carrying fluid in the fracture, as depicted in Fig. 5 , and ignoring the interaction between the proppant and the fracture surface and that between proppants, the proppant experiences a liquid-carrying force from the fracturing fluid in the horizontal direction (with a horizontal transport velocity of about 0.7-0.9 times the liquid flow velocity [31]). In the vertical direction, the proppant is subjected to gravitational, buoyancy, and viscous drag forces. The combined action of these forces results in a tilted transport trajectory of the proppant, as shown in Fig. 5 , which causes continuous settling of the proppant. Previous studies have classified the fracture into sand pack, rolling-flow zone, suspended zone, and sand-free zone from the bottom to the top based on the longitudinal proppant concentration gradient [10,32]. Fig. 6a and Fig. 6b depict the proppant distribution at the location 1-2 m of the main fracture in Experiment 2 when the sand pack reaches equilibrium and when proppant-free fracturing fluid is injected after the equilibrium, respectively. As shown in Fig. 6a , the slickwater provides lower viscous resistance, so the proppant can quickly settle and rest at the bottom of the fracture to form a sand pack after entering the fracture. The area above the sand pack with a small height is the rolling-flow zone, which appears as blurry stripes with colors similar to the sand pack due to the high concentration and high flow velocity of the proppant in the rolling-flow zone. Above the rolling-flow zone is the suspended zone, where the proppant concentration is low enough to allow the fracture surface to be visible. Proppant exchange occurs continuously between different regions. The experimental process can be divided into three stages. In Stage 1, the initial sand pack buildup phase, proppant settles rapidly at the bottom of the fracture after entering the fracture, leading to an increase in both the height and length of the sand pack. Stage 2 represents the sand pack equilibrium phase, during which the height of the sand pack reaches a steady state while the length of the sand pack continues to increase. In Stage 3, the sand pack near the wellbore is eroded when proppant-free fracturing fluid is injected into the fracture, causing the front edge of the sand pack to move towards the deeper part of the fracture. Proppant is continuously transported to the front edge of the sand pack in all three stages. The rolling-flow zone was observed during both the initial sand pack buildup phase and the sand pack equilibrium phase (Fig. 6a ). When proppant-free fracturing fluid is injected (Fig. 6b ), there is no complex suspended or settling motion of particles in the fracture, and only sand pack and fracturing fluid flow above the sand pack remain. However, a rolling-flow zone can still be observed, and the sand pack near the wellbore erodes, pushing its front edge forward. It indicates that the presence of a sand pack in the fracture and fluid flow above the sand pack are necessary for the formation of the rolling-flow zone. The function of the rolling-flow zone is to transport proppant to the front edge of the sand pack.
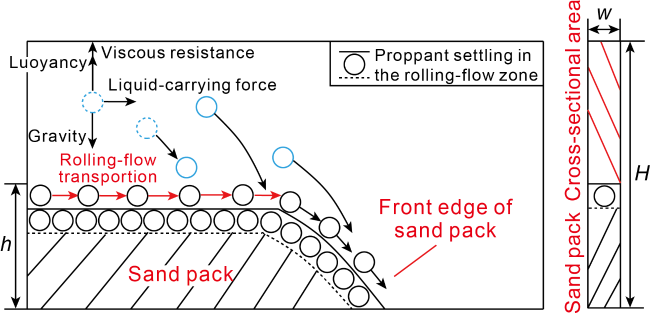
Fig. 5. Diagram of proppant transport in fractures. |
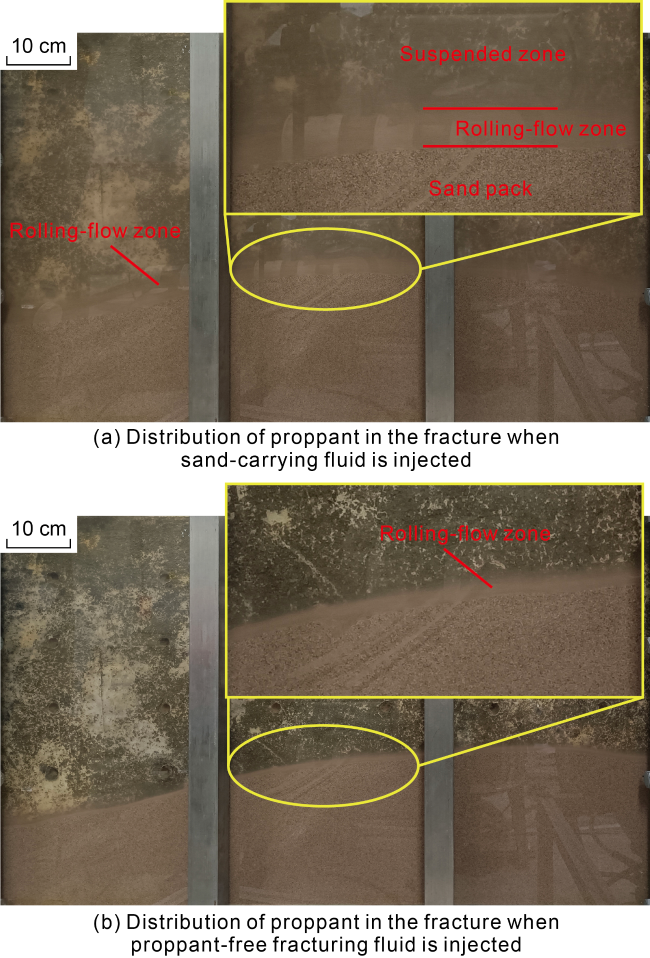
Fig. 6. Distribution of sand pack, rolling-flow zone, and suspended zone in the fracture. |
During the sand pack equilibrium phase, the rolling-flow zone continuously transports near-wellbore proppants to the front edge of the sand pack, but the height of the sand pack remains relatively stable, indicating the presence of proppant replenishment in the near-wellbore sand pack, and the source is solely the settling of proppants in the suspended zone. Therefore, the equilibrium process of the sand pack is a balance between the settling motion of the proppant and the transport motion of the proppant by rolling flow. During the sand pack buildup phase, the increasing height of the sand pack indicates that the amount of sedimentation of proppant is greater than the transportation amount by the rolling-flow zone. As the sand pack height increases, the sedimentation rate and the rolling-flow transport rate continue to change until a dynamic balance is reached, entering the sand pack equilibrium phase.
As mentioned previously, the presence of fluid flow above a sand pack can generate a rolling-flow zone, where the primary mechanism is the carrying force of the fluid. According to the formation principle of liquid carrying force, the greater the velocity of the fluid, the stronger the carrying force is. Therefore, the transport rate and quantity of proppant in the rolling-flow zone (the efficiency of rolling flow transport) are positively correlated with the flow rate of the fracturing fluid. The flow velocity of the fracturing fluid is correlated to the cross-sectional area of the fracture above the sand pack:
${{v}_{\text{f}}}\text{=}\frac{Q}{S}\text{=}\frac{Q}{w\left( H-h \right)}$
As the height of the sand pack increases, the flow rate of fracturing fluid and the efficiency of sediment transport by rolling flow increase correspondingly. Under the assumption of laminar flow mentioned earlier, the settling rate of proppant in the fracture remains constant as long as the vertical force acting on it remains constant. However, when the flow rate of the fracturing fluid above the sand pack increases, it may transit to turbulence. Although the particle motion theory in turbulent flow has not been fully elucidated yet, relevant experiments have shown that the complex flow field generated by turbulence can slow down the settling of proppants and facilitate their transportation [31]. Additionally, the roughness of the fracture can further increase the complexity of the flow field, resulting in a decrease in the settling rate of the proppant and an increase in the transport efficiency of the rolling flow under complex flow conditions, leading to equilibrium when the sand pack height is relatively small. At the entrance of the fracture, when the sand-carrying fluid enters the fracture through perforations (5 perforations), a complex flow field is generated in the near-wellbore fracture, and the flow field becomes more complex as it approaches the entrance. Due to the influence of the complex flow field, the sand pack height in the main fracture of 0-100 cm gradually increased with the gradual stabilization of the flow field in the four groups of experiments shown in Fig. 4 . In experiments 1 and 2, a portion of the sand-carrying fluid enters the branched fractures, causing a reduction in the flow velocity of the sand-carrying fluid in the main fractures. As a result, the efficiency of sediment transport by rolling flow decreases, the settling rate increases, and the dynamic equilibrium is broken, requiring a higher sand pack height to achieve re-equilibrium. Therefore, the sand pack in the main fracture after the diversion will significantly increase. The greater the flow rate in the branched fracture, the greater the increase in the sand pack height in the main fracture.
2.1.1.2. Formation process and morphology of sand pack in branched fractures
The shape of sand pack in branched fractures was analyzed in experiments 1 and 2. Fig. 7 shows the sand pack shape within the 90° branched fracture in these experiments, while Fig. 8 displays the corresponding flow rate change curve. In Experiment 1, the 90° branched fracture was situated farthest from the wellbore, had the smallest flow rate, and exhibited a sand pack shape that was roughly triangular with a filling ratio of 32%. In contrast, in Experiment 2, the 90° branched fracture was located closest to the wellbore, and the flow rate was significantly higher than that of the 90° fracture in Experiment 1. The sand pack shape was approximately rectangular, with a filling ratio of 59%. Therefore, the closer the branched fracture is to the wellbore, the larger the flow rate through the branched fracture is, and the more proppant enters the fracture, resulting in a higher filling ratio of the fracture.
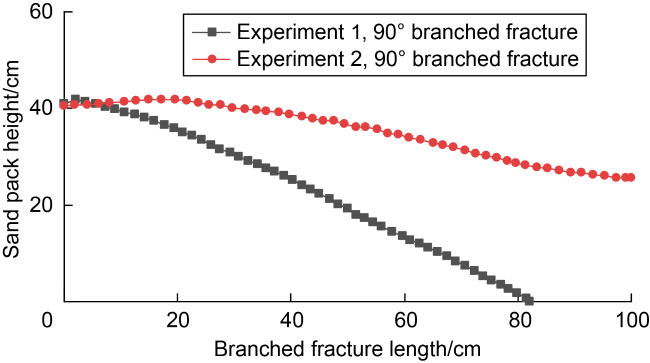
Fig. 7. Sand pack shape of 90° branched fracture in Experiment 1 and Experiment 2. |
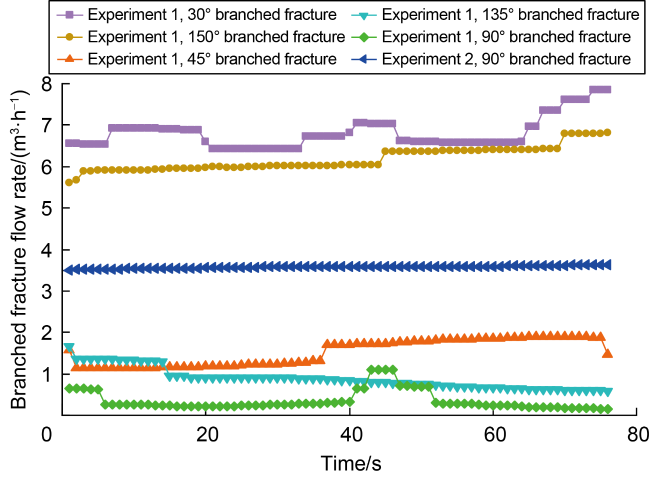
Fig. 8. Flow rate variation within branched fractures in Experiment 1 and the 90° branched fracture in Experiment 2. |
The front edge of the sand pack in the vertical fracture is mostly a gradually descending slope (Fig. 3 ). In the early stage of Experiment 2, the front edge of the sand pack in the horizontal branched fracture exhibited an irregular finger-like shape (Fig. 9 ), while in the later stage, the entire fracture was filled with proppant (Fig. 3b ). The front edge of the sand pack in the 60° inclined branched fracture was also irregular, and the sand pack height and filling ratio were both higher than those in the vertical branched fracture. As the horizontal branched fractures are located further from the inlet, it takes more time for the proppant to enter, but once it does, the entire horizontal branched fracture is filled up quickly. Therefore, in Experiment 2, the early stage refers to the time when the proppant is injected for 70 s.
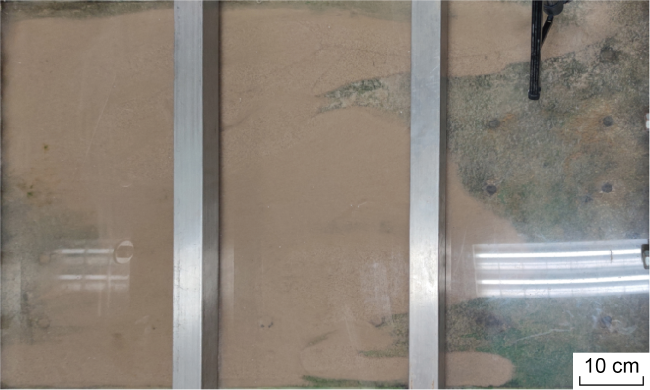
Fig. 9. Shape of sand pack in the early stage of horizontal branched fractures in Experiment 2. |
The different forces on the proppant in fractures with different inclination angles result in different shapes of sand packs. Fig. 10a shows that in a vertical fracture, the proppant settles mainly under the combined effect dominated by gravity in the vertical direction, with minimal impact of horizontal support force from the fracture surface, unless the fracture width is less than twice the size of the proppant particle. As shown in Fig. 10b , in an inclined fracture, the proppant is subjected to a support force perpendicular to the fracture surface, which results in frictional force parallel to the fracture surface during settling along the fracture. This frictional force slows down the settling of the proppant, and an increase in the roughness of the wall will increase the frictional force. Additionally, the contact area between the sand-carrying fluid and the sand pack in the inclined fracture is greater than that in a vertical fracture, resulting in an increase in the amount of proppants undergoing rolling flow. The reduced settling speed and the increased rolling-flow zone result in a broader distribution of proppants along the longitudinal direction of the fracture, forming an approximate rectangular shape. In a horizontal fracture, as shown in Fig. 10c , the support force of the fracture surface is balanced completely with the gravity of the proppant. The contact area between the sand-carrying fluid and the sand pack covers the entire fracture surface, and there is a channel for the fluid to flow above the proppant pack. Theoretically, the entire horizontal fracture is a rolling-flow zone, and the fracture is completely filled with proppant in the height direction. Due to the non-uniformity of the wall roughness, however, the frictional resistance experienced by the proppant during the rolling-flow process varies, resulting in a finger-like front edge shown in Fig. 9 . Therefore, under the same flow rate inside the fracture, as the inclination of the fracture increases, the area of the rolling-flow zone inside the fracture expands, leading to a reduction in proppant settling rate, which in turn increases the likelihood of proppant transport and enlarges the supported area of the fracture. It should be noted that the proppant in a horizontal fracture cannot completely fill the fracture in the width direction, and therefore, the supported fracture width is smaller than the actual hydraulic fracture width.
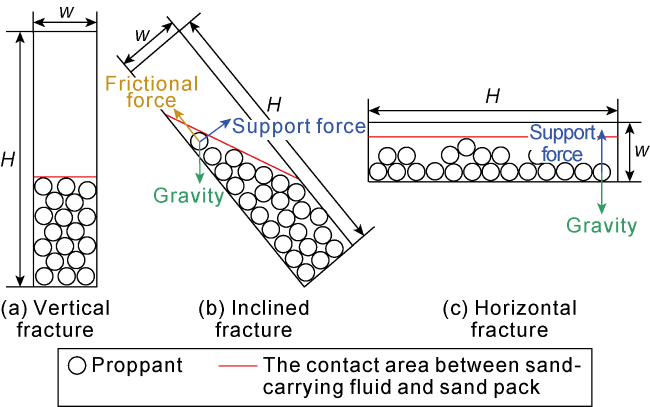
Fig. 10. Diagram of proppant placement in branched fractures with different inclination angles. |
The ultimate distribution of proppant within the fracture is influenced by the combined effects of fracture propagation and proppant transport. In reservoirs with greater burial depth and higher overlying formation pressure, the propagation of horizontal fractures is relatively challenging [33], and the amount of fracturing fluid entering the fractures is minimal or even zero. In addition, the amount of proppant entering the fracture is directly proportional to the flow rate of the fracturing fluid. And thus, proppant filling within the horizontal fractures is poor under such circumstances.
2.1.2. Comparison between opening near-well branched fractures and all branched fractures
In Experiment 1 and Experiment 3, the near-wellbore and all branched fractures were opened, respectively. Even all the branched fractures were opened, the sand-carrying fluid still preferentially entered the near-wellbore branched fracture, resulting in similar sand pack shapes of the near-wellbore branched fracture in both experiments, as well as similar shapes of the main fracture sand pack (Fig. 4 ). In Experiment 3, only a small amount of proppant entered the far-well horizontal branched fracture, while in the 60° inclined branched fracture, the flow rate was low and no proppant entered. Therefore, in formations with developed natural fractures, increasing injection rate and sand volume is necessary to improve the filling of far-well branched fractures.
2.1.3. Comparison of injecting proppants with different particle sizes under the condition of opening all branched fractures
In Experiment 4, all the branched fractures were opened, and a smaller proppant size of 212/109 μm (70/140 mesh) quartz sand was used. Comparison between Fig. 3c and 3d shows that the 212/109 μm (70/140 mesh) quartz sand improved the filling of the far-well horizontal and 60° inclined branched fractures, but was not as efficient as the 380/212 μm (40/70 mesh) quartz sand in filling the near-well main and branched fractures.
2.2. Proppant transport behavior under different sand ratios
As the sand ratio increases, the amount of proppant settling in the fracture per unit time increases, requiring a higher sand pack to reach equilibrium. Therefore, the sand pack height of the main fracture from 0 to 150 cm showed a significant increase (Fig. 11a ), and the unfilling degree of near-well space was reduced (Fig. 11b ) [29]. Increasing the sand ratio helps to improve the filling of fractures near the wellbore. The sand pack shape in the middle section of the fracture (150-250 cm) did not change significantly, and the maximum height of the sand pack increased from 48.06 cm to 50.44 cm. As the sand pack height is already very close to the fracture height, the increase is relatively small. When the sand ratio increased from 8% to 10%, the sand pack front edge (250-400 cm) moved forward, but there was little change in the sand pack front edge when the sand ratio increased from 10% to 12%. Due to the improved filling degree of near-well sand pack and the advancement of the sand pack front edge, the fracture filling ratio increases with the increase of sand ratio (Fig. 11b ).
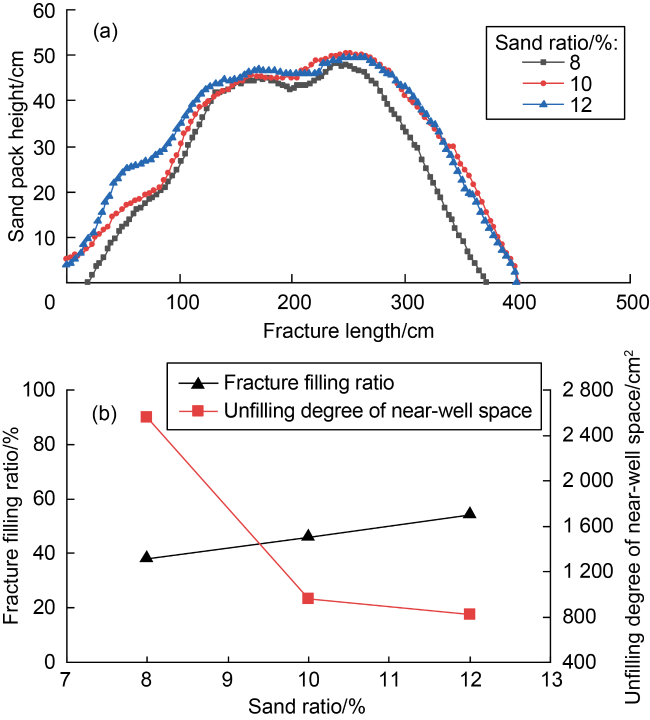
Fig. 11. Sand pack shapes (a) and related parameters (b) of the main fracture under different sand ratios. |
The amount of proppant entering the branched fractures is proportional to the flow rate in the branched fractures. Based on the fracture shape shown in Fig. 3a and the flow rate curve of the fractures in Fig. 8 , it can be inferred that the 30° and 150° fractures are the closest to the wellbore and have the largest flow rate, while the 45° and 135° fractures are farther from the wellbore and have smaller flow rate. The 90° fracture is the farthest from the wellbore and has the smallest flow rate. These flow rate differences lead to varying amounts of proppant entering the fractures, resulting in different sand pack shapes for each branched fracture. Specifically, the sand pack shapes in the 30° and 150° branched fractures are rectangular (Fig. 12a , 12b). In the 45° and 135° branched fracture, the sand pack can only reach its maximum height in the 0-20 cm and 0-30 cm sections, respectively, resulting in a trapezoidal shape (Fig. 12c , 12d). In the 90° branched fracture, the proppant can only slide into the fracture under the influence of gravity, leading to a triangular sand pack shape (Fig. 12e ).
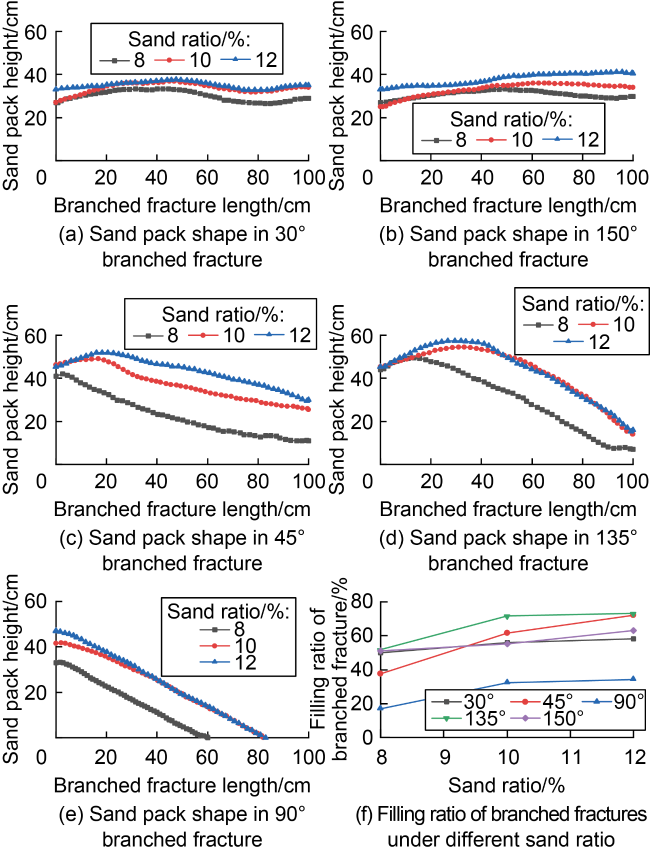
Fig. 12. Comparison of sand pack shapes in branched fracture with different inclinations under different sand ratios. |
However, as illustrated in Fig. 12f , the increase in fracture filling ratio in 30° and 150° branched fractures is not significant and increases linearly with an increase in sand ratio. On the other hand, when the sand ratio increases from 8% to 10%, the filling ratio of other branched fractures significantly increases. Hence, for far-wellbore branched fractures with smaller flow rate which are difficult to enter for proppants, enhancing the sand ratio and the content of proppants in the sand-carrying fluid can augment the amount of proppants entering the branched fractures and in turn, enhance the support of the branched fractures. Nevertheless, when the sand ratio increases from 10% to 12%, the increase in the filling ratio of the far-wellbore branched fractures diminishes since the maximum height of the sand pack in the branched fractures has already approached the height of the fractures. As the sand ratio increases to a certain extent, the increase in sand pack height becomes smaller while the construction risk increases with the further increase of the sand ratio. Therefore, the optimal sand ratio should be in proximity to the inflection point of the curve.
2.3. Proppant transport law under different opening times of branched fractures
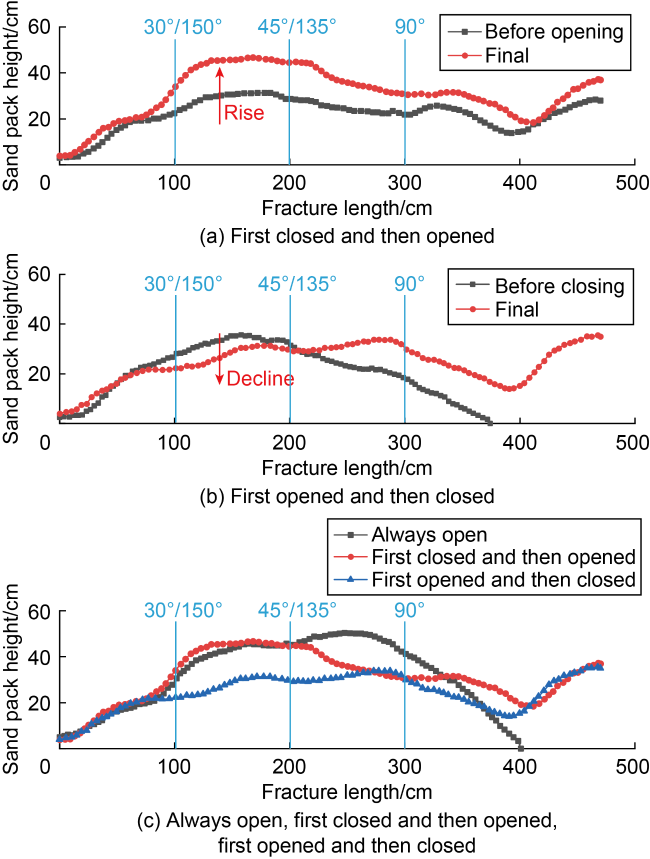
Fig. 13. Shape of sand packs in the main fractures under different opening times of the branched fractures. |
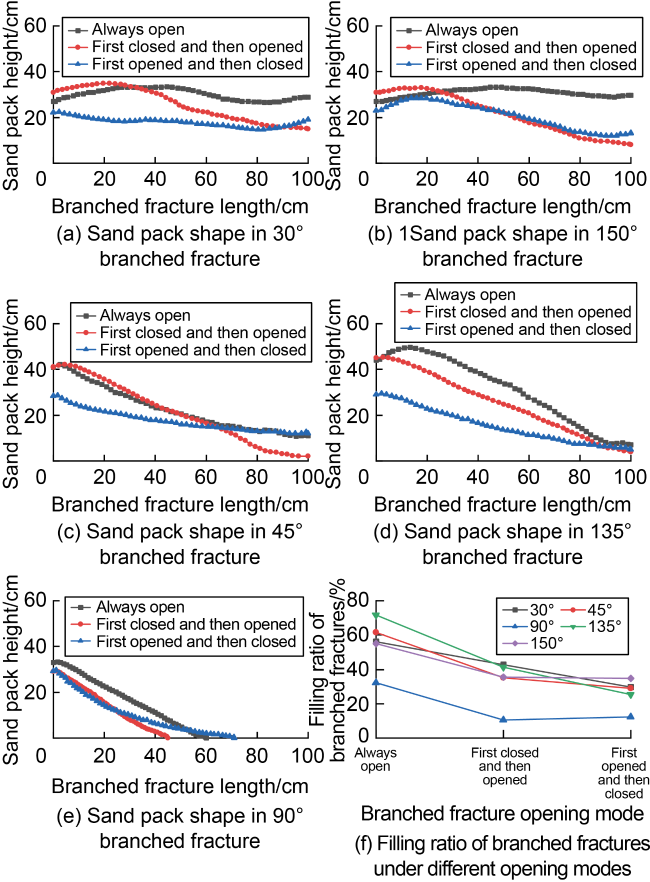
Fig. 14. Comparison of the sand pack shape inside branched fractures at different inclinations under different opening modes. |
In the experiment where the branched fracture is first opened and then closed, when the branched fracture was initially opened, proppant entered the branched fracture with the sand-carrying fluid, resulting in a rapid increase in the height of the sand pack. However, after the branched fracture is closed, the proppant no longer entered the branched fracture with the fracturing fluid, and the sand pack at 100 cm of the main fracture was eroded and lowered. At this point, the sand pack heights in the 30° and 150° branched fractures located at 100 cm of the main fracture were higher than that in the main fracture. Since the proppant cannot enter the branched fracture by gravity, the sand pack in the 30° and 150° branched fractures stopped growing. After the branched fracture was closed, there was little change in sand pack height at the 200 cm of the main fracture, and the sand packs in the 45° and 135° branched fractures located at this position also stopped growing. However, there was a significant increase in sand pack height at the 300 cm of the main fracture, and the proppant could still enter the 90° branched fracture via gravity. As a result, the sand pack in the 90° branched fracture continued to grow after the closure of the branched fracture. The filling ratio of the 90° branched fracture was slightly higher than that when the 90° branched fracture was first closed and then opened. Actual hydraulic fracturing is primarily controlled by the propagation of the main fracture, and most of the branched fractures do not extend continuously throughout the entire hydraulic fracturing process. Instead, they either cease to propagate after an early growth stage due to the continuous accumulation of proppant in the main fracture, or they begin to propagate in a later stage due to a rise in pressure. Sum up, the experiments with branched fracture first closed and then opened or first opened and then closed can reflect the propagation process of branched fracture more accurately, but under these two modes, the filling degree of branched fracture is not as high as that under the mode with branched fracture always open. Therefore, it is necessary to specifically improve the filling of branched fracture when optimizing the fracturing sand adding parameters.
2.4. Proppant transport law under different proppant injection sequences
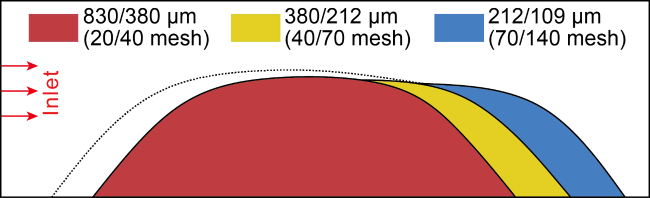
As the proppant particle size increases, the gravitational force acting also increases, resulting in a greater force exerted in the vertical direction on the proppant. This leads to a higher settling rate of the proppant, increased transportation difficulty, and a greater likelihood of the proppant settling near wellbore fractures. To achieve an equilibrium state, a higher velocity of the sand-carrying fluid is required, which leads to the formation of a higher sand pack. When the proppant is injected in an ascending order of particle size (Fig. 15a ), the resulting sand pack exhibits a stacked placement state with larger particles placed on top of smaller particles. On the other hand, when the proppant is injected in a descending order of particle size (Fig. 15b ), the sand pack formed in the main fracture, and 30° and 150° branched fractures shows a placement state with smaller particles placed at the front edge of the sand pack formed by larger particles. In contrast, the sand pack formed in the 45°, 135°, and 90° branched fractures exhibits a stacked placement state, with smaller particles placed on top of larger particles.
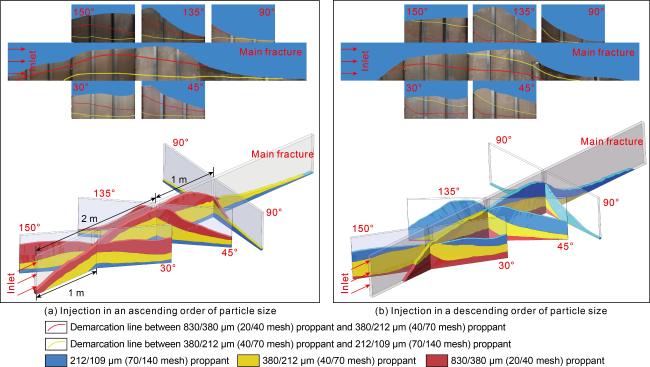
Fig. 15. Experimental results of injection in an ascending order and a descending order of particle size. |
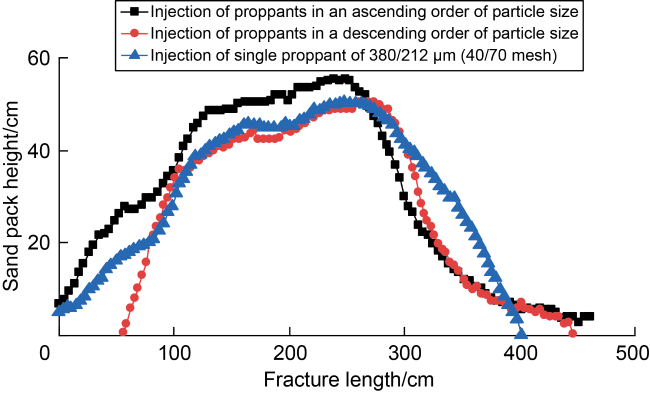
Fig. 16. Sand pack shape in the main fracture under different injection sequences. |
As shown in Fig. 17 , when the proppant is injected in a descending order, due to the smaller injection amount of 830/380 μm (20/40 mesh) proppant, it does not reach its equilibrium height. The subsequently injected 380/212 μm (40/70 mesh) proppant settles on top of the 830/380 μm (20/40 mesh) sand pack, gradually reaching equilibrium. During the injection of 212/109 μm (70/140 mesh) proppant, the near-wellbore sand pack exceeds its equilibrium height for this particle size proppant, so the 212/109 μm (70/140 mesh) proppant does not settle in the range of 0-194 cm of the main fracture. Due to the continuous flow of sand-carrying fluid in the fracture, the sand pack in this range is eroded by rolling transport. The 380/212 μm (40/70 mesh) proppant in the sand pack is primarily eroded, while a small portion of the 830/380 μm (20/40 mesh) proppant is eroded near the wellbore. The equilibrium height of 380/212 μm (40/70 mesh) proppant is lower than that of 830/380 μm (20/40 mesh) proppant, and the sand pack of 380/212 μm (40/70 mesh) is eroded after reaching equilibrium, so the sand pack height during the proppant injection in a descending order of particle size is lower than that in an ascending order. Additionally, the starting position of the sand pack is farther from the wellbore during the injection in a descending order of particle size (Fig. 16 ). Due to the gradual decrease of the sand pack height of 380/212 μm (40/70 mesh) after 194 cm of the main fracture and the diversion effect of the 45° and 135° branched fractures, the 212/109 μm (70/140 mesh) proppant and the 380/212 μm (40/70 mesh) and 830/380 μm (20/40 mesh) proppant eroded near the wellbore heavily settle in this range. Eventually, the height of the sand pack within the range of the main fracture from 271 cm to 329 cm will be higher than that of the injection in an ascending order of particle size (Fig. 16 ). Due to the heavy settling of 212/109 μm (70/140 mesh) proppant in this range, the transport distance is shortened, resulting in a smaller final length of the sand pack than that of the injection in an ascending order of particle size (Fig. 16 ).
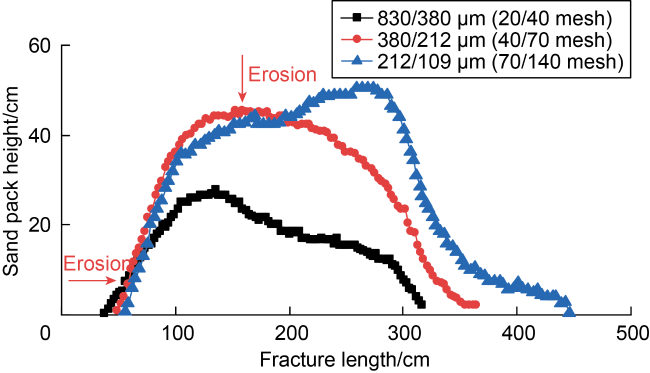
Fig. 17. Sand pack shape in the main fracture after injection of different size proppants in a descending order of particle size. |
The 30° branched fracture is located at the position of 1 m from the inlet of the main fracture, where the sand pack formed by the injection in an ascending order of particle size is higher than that formed by the injection in a descending order and the injection of 380/212 μm (40/70 mesh) proppant alone (Fig. 16 ). Due to the influence of the sand pack in main fracture, the sand pack formed by the injection in an ascending order of particle size is higher than that formed by the other two injection sequences in the 30° branched fracture (Fig. 18a ). The 90° branched fracture is located at 3 m from the main fracture inlet, where the sand pack formed by the injection in an ascending order in the main fracture is lower than that formed under the other two injection modes (Fig. 16 ). In the 90° branched fracture, the sand pack formed by the injection in an ascending order in the range of 0-60 cm is lower than that formed by the injection in a descending order, and the sand pack formed by the injection in an ascending order at 0-67 cm is lower than that during the injection of single 380/212 μm (40/70 mesh) proppant (Fig. 18b ). When injected in a descending order, the placement length of 830/380 μm (20/40 mesh) and 380/212 μm (40/70 mesh) proppants is limited in the 90° branched fracture, and the sand pack formed by the injection of 212/109 μm (70/140 mesh) proppant in the later stage is higher but has a shorter transport distance. Therefore, in the range of 60-100 cm of the 90° branched fracture, the sand pack formed by the injection in a descending order is lower than that formed by the injection in a ascending order. When 380/212 μm (40/70 mesh) proppant is injected alone, the placement length of the sand pack is the shortest.
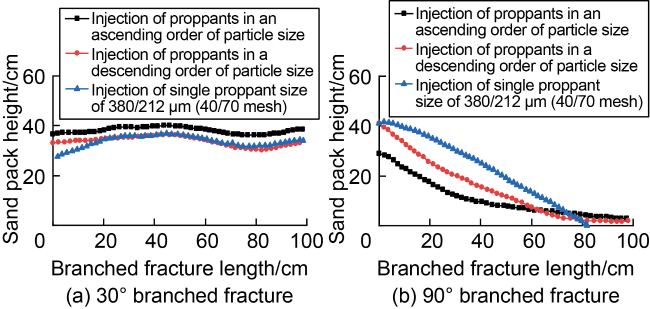
Fig. 18. Sand pack shape in the 30° and 90° branched fractures under different proppant injection sequences. |
During the injection in a descending order of particle size, the sand pack in the range of 0 to 194 cm of the main fracture will be eroded and reduced in height. Therefore, when 212/109 μm (70/140 mesh) proppant is injected into the 30° branched fracture located at 1 m of the main fracture, the sand pack formed by 380/212 μm (40/70 mesh) proppant in the range of 0 to 10 cm will be eroded (Fig. 19a ). Due to the lower height of the sand pack formed by the 380/212 μm (40/70 mesh) proppant in the 10-100 cm range of the branched fracture, erosion only occurs at the entrance of the branched fracture. The main fracture sand pack shows little height variation at 2 m, so the sand pack at the entrance of the 45° branched fracture located at 2 m of the main fracture shows no significant erosion (as evidenced by the non-crossing of the blue and red curves in Fig. 19b ).
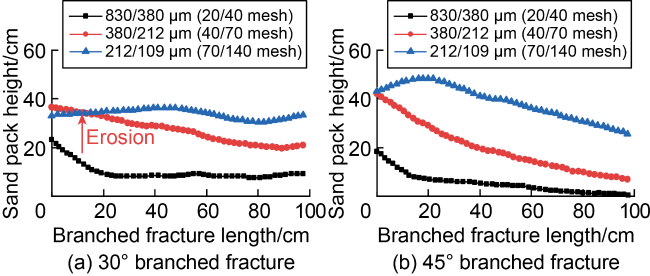
Fig. 19. The shape of the sand packs in the 30° and 45° branched fractures during the injection in a descending order of particle size. |
The placement area of proppant in the branched fracture depends on the flow rate entering the branched fracture. Since the length of the experimental branched fracture is limited, the amount of the proppant entering the branched fracture can be determined by the amount and variation of the flow rate in the branched fracture. As shown in Fig. 20 , the flow rate in the 30° and 150° branched fractures is the highest during different proppant injection sequences, followed by the 45° and 135° branched fractures, while the 90° branched fracture has the lowest flow rate. The farther the branched fracture is away from the entrance, the smaller the flow rate allocated to it, so the filling condition of the branched fractures closer to the wellbore is better than those farther away. As shown in Fig. 20a , when injecting proppants in an ascending order of particle size, the flow rate in the 30° and 150° branched fractures closer to the well gradually increases, while the flow rate in the fractures farther from the well gradually decreases within 0-50 s, which is consistent with the flow rate trend during single-sized proppant injection in Fig. 8 . From 50 s to 60 s, due to a large amount of 830/380 μm (20/40 mesh) proppants settling in the 30° and 150° branched fractures, the flow rate in these fractures decreases, while the flow rate in the fractures farther from the well increases. As shown in Fig. 20b , when injecting proppants in a descending order of particle size, the flow rate in the 30° and 150° branched fractures closer to the wellbore gradually decreases, while the flow rate in the branched fractures farther from the wellbore increases slightly. This will result in a decrease in the amount of proppant entering the branched fractures closer to the wellbore and an increase in the amount of proppant entering the branched fractures farther from the wellbore. The main reason for the decrease in flow rate in the branched fractures closer to the wellbore is that the 830/380 μm (20/40 mesh) proppant injected in the early stages settles near the wellbore to a height of 27 cm, which significantly reduces the flow area at the entrance of the branched fractures closer to the wellbore.
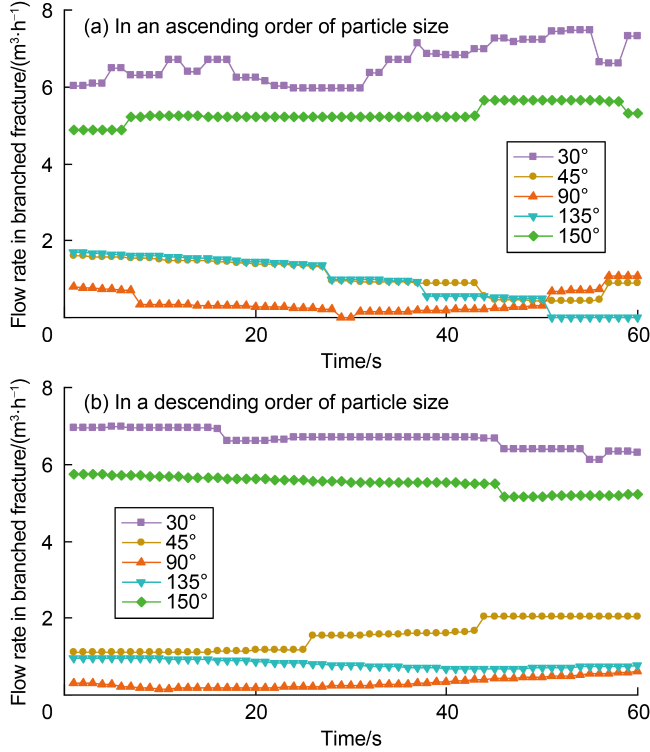
Fig. 20. Flow rate variation of different branched fractures during injection of proppants in ascending order and descending order. |
The experiment achieved similarity with actual fractures by ensuring equal flow velocities in the fracture. However, due to limitations in the length of the experimental fracture, the amount of sand used had to be reduced to obtain the complete sand pack shape within a limited range. This created a significant difference between the experiment time and construction time, which affected the results obtained when injecting the proppants in a descending order of particle size. Due to the limited amount of 830/380 μm (20/40 mesh) proppant injected in the experiment, the 830/380 μm (20/40 mesh) proppant did not reach equilibrium before the 380/212 μm (40/70 mesh) proppant was injected. However, in actual construction, after a significantly longer injection time, the 830/380 μm (20/40 mesh) proppant will reach equilibrium height, and the subsequently injected 380/212 μm (40/70 mesh) proppant will not settle above the 830/380 μm (20/40 mesh) proppant sand pack, but will settle at the front edge of the sand pack instead (the 212/109 μm (70/140 mesh) proppant settles at the front edge of the 380/212 μm (40/70 mesh) proppant). The final shape of the sand pack is shown in Fig. 21 . However, as the injection time increases, the erosion time and volume of the sand pack increase significantly, and the unfilled area near the wellbore fracture is much larger than that shown in the experiment. For injection of proppants in a descending order of particle size, corresponding improvements should be made for the near-well unfilled area in the later stage, such as injecting larger-sized proppants at the end of construction or reducing the injection rate. Moreover, in the actual fractures, the 830/380 μm (20/40 mesh) proppant can reach equilibrium height, resulting in a higher sand pack height and a greater impact on the flow rate in the branched fractures. Therefore, when injecting proppants in a descending order of particle size, the filling of branched fractures within the placement range of 830/380 μm (20/40 mesh) proppant is not as good as that in an ascending order of particle size, while the filling of branched fractures within the placement range of 380/212 μm (40/70 mesh) and 212/109 μm (70/140 mesh) proppants can be improved. When injecting different sizes of proppants, if the proportion of 830/380 μm (20/40 mesh) proppant is relatively small, it is suitable to inject the proppant in a descending order of particle size, which has less influence on the filling of the branched fractures located near the wellbore and in the middle of the main fracture.
Fig. 21. Proppant placement in actual fracture when proppants are injected in a descending order of particle size. |
2.5. Discussion
This study indicates that the main problem with fracture filling in volume fracturing is due to the diversion effect of branched fractures, the flow rate of the sand- carrying fluid gradually decreases, and the transport capacity of the proppant gradually weakens. This leads to a reduction in the length of proppant placement in the main fracture and a poor propping effect in the far-well branched fractures. Additionally, the filling situation of the branched fracture that first closed and then opened or first opened and then closed is not as good as that of the always open. However, actual branches will not continuously propagate, so the filling situation of actual branched fracture is worse than that shown in the experiments. To improve the filling of branched fractures as the primary goal, the following suggestions are proposed:
(1) It is recommended to inject the proppant combination with different particle sizes. This study demonstrates that the use of 212/109 μm (70/140 mesh) proppant can increase the length of sand pack in the main fracture and improve the filling of far-well branched fractures, but the overall height of the sand pack decreases, and the filling of near-well main fractures deteriorates. The injection of proppant combination with different particle sizes can enhance the effectiveness of fracture support. This study clearly demonstrates that the addition of 212/109 μm (70/140 mesh) proppant increases the length of the sand pack in both the main and branched fractures, compared with the injection of 380/212 μm (40/70 mesh) proppant alone. Therefore, it is recommended to inject proppants with different particle sizes in an ascending order of particle size. When the amount of 830/380 μm (20/40 mesh) proppant is small, the injection in a descending order of particle size can be adopted, with the addition of large particle size proppants at the end to improve the filling of the main fractures near the wellbore.
(2) Increase the flow rate. This study shows that increasing the inflow rate into the branched fracture significantly improves the filling of the branched fractures. Therefore, for reservoirs with developed natural fractures, increasing the injection rate can improve the filling of branched fractures.
(3) Increase the sand ratio. The inflow rate into the branched fractures is the main factor limiting proppant entry. This study shows that increasing the sand ratio can improve the filling of branched fractures by increasing the sand concentration in the sand-carrying fluid. After a certain point, the increase in sand ratio has a diminishing effect on the height of the sand pack. Therefore, the optimal sand ratio should be determined through experiments.
3. Conclusions
The sand pack equilibrium is a dynamic balance between particle settling and rolling-flow transport. Changes in sand ratio, proppant particle size, and flow field and rate in fractures can affect the efficiency of particle settling or rolling-flow transport, causing the sand pack to lower or rise to reach a new dynamic equilibrium.
The diversion of branched fracture can increase the sand pack height of the main fracture, and decrease the placement length, leading to poor filling of the far-well branched fracture. The surface of inclined fracture can generate a frictional force that decelerates the settling of proppant, resulting in higher sand pack and supporting fractures. However, the width of the supporting fracture is smaller than that of the hydraulic fracture. The non-uniformity of the wall roughness causes the front edge of the sand pack in the horizontal branched fracture to present in a finger-like shape.
Increasing the sand ratio improves the filling situation of the near-wellbore main fractures and far-wellbore branched fractures, and increases the length of the sand pack in the main fracture. However, due to the constraint of fracture height, as the sand ratio increases to a certain value, the increase in sand pack height gradually decreases with the further increase of the sand ratio.
When the branched fracture is first closed and then opened, the sand pack in the middle of the main fracture is raised after the branched fracture is opened. When the branched fracture is first opened and then closed, the sand pack in the main fracture is eroded after the branched fracture is closed, resulting in an increase in the length of sand pack. When the branched fracture is always open, the support effect of the branched fracture is the best. When the branched fracture is first closed and then opened, the support condition is better than that when the branched fracture is first opened and then closed.
When proppant is injected in an ascending order of particle size, it presents a layered arrangement with small particles at the bottom and large particles at the top. When the proppant is injected in a descending order, the small-sized proppant is arranged in front edge of the large-sized proppant sand pack, and the sand pack near the well is heavily eroded. The large-sized proppant injected firstly forms a higher sand pack in the main fracture near the well, which affects the fluid flow into the near-well branched fracture and thus its filling effect.
Nomenclature
A—cross-sectional area of flow, m2;
An, Am—Actual and experimental fracture inlet area, m2;
D—pipe diameter, m;
df—hydraulic diameter of flow inside the fracture, m;
h—height of the sand pack, m;
H—fracture height, m;
L—characteristic length of the flow field, m;
P—wetting perimeter, m;
Q—fracturing fluid flow rate in a single-wing fracture, m3/s;
Qn, Qm—actual and experimental operation flow rate, m3/min;
Re—reynolds number;
Ref—Reynolds number of flow within the fracture;
S—cross-sectional area of flow above sand pack, m2;
v—characteristic velocity of flow field, m/s;
vf—fracturing fluid flow rate, m/s;
vn, vm—initial flow velocity of sand-carrying fluid in actual and experimental fractures, m/s;
w—fracture width, m;
wn, wm—actual and experimental fracture width, m;
μ—dynamic viscosity of the fluid, Pa·s;
μn, μm—actual and experimental viscosity of the sand-carrying fluid, Pa·s;
ρ—fluid density, kg/m3;
ρn, ρm—sand-carrying fluid density in actual and experimental situations, kg/m3.