

Introduction
CO2 capture, utilization and storage - enhanced oil recovery (CCUS-EOR) refers to capturing CO2 from industrial emission sources, transporting and injecting CO2 into oil reservoirs to displace crude oil, and storing CO2 in the reservoir permanently to achieve CO2 reduction. In China’s plan to realize carbon peaking and carbon neutrality, the main negative carbon technology to achieve the dual carbon goal is a combination of CCUS and CO2 capture, transportation, and storage (CCS). The market potential of CO2 storage capacity is expected to be (10- 16)×108 t during the carbon neutrality period. CCUS/CCS technology is also a fundamental carbon neutrality pathway for coal industrial sectors that have had difficulty achieving deep decarbonization, such as coal-fired power plants and the cement and steel industries [1-2]. The scale emission reduction capability of CCUS-EOR has resulted in it being one of the most important CCUS technologies. The research on CCUS-EOR carbon emission reduction quantification and certification is the basis for assessing net emission reduction, repositioning the contribution of emission reduction, and conducting industrial planning. It is also an essential precondition for promoting the inclusion of the CCUS-EOR project in the carbon emission trading market and achieving the resulting benefits.
Greenhouse gas emission accounting methods for CO2 geological storage, which mainly include guidelines, standard specifications, and framework methods, are mainly for CCS projects and do not involve CO2 flooding. The CO2 quality control methodology for CCS projects proposed by the Intergovernmental Panel on Climate Change Guidelines for National Greenhouse Gas Inventories is applicable to CCS projects that capture CO2 from various industrial emission sources and store it in reservoirs or aquifers; however, the methodology does not provide a calculation method for relevant emission reductions owing to the limitations of leakage monitoring technologies [3]. The Durban World Climate Conference comprised CCS in the list of clean development mechanism activities in 2012, and the United Nations Framework Convention on Climate Change published an accounting methodology for certified emission reductions (CERs) of CCS projects; however, there was no practical application of this methodology. The Technical Committee on CO2 Capture, Transport, and Storage (ISO/TC 265) established a standard for the quantification and verification of the entire CCS technology process within the framework of ISO standards that has not been enacted [4]. The underground injection control class VI well site characterization guidance published by the United States Environmental Protection Agency is a calculation and certification system covering the prediction, calculation, monitoring, and other aspects of CO2 geological storage capacity based on a fine description of geological storage reservoirs, reservoir adaptability analysis, and potential evaluation [5].
The energy consumption devices in CO2 flooding and storage processes are scattered, and the process pressure-relief discharge and leakage paths are complex. Therefore, the calculation methods to assess greenhouse gas emission reduction in CCS projects cannot be used in CCUS-EOR projects. Research on carbon emission reduction accounting methods for EOR projects is in its early stages in the world, and the quantification and certification of CO2 emission reduction and leakage monitoring are the main technical issues. The accounting boundaries of each process in CO2 capture, transportation, and oil displacement are unclear, and determining the potential paths of device leakage and emergency leakage and quantifying the pressure-relief discharge and leakage are difficult. The migration and storage status of CO2 in the formation and the monitoring technology of wellbore and formation leakage require further development and improvement. Moreover, the prediction and certification of the lifecycle storage capacity and safety have long been limiting factors in the issuance of CERs in the CCUS-EOR project.
Owing to the establishment and gradual expansion of China’s carbon market, the National Development and Reform Commission filed 189 voluntary greenhouse gas emission reduction methodologies based on the characteristics of domestic energy-saving and emission reduction projects. China Certified Emission Reduction (CCER) program has played an important role in offsetting mechanisms in the national carbon emissions trading market. Research on developing the CCUS-EOR project as a greenhouse gas emission reduction project and demonstrating the feasibility of including CCUS in the national carbon market is underway in China.
This article focuses on the difficulties of CO2 emission quantification and certification to determine the dissipation and leakage paths and quantify the leakage in the CCUS-EOR project. Within the methodological framework of voluntary greenhouse gas emission reduction projects registered in China, including defining the applicable conditions and the project accounting boundaries; determining different baseline scenarios and baseline emissions; and determining the emissions, dissipation, and leakage paths of the CCUS-EOR project, the method for calculating and monitoring carbon reduction emissions for CCUS-EOR and CCS projects is proposed, providing a methodological basis for calculating the net reduction emissions of CCUS-EOR projects in different scenarios.
1. Theoretical basis for accounting methods
1.1. Project boundary definition
The boundary of the CCUS-EOR project contains the region where all the energy consumption devices are located and the predicted diffusion range of all the project’s potential leakage paths. The boundary was divided into three parts: the geographical accounting boundary for the ground process, the underground CO2 migration boundary, and the leakage accounting boundary (Fig. 1 ).
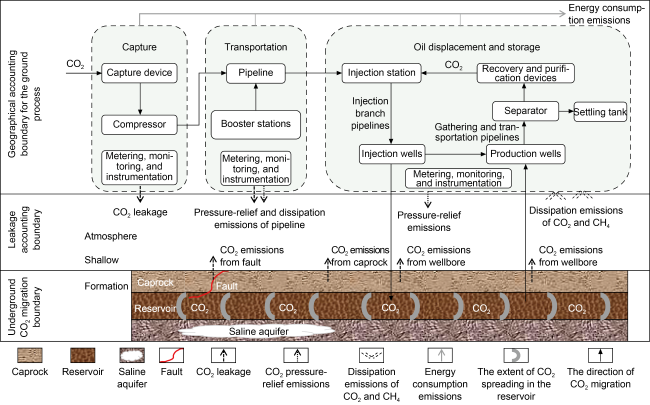
Fig. 1. The accounting boundary of CCUS-EOR projects. |
The geographical accounting boundary for the ground process of the CCUS-EOR project included three independent parts: CO2 capture, transportation, and oil displacement and storage. Each accounting boundary has to be defined separately to facilitate the determination of project baseline scenarios and account for baseline emissions. The accounting boundary of the CO2 capture process starts with the capture device and ends with the outlet metering device of the compressors, including other energy consumption devices within the boundary. The accounting boundary for CO2 transportation starts with the inlet metering device of the CO2 pipelines or tank cars (ship) and ends with the metering device of the oil field receiving metering station, including all energy consumption devices (e.g., CO2 pipelines, tank cars and ships, booster pumps, and monitoring equipment). The starting point of the calculation boundary for CO2 flooding and storage is the CO2 injection system metering station, and the ending points are the leakage monitoring devices distributed dynamically on the ground and in the atmosphere, including the ground sealing process system that involves CO2 injection, oil and CO2 gathering and transportation, and CO2 recovery and purification processes.
The underground CO2 migration boundary refers to the extent to which CO2 spreads in a reservoir after injection. Part of the CO2 is permanently retained and stored underground by dissolving in formation water, reacting with rocks to form mineralization and solidification, and is adsorbed by the formation. Part of the CO2 is dissolved in crude oil or extracted as an associated gas. The underground migration boundary was determined using the monitoring method and CO2 fluid migration, which can intuitively reflect the migration of the CO2 displacement front [6]. The determination of the underground CO2 migration boundary is the basis for the economic and rational deployment of CO2 leakage monitoring points, which affects the accuracy of the leakage emission calculation for the CCUS-EOR project.
The definition of leakage accounting boundaries requires identifying and distinguishing the leakage paths of ground processes and underground storage, including the CO2 dissipation and leakage paths from the device, pipeline, and emergency release during the capture, transportation, and oil displacement processes, and the storage leakage paths from the caprock, wellbore, and fault where CO2 stored in geological bodies would escape. A whole process dissipation and leakage model should be established on this basis, which can predict CO2 diffusion in the formation, surface water, underground water, and atmosphere.
Carbon reduction accounting for the CCUS-EOR project also needs to be divided into that within the certification period and that throughout the project life cycle, owing to the difference between the migration space of CO2 in the formation and the predicted space range of potential dissipation and leakage paths. The carbon emission reduction boundaries within the certification period and throughout the project life cycle differ, and the leakage monitoring scope should be changed accordingly. The accounting boundary of carbon emissions reduction throughout the project life cycle should be predicted according to the monitoring time demands after the CCUS-EOR project closure.
1.2. Determination of baseline scenarios and accounting of baseline emissions for the CCUS-EOR project
Alternative scenarios without CCUS-EOR project activities need to be identified and determined within three independent accounting boundaries: capture, transportation, and oil displacement and storage. Analysis of the energy consumption structure and leakage paths of the entire process under different scenarios was the basis for calculating the carbon reduction emissions of the project.
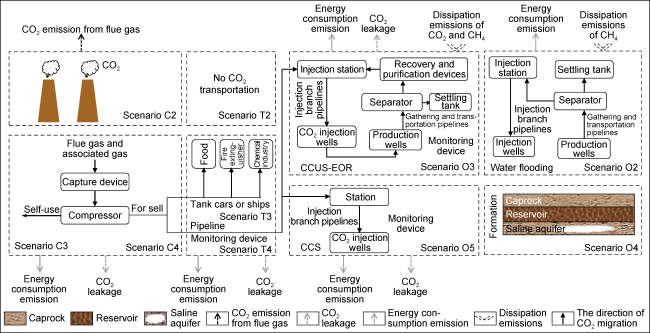
The baseline scenario of CO2 capture refers to the alternative scenarios of carbon source utilization without this CCUS-EOR project activity (Fig. 2 ), including but not limited to the following: C1, the project activities are not implemented as a voluntary greenhouse gas reduction project; C2, the carbon sources are emitted directly to the atmosphere to maintain the status quo; C3, CO2 is captured and used as a chemical material by the manufacturer for its use; and C4, CO2 is captured and sold by the manufacturer.
Fig. 2. The boundary of baseline scenarios for CCUS-EOR projects. |
The baseline scenario of CO2 transportation includes but is not limited to the following: T1, in which project activities are not be implemented as a voluntary greenhouse gas reduction project; T2, no CO2 transportation activities to maintain the status quo are conducted; T3, CO2 is transported by tank cars or ships; and T4, CO2 is transported by pipeline.
The baseline scenarios of CO2 flooding and storage refer to alternative scenarios of methods for oil field development and utilization of oil and gas reservoirs and saline aquifers without this CCUS-EOR or CCS project activity, including but not limited to the following: O1, the project activities are not implemented as a voluntary greenhouse gas reduction project; O2, the reservoirs are developed by waterflooding or other development methods to maintain the status quo; O3, the reservoir is developed by CO2 flooding but has not reached its maximum producing capacity; O4, geological carbon sinks such as difficult-to-develop and depleted reservoirs and saline aquifers are not used for CO2 storage to maintain the status quo; and O5, depleted reservoirs and saline aquifers are used for CO2 storage but have not reached their maximum storage capacity.
Baseline emissions were calculated based on the actual greenhouse gas emissions of each process under the baseline scenarios, including the quantity of CO2 captured, energy consumption emissions from CO2 capture, compression, and transportation, and emissions from CO2 flooding processes and leakage. The emissions were calculated as follows:
${{E}_{\text{B,}y}}={{E}_{\text{C,}y}}+{{E}_{\text{cc},y}}+{{E}_{\text{tr,}y}}+{{E}_{\text{EOR,}y}}+{{E}_{\text{s,}y}}-{{P}_{\text{C,}y}}$
The baseline emissions in the capture and compression processes have two cases: (1) In baseline scenario C2, new CO2 capture and compression equipment must be constructed and installed. The calculation method for this baseline emission is shown in Eq. (2). (2) CO2 capture and compression equipment already exist in baseline scenarios C3 and C4, and the baseline emissions are calculated by the lower value compared the remaining depreciation period with the certification period of the capture and compression equipment. The calculation method is shown in Eq. (3).
${{E}_{\text{C,}y}}={{P}_{\text{P,}y}}{{E}_{\text{ap}}}E{{F}_{\text{e}}}+\sum\limits_{j=1}^{{{n}_{j}}}{{{P}_{\text{P},y}}E{{F}_{j}}{{F}_{\text{ap},j}}NC{{V}_{j}}}$
${{E}_{\text{cc,}y}}={{P}_{\text{C,}y}}{{E}_{\text{ac}}}E{{F}_{\text{e}}} +\sum\limits_{j=1}^{{{n}_{j}}}{{{P}_{\text{C,}y}}E{{F}_{j}}{{F}_{\text{ac,}j}}NC{{V}_{j}}}$
The baseline emissions of CO2 transportation include two cases: (1) In baseline scenario T2, new CO2 transportation pipelines need to be constructed and installed, or CO2 is transported by tank cars (ships), and the baseline emissions are zero. (2) Transportation pipelines or tank cars (ships) already exist in baseline scenarios T3 and T4, and the baseline emissions are calculated by the lower value compared with the certification period and the quantity of CO2 transported with the remaining depreciation period and pipeline capacity. The calculation method is shown in Eq. (4).
${{E}_{\text{tr,} y}}={{P}_{\text{C,}y}}{{E}_{\text{at}}}E{{F}_{\text{e}}}+\sum\limits_{j=1}^{{{n}_{j}}}{{{P}_{\text{C,}y}}{{F}_{\text{at,}j}}E{{F}_{j}}NC{{V}_{j}}}$
The baseline emissions for CO2 oil displacement and storage or only storage activities include: (1) New CO2 oil displacement and storage ground processes equipment need to be constructed and installed in baseline scenario O2, and the calculation of baseline emissions is shown in Eq. (5). (2) In baseline scenario O3, CO2 flooding devices from CO2 injection, oil and CO2 gathering and transportation, CO2 recovery and purification processes already exist. The baseline emissions calculation needs to evaluate the remaining equipment capacity and depreciation period, and the calculation method is shown in Eq. (6). (3) Baseline emissions in baseline scenario O4 is zero. (4) In baseline scenario O5 conditions, CO2 storage process equipment already exists. The baseline emissions were calculated according to Eq. (7) based on the evaluation of the remaining equipment capacity and depreciation time.
\[{{E}_{\text{EOR,}y}}={{Q}_{\text{w,}y}}{{E}_{\text{aw}}}E{{F}_{\text{e}}}+\sum\limits_{j=1}^{{{n}_{j}}}{{{Q}_{\text{w,}y}}{{F}_{\text{aw,}j}}E{{F}_{j}}}NC{{V}_{j}}+{{E}_{\text{G},y}}\]
${{E}_{\text{EOR,}y}}={{Q}_{\text{C,}y}}{{E}_{\text{aE}}}E{{F}_{\text{e}}}+\sum\limits_{j=1}^{{{n}_{j}}}{{{Q}_{\text{C,}y}}{{F}_{\text{aE,}j}}E{{F}_{j}}}NC{{V}_{j}}+{{E}_{\text{G,}y}}$
\[{{E}_{\text{s},y}}={{Q}_{\text{Cs},y}}{{E}_{\text{as}}}E{{F}_{\text{e}}}+\sum\limits_{j=1}^{{{n}_{j}}}{{{Q}_{\text{Cs},y}}{{F}_{\text{as},j}}E{{F}_{j}}NC{{V}_{j}}}\]
1.3. Demonstration of additionality
CCUS-EOR is initiated by stakeholders to reduce greenhouse gas emissions as part of their social and environmental responsibilities at the present stage. The internal rate of return on project investment is lower than national and industry requirements, and CCUS- EORS projects have no attraction without financial support from carbon emission reduction benefits. Investment analysis is recommended as a simplified demonstration of project additionality, proving that investment barriers such as financial performance indicators and technical risks without CCER support exist; thus, the internal rate of return of CCUS-EOR projects is less than 8%.
1.4. Emission accounting
The emissions from the CCUS-EOR projects include CO2 emissions generated by electricity and fossil fuel consumption and dissipation emissions from project activities. In calculating and quantifying the actual emissions of the CCUS-EOR projects, clarifying the consumption of different types of energy consumed and the dissipation emissions from various paths within the specific project boundary is necessary. The accounting steps are as follows: (1) investigate all emission sources and types within the accounting boundary; (2) identify the carbon emission factors for different types of energy consumption; (3) identify all the dissipation sources from CO2 injection-production and gathering-transportation processes; (4) measure and monitor energy consumption and emissions, pressure-relief discharge, and dissipation, including data from, for example, electricity meters, fossil fuel purchase contracts, measurement and monitoring instruments; and (5) select appropriate accounting methods based on emission types, monitor data, and industry accounting standards.
The carbon emissions within the accounting boundary of the CCUS-EOR projects originate from direct emissions generated by fossil fuel consumption from various process units, indirect emissions generated by power consumption, and dissipation emissions from ground processes. The main greenhouse gas emitted is CO2, with a small amount of CH4 discharged from the oil and gas production process (Table 1 ). Emission accounting of CO2 capture only needs the emissions from energy consumption in transportation and oil displacement and storage processes. The CO2 and CH4 released and dissipated also need to be calculated in transportation and oil displacement and storage processes, including CO2 released through the cut-off valve chambers during pipeline inspection and maintenance, CO2 or CH4 gas released through relief valves or safety valves to ensure the safety of oil and gas production (e.g., pressure relief discharge from different devices, discharge from transfer stations, and joint stations), and CO2 and CH4 gas released from oil and gas production injection-production and gathering-transportation processes (e.g., injection compressor units, valves, flanges, casings, and storage tanks). CO2 and CH4 emissions accounting for transportation, oil displacement, and storage processes must be calculated separately based on the emission and dissipation sources.
Table 1. Sources of emissions and types of greenhouse gases within the accounting boundary of CCUS-EOR projects |
| Accounting boundary | Emission type | Sources of emissions | Energy consumption type | Types of greenhouse gases | |
|---|---|---|---|---|---|
| Main emission source | Assuming negligible | ||||
| Capture | Energy consumption | Power consumption of devices; steam consumption of desorption; power consumption of compressors; energy consumption of other devices such as metering, monitoring, and instrumentation | Electricity, Coal, etc. | CO2 | N2O, CH4 |
| Transportation | Energy consumption | Energy consumption of pipeline and fossil energy consumption of tank cars; power consumption of Compressors/pumps (long-distance pipeline pressure boosting); energy consumption of other equipment such as metering, monitoring, and instrumentation | Electricity, gasoline, etc | CO2 | N2O, CH4 |
| Dissipation | Pressure-relief emissions | CO2 | N2O, CH4 | ||
| Oil displacement and storage | Energy consumption | Energy consumption of the circulating injection station (including energy consumption of devices such as export pumps, blending pumps, heating furnaces, compressors, injection pumps, etc.); energy consumption of the gathering and transportation system (including energy consumption of devices such as branch pipelines and three- phase separators); energy consumption of CO2 recovery and purification devices (including filtration and separation devices, compressors, pressure swing adsorption (PSA) devices, etc.); energy consumption of other equipment such as metering, monitoring, and instrumentation | Electricity, natural gas, etc. | CO2 | N2O, CH4 |
| Dissipation | Pressure-relief; dissipation emissions of ground system | CO2, CH4 | N2O | ||
There are three methods for calculating project carbon emissions: (1) The emission factor method is mainly used to calculate emissions from the energy consumption devices of CCUS-EOR processes. The CO2 emission factor for power consumption is from "Notice on the management of greenhouse gas emission reports for enterprises in the power generation industry from 2023 to 2025" issued by the Ministry of Ecology and Environment [7] (with the CO2 emission factor of 0.570 3 t/(MW·h)) and fossil fuel emission factors [3]. (2) The actual measurement is used to calculate the process pressure-relief discharge and dissipation emissions during CO2 transportation and oil and gas production. (3) The default value method is used for the accounting of CH4 fugitive emissions from oil and gas production and the relevant default values based on the “Accounting methods and reporting guidelines for greenhouse gas emissions from Chinese petroleum and natural gas production enterprises (trial) [8]”.
The emissions of the CCUS-EOR project are the sum of the CO2 emissions generated by the consumption of electricity and fossil fuels, and the CO2 and CH4 emissions generated by pressure-relief discharge and fugitive emissions. The formula is as follows:
${{E}_{\text{P}}}{{_{,y}}_{ }}={{E}_{\text{PC,}y}}+{{E}_{\text{PT,}y}}+{{E}_{\text{PE,}y}}+{{E}_{\text{Pv,}y}}+{{E}_{\text{Pe,}y}}-{{P}_{\text{C,}y}}$
The carbon emissions generated by fossil fuels and electricity consumed by CO2 capture, compression, transportation, and oil displacement were calculated using the emission factor method:
${{E}_{PC,y}}_{ }=\sum\limits_{i=1}^{n}{\text{(}{{E}_{\text{C,}i,y}}}E{{F}_{\text{e}}}+{{S}_{\text{C,}i,y}} E{{F}_{\text{s,}y}}\text{)}+\sum\limits_{j=1}^{{{n}_{j}}}{{{F}_{C,j,y}}}NC{{V}_{j}}E{{F}_{j}}$
${{E}_{\text{PT}}}_{,y }=E{{F}_{\text{e}}}\sum\limits_{i=1}^{n}{{{E}_{\text{Tr,}i,y}}}+\sum\limits_{j=1}^{{{n}_{j}}}{{{F}_{\text{Tr,}j,y}}NC{{V}_{j}}E{{F}_{j}}}$
${{E}_{\text{PE,}y}}=E{{F}_{\text{e}}}\sum\limits_{i=1}^{n}{{{E}_{\text{E,}i,y}}}+\sum\limits_{j=1}^{{{n}_{j}}}{{{F}_{\text{E,}j,y}}}NC{{V}_{j}}E{{F}_{j}}$
Cut-off valve chambers must be depressurized before CO2 transportation, injection, and gathering pipeline maintenance and repair to eliminate safety hazards. Safe operations such as stopping pumps, decompression, and pressure relief according to the operation requirements must be conducted immediately to ensure that the safe injection system resumes if failures in injection pumps, booster pumps, safety valves, and other devices occur on the ground during CO2 injection. A skid-mounted device for pressure relief and venting measurement and evaluation was used to measure and monitor the amount and concentration of CO2 released during the pressure relief. If the pressure relief gas was collected and recovered to the injection system through the skid-mounted device, the pressure relief discharge would not be accounted for, and the calculation formula used for the pressure relief discharge without recovery was as follows:
\[{{E}_{Pv,y}}={{\rho }_{\text{C}}}\sum\limits_{k=1}^{{{n}_{k}}}{{{Q}_{k}}{{\varphi }_{C,k}}}+{{\rho }_{\text{G}}}GWP\sum\limits_{k=1}^{{{n}_{k}}}{{{Q}_{k}}{{\varphi }_{\text{G},k}}}\]
CO2 has a high solubility in crude oil, and its solubility increases with pressure. Therefore, liquid produced by CO2 flooding is more easily emulsified than that produced by water flooding. CO2 dissolved in oil and water desorbs at transfer stations, joint stations, settling tanks, and other process units and escapes into the atmosphere with associated gas. The measuring and accounting of the released CO2 from these parts directly are difficult. The actual measurement should be used based on the CO2 solubility in the produced oil and water, exported crude oil, and purified water under different temperature and pressure conditions. The actual measurement is prioritized in the CH4 emissions accounting for the surface processes of oil and gas production, and the default value method is used when there are no actual measurement values.
${{E}_{\text{Pe},y}}=\sum\limits_{t=1}^{{{n}_{t}}}{{{Q}_{\text{pl,}t}}}({{S}_{\text{pl,}t}}-{{S}_{\text{ow,}t}})+GWP\sum\limits_{m=\text{1}}^{{{n}_{m}}}{{{N}_{m,y}}E{{F}_{\text{G,}m}}}$
1.5. Leakage accounting
The potential leakage emissions of the CCUS-EOR project activities are leakage from CO2 transportation, injection and production, and storage in formations.
${{E}_{\text{L,}y}}={{E}_{\text{TL},y}}+{{E}_{\text{WL},y}}+{{E}_{\text{FL},y}}$
There are two methods of CO2 land transportation: tank cars and pipelines. The CO2 leakage caused by the tank car loading, unloading loss, and pipeline sealing damage between the CO2 capture and CO2 oil displacement and storage sites was calculated as follows:
${{E}_{\text{TL},y}}={{Q}_{\text{in},y}}-{{Q}_{\text{out},y}}$
The leakage paths of CO2 flooding and storage include wellbore and formation leakages. When the integrity of the wellbore is compromised, there is generally high sustained pressure in the annulus of the injection wells, making the wellbores prone to leakage. The fluid expansion caused by the temperature change in the casing, pressure exerted on the annulus by downhole operations, and annular gas crossflow formed by the decrease or failure of the wellbore barrier system can lead to pressure in the wellbore annulus [9]. The annular pressure caused by temperature and pressure changes can be eliminated through wellhead pressure relief to avoid the formation of continuous pressure, and the amount and concentration of CO2 can be measured and monitored through pressure-relief metering devices. In ensuring the safety of injection wells and avoiding sudden wellbore leakage, well recompletion is essential for those hidden danger wells with abnormal evaluation parameters and pressure in the annulus after multiple depressurizations, and it is deemed to have no wellbore leakage emissions if the pressure relief emissions are recovered; otherwise, the pressure relief emissions can be calculated based on pressure relief measurement and monitoring data from depressurization.
Sudden leakage at the wellhead is typically calculated using leakage prediction models. When sudden leakage occurs in wellbores during CO2 flooding, the leakage emissions are usually calculated comprehensively using appropriate leakage prediction models and monitoring data to ensure accuracy and are certified by a CO2 leakage safety risk assessment for wellbores. Prediction models of wellbore leakage in CO2 flooding include the diffusion model that refers to toxic gas and the drift flux model [10-11]. The calculation of CO2 leakage emissions in the wellbore was as follows:
${{E}_{\text{WL},y}}=\sum\limits_{w=1}^{{{n}_{w}}}{{{V}_{\text{WL,}w,y}}{{\rho }_{\text{C,}w}}\times {{10}^{-3}}}+T\sum\limits_{w=1}^{{{n}_{w}}}{{{Q}_{\text{ls,}w,y}}{{\varphi }_{\text{C},w}}}\times {{10}^{-3}}$
Formation leakage includes the leakage of CO2 along the cracks and faults of the sealed geological body and permeates from the caprocks over a long period. The CO2 fluid injected into the reservoir spread to the cracks and faults and migrated toward the upper permeable layer, and the CO2 was trapped partially. The leaked CO2 will not migrate to the surface if the amount of CO2 leaked initially is less than the summation of CO2 absorbed by each permeable layer along the cracks and faults; otherwise, there is a risk of formation leakage. The formation leakage emissions cannot be calculated directly. The leakage prediction model must be based on the permeability of the fracture system and the parameters of each permeable layer combined with qualitative and quantitative assessments in safety monitoring of the formation, surface water and underground water, and atmosphere. Usually, multiple permeable layers and caprocks are above the reservoir stratum for CO2 oil displacement and storage, and the formation pressure decreases with the leakage. The probability of CO2 formation leakage is relatively small during the certification period of the CCUS-EOR projects. The formation leakage emissions accounting during the project certification period requires the collection of monitoring and measurement data of CO2 concentration in the formation, surface water and underground water, and atmosphere. The calculation method was as follows:
\[{{E}_{\text{FL,}y}}={{\rho }_{\text{C}}}{{V}_{\text{lg},s,y}}\sum\limits_{s=1}^{{{n}_{s}}}{\left( {{\varphi }_{\text{m},s,y}}-{{\varphi }_{\text{b},s,y}} \right)}\]
Evaluation of the integrity of the reservoir and caprock indicated that CO2 leakage from the caprock had little impact on the surface in the short term. Therefore, only formation leakage emissions need to be considered in the carbon reduction emissions accounting for the entire cycle of the CCUS-EOR projects. Formation leakage emissions were predicted as follows: there was no formation leakage when the result was negative.
\[{{E}_{\text{FL},y}}=\sum\limits_{f=1}^{{{n}_{f}}}{{{Q}_{\text{ffl},f,y}}-\sum\limits_{p=1}^{{{n}_{p}}}{{{Q}_{\text{pll},p,y}}}}\]
1.6. Emission reduction accounting method of CCUS-EOR project
The emission reduction accounting method of the CCUS-EOR project is based on the project boundary definition and determination of baseline scenarios. The net emission reduction of CCUS-EOR projects is the project emissions and leakage emissions deducted from the baseline emissions.
\[{{E}_{\text{R,}y}}\text{ = }{{E}_{\text{B,}y}}-{{E}_{\text{P,}y}}\text{ }-{{E}_{\text{L,}y}}\]
2. Data and parameters to be monitored
Based on the data parameters required for the emission reduction calculation and the prediction of leakage accounting in the aforementioned methods, monitoring plans for the CCUS-EOR projects need to be developed, and a monitoring and measurement system for the entire process needs to be established to improve the accuracy of the calculation, reduce the risk of leakage from CO2 flooding and storage, and ensure long-term safety and efficacy in CO2 storage.
The accuracy of energy consumption data is the foundation of emissions accounting for CCUS-EOR projects, which are mainly monitored and measured through electricity meters, fossil fuel management accounts or purchase contracts, and other measurement instruments, and serve as the source data for carbon emissions accounting of the CCUS-EOR project for backup and verification.
The multidimensional dissipation and leakage monitoring system is the foundation for accurately predicting and calculating the dissipation and leakage emissions of CCUS-EOR projects and guarantees the safe operation of the projects. The deployment of CO2 dissipation and leakage monitoring points is relatively complex. The CO2 dissipation and leakage monitoring system includes mathematical modeling of the fractures, faults, and caprock of geological bodies for CO2 storage, microseismic monitoring, soil carbon flux monitoring, CO2 carbon isotopes monitoring, monitoring of the CO2 concentration of the atmosphere, and the skid-mounted metering using pressure relief as a measurement. Microseismic monitoring can evaluate the possibility of inducing fractures and other phenomena after CO2 injection, monitor the distribution status of the CO2 displacement front and the dominant direction in the reservoir stratum [12-13], combine the distribution of cracks and faults, and predict the direction of CO2 migration along the faults to ultimately determine the boundaries for shallow and atmospheric monitoring.
To determine the spread range of CO2 in the reservoir stratum and the location of gas channeling wells, we monitored the changes in the carbon content and flux of the soil at the CO2 injection wells to assess CO2 formation leakage. The monitoring points were determined according to the selection principle of well selection, and shallow monitoring wells were installed to monitor the CO2 concentration in the atmosphere and groundwater within the accounting boundary by CO2 concentration detectors. The wellbore leakage monitoring system is effective for the integrity of the wellbore. Dissipation monitoring includes regularly measuring the content of CO2 in the associated gas and solubility in the produced oil and water and metering the amount of CO2 discharged from pipelines, wellbores, and operations.
3. Case analysis
3.1. Carbon emission reduction accounting of CCUS-EOR industrial demonstration project in Jilin oil field
The CCUS-EOR industrial demonstration project in Jilin oil field has been in operation since 2007 and is the largest and longest running CCUS-EOR project in China. The CO2 stored in this project is from the gas associated with the Changling gas field, which is a Cretaceous Yingcheng Formation, and the CO2 content in this gas reservoir is approximately 20%. In fulfilling the technical requirements of commercial natural gas, CO2 must be separated and decarbonized using ammonia and MDEA. Heavy concentrations of CO2 were transported to the Hei-46 injection station by pipeline after being pressurized to 2.5 MPa. Depending on the transportation environment, distance, and quantity of CO2 of different injection wells, CO2 needs to be recompressed after temperature, pressure, and separation control and transported to CO2 injection wells by pipelines to enhance oil recovery. The produced liquids from production wells enter into a two-phase separator after being transported through the annular mixing transportation pipelines, and the separated CO2 is reinjected cyclically into the reservoir with the CO2 from the Changling gas field after being purified by removing the oil and water and pressure swing adsorption.
The carbon emission reduction accounting boundary of the CCUS-EOR project in Jilin oil field starts with the CO2 compressor of the natural gas purification plant and ends with the predicted diffusion range of the potential leakage from the formation and wellbore, including the CO2 pipeline of 11.3 km and the ground system that involves CO2 injection, oil and CO2 gathering and transportation, CO2 recovery, and purification processes. The baseline emissions of the project include two parts: CO2 discharged into air after natural gas purification and separation and the energy consumption emissions and fugitive emissions from oil field development by water flooding. The project emissions are from the energy consumption, dissipation, and leakage of the energy consumption devices added in CO2 flooding.
The emission analysis is as follows: (1) The high concentration CO2 source is separated after natural gas purification without the energy consumption of CO2 capture included. (2) The additional emissions from pipeline transportation are the indirect emissions generated by power consumption of CO2 compressors. The main emissions in the CO2 injection process are generated by the energy consumption of the tertiary injection compressor units in the Hei-46 injection station, and there is no additional energy consumption during transportation from the Hei-46 injection station to each injection well by the CO2 pipeline. Oil, gas, and water enter the annular mixing transportation pipelines from the production wells and are physically separated in the two-phase separator at the transfer station without any additional energy consumption. The additional emissions from the associated gas purification process originate from the indirect emissions generated by the power consumption of the multilevel oil and water removal device and pressure swing adsorption. The calculation parameters for dissipation and leakage emissions accounting are from the data from the device monitoring the CO2 concentration change in the atmosphere, near-surface, and wellbores and the CO2 leakage prediction models. For effective monitoring of the leakage situation, for Jilin oil field, the monitoring method “soil carbon flux - carbon isotope - shallow fluid composition” [14-15] was optimized and established, which includes monitoring the near-surface CO2 concentration by using the portable infrared CO2 concentration monitor, monitoring the carbon content and flux of soil at the CO2 burial site by using LI-8100A automatic soil carbon flux meter, and monitoring the fluid components within the target layer by underground shallow monitoring.
Soil carbon flux monitoring is suitable for leakage monitoring of the entire process of CO2 flooding and storage, which is the main leakage monitoring technology in the world. By monitoring the CO2 flux in the surface soil and comparing it with the background value before CO2 injection, if the carbon flux increases by more than 10%, the leakage of CO2 stored in the project can be determined. The CO2 injection wells were centered by setting up test points in eight directions for soil carbon flux monitoring. The change in the value of carbon flux in the soil monitored within the certification period and the background value measured when the project was not implemented was between approximately -2.38% and 2.77%, which indicates that the CO2 injected in the CCUS-EOR project in the Jilin oil field was stored safely without leakage.
Shallow fluid component monitoring was used to monitor the composition of gas samples in the monitoring wells and compare them with background values at regular intervals to determine the CO2 leakage. If the CO2 concentration increases by more than 10%, CO2 leakage can be determined. The analysis data of the monitoring wells in Jilin oil field show that the CO2 concentration is stable, and the change is within 10%; thus, there is no CO2 leakage in the wellbores (Table 2 ).
Table 2. Comparison of changes in main gas components of shallow monitoring wells in Jilin oil field |
| Year | Component proportion/% | |||
|---|---|---|---|---|
| N2 | O2 | CH4 | CO2 | |
| 2019 | 76.240 | 20.640 | 0.002 | 0.180 |
| 2020 | 76.290 | 20.570 | 0.003 | 0.170 |
| 2021 | 78.400 | 20.480 | 0.003 | 0.170 |
Based on the energy consumption parameters of all devices and the monitoring data of the CCUS-EOR project in Jilin oil field in 2020 and 2021, an accounting of the energy consumption emissions, dissipation and leakage emissions, and carbon reduction emissions of the project was conducted according to carbon emission reduction accounting methods (Table 3 ).
Table 3. Summary of carbon emission accounting of CCUS-EOR Project in Jilin oil field |
| Year | Baseline emissions/t | Project emissions/t | Leakage emissions/t | Emission reduction | ||||||||
|---|---|---|---|---|---|---|---|---|---|---|---|---|
| CO2 emissions of water flooding | Quantity of CO2 purchased | Quantity of CO2 injected | Capture | Compression | Pipeline | Injection | Gathering and transportation system | Pipeline | Wellbore and formation | Net emission reduction/t | Net emission reduction efficiency/% | |
| 2020 | 17 809 | 198 630 | 245 852 | 0 | 8804 | 0 | 8 888 | 17 809 | 0 | 0 | 180 938 | 91.09 |
| 2021 | 17 844 | 203 378 | 254 065 | 0 | 8863 | 0 | 9 295 | 17 844 | 0 | 0 | 185 220 | 91.07 |
As shown in Table 3 , the CCUS-EOR project in Jilin oil field has a net emission reduction efficiency of 91.1% under the existing burial rate of 80%. Approximately 20% of the CO2 injected in Jilin oil field needs to be recycled and reinjected after purification. The CO2 burial efficiency decreases gradually when the CO2 injection volume is greater than 0.5-0.6 in hydrocarbon pore volume along with the project operation. Therefore, CO2 injection is often terminated when the injection volume is less than 0.6 hydrocarbon pore volume in traditional CO2 flooding schemes [16]. The net emission reduction efficiency of the project gradually decreases owing to the increase in energy consumption emissions generated by the purification, compression, and reinjection of the increasing associated CO2. Thus, reasonable adjustment is necessary to expand the swept volume and decelerate gas channeling to reduce the ineffective circulation of injected CO2.
3.2. Carbon reduction emissions accounting for CCUS-EOR projects with different CO2 concentrations and scales
To simulate and estimate carbon reduction emissions of the two CCUS-EOR projects with different CO2 concentrations and scales, we used 100 million tons of low- concentration CO2 from a coal-fired power plant a short distance from Jilin oil field and 40 million tons of high- concentration CO2 gas from the hydrogen production process of a refinery transported by a long CO2 pipeline. An accounting of the actual carbon reduction emissions and leakage should be conducted based on the measurement and monitoring data from the certification period.
The calculation boundary of the CO2 capture process in the low CO2 concentration CCUS-EOR project starts with the induced draft fan of the capture device and ends with the compressors. The primary energy-consuming devices include absorption towers, desorption towers, and compressor units. The volume fraction of CO2 in the feed gas is approximately 15%, with a temperature of 50-60 ℃ and a pressure of 0.1 MPa, and the volume fraction increases to more than 99.5% (dry basis) after being captured and compressed. The energy consumption of CO2 capture in coal-fired power plants is 1.6-3.5 GJ/t in CCUS-EOR demonstration projects operated in China, and the energy consumption in the coal chemical industry is 0.7-2.5 GJ/t owing to the differences in CO2 concentration and capture technologies. Based on the energy consumption parameters from CO2 capture from the flue gas of coal-fired power plants schemes, the additional emissions are approximately 0.523 t per ton of CO2 captured, which include approximately 0.125 t generated by power consumption and approximately 0.37 t generated by steam (pressure 0.4 MPa). Electricity and steam are the most important components of energy consumption for CO2 capture in low-concentration gas sources.
The main energy consumption devices within the accounting boundary of CCUS-EOR projects with high-concentration CO2 sources include compressor units, dryers, and condensers because the CO2 source can be compressed and used directly when its volume fraction exceeds 90%. Based on the actual data of the hydrogen production process in multiple domestic refineries, the pressure of CO2 in the feed gas is approximately 0.10-0.25 MPa. The volume fraction of CO2 compressed varies depending on the feed gas composition. Pressure is determined by the transmission requirements, including the transportation mode, distance, pipe diameter, and ground elevation differences.
The energy consumption of pressurization along the pipelines was not considered for short-distance pipelines. The economic analysis of increasing the pressure of CO2 at the pipeline inlet or setting up booster stations along the pipelines must be evaluated in terms of investment in long-distance pipelines. CO2 oil displacement and storage were scaled up based on the existing accounting data of Jilin oil field without formation, wellbore leakage, and pipeline leakage owing to the ground sealed system and sealing reservoirs and caprocks.
The CO2 baseline emissions were 109.1×10⁴ t/a, with a low-concentration flue gas emission of 100×104 t/a and baseline emissions of 9.1×10⁴ t/a for water flooding through rough accounting and predicting the energy consumption, leakage, and carbon emissions in the low- concentration simulation project. The CO2 emissions were 72×104 t/a after the implementation of the CCUS- EOR simulation project, including energy consumption emissions of approximately 52.3×10⁴ t/a from CO2 capture, 6.1×10⁴ t/a from CO2 compression, and 13.6×10⁴ t/a from CO2 flooding. The project reduced CO2 emissions by 100×104 t/a through capture, but the certified emission reduction was approximately 37.1×10⁴ t/a. The net emission reduction is at a low efficiency even under the ideal condition that there is no CO2 leakage during the project certification period, except for force majeure leakage, because of the recovery and utilization of CO2 dissipated from pipelines and devices of injection-gathering transportation processes controlled by the ground sealed system.
The baseline emissions and project emissions accounting and prediction of the high-concentration CCUS- EOR project include the CO2 baseline emissions of the project of 43.6×10⁴ t/a, the project emissions of 8.1×10⁴ t/a with energy consumption and emissions from CO2 compression and purification of 2.7×10⁴ t/a, and CO2 flooding process energy consumption emissions of 5.4×10⁴ t/a. The net emission reduction efficiency of high-concentration CCUS projects can reach 88.9% owing to the absence of energy consumption emissions from CO2 capture, which accounts for the largest proportion of CO2 emissions.
The energy consumption of low-concentration CO2 capture technologies is so high that the net emission reduction efficiency of CCUS-EOR projects with low-concentration CO2 sources remains low, and technological research and development and energy efficiency optimization need to be strengthened to reduce secondary emissions. The CCUS-EOR project should focus on high- concentration CO2 sources from coal chemical industries, hydrogen production, and associated gases to enhance net emission reduction efficiency and certified voluntary emission reductions at this stage.
4. Conclusions
The emission reduction of the CCUS-EOR project is influenced by various factors, such as the concentration of CO2 captured, energy consumption and efficiency, burial efficiency, metering system, and leakage monitoring technology. The accounting results of the CCUS-EOR project in the Jilin oil field and the accounting prediction results of the simulation project show that the concentration of CO2 captured is the most important factor affecting the net emission reduction of CCUS-EOR projects. Revolutionary technologies and energy efficiency improvements are required for CO2 capture to reduce project emissions within accounting boundaries. The different types of energy consumed (e.g., electricity, natural gas, and coal) in CO2 capture, transportation, and oil displacement and storage resulted in significant differences in the project’s emissions. The electrification level of CO2 capture, oil displacement, and storage technology increased, and the secondary emissions generated by CCUS projects decreased with improvements in electrification.
The accuracy and completeness of the measurement and monitoring data are the foundation of the CCUS-EOR project's emission reduction accounting. The measurement and monitoring data of the dissipation emissions from ground processes are difficult to obtain because the oil, gas, and water measurement systems used in CO2 flooding are the original measurement systems for water flooding. A comprehensive, standard measurement system designed and set specifically for the dissipation and leakage emissions should be established according to the measurement requirements of each section to ensure that the basic data required for quantification and certification are detailed and traceable. An intelligent monitoring system that fits the accounting requirements has not been established because the deployment of monitoring points for CO2 flooding and storage leakage is not systematic, with low degree of intelligence and absence of continuous, live monitoring data. In accounting for the leakage emissions of CCUS-EOR projects accurately, the core tasks are used to accelerate the iteration of leakage monitoring technology, set monitoring point standards, and quantify monitoring data reasonably.
The carbon emission reduction of the CCUS-EOR project throughout the life cycle is the cumulative emission reduction accounted for during the operation period, with dissipation emissions and leakage emissions monitored after the CCUS-EOR project closure was deducted, which are related to the monitoring time required by the government and the integrity of the reservoir and caprock. The report will not provide further research on the carbon emission reduction of the CCUS-EOR project throughout the life cycle, owing to the absence of valid data on CCUS-EOR project closures.
This methodology conforms to the emission characteristics of the CCUS-EOR technology and is applicable to carbon emission reduction accounting during the certification period, providing a decision-making basis for the planning and deployment of CCUS-EOR clusters.
Nomenclature
Eac—average power consumption of CO2 capture and compression in three years prior to the project activities, MW·h/t;
EaE—average power consumption of CO2 flooding in three years prior to the project activities, MW·h/t;
Eap—average power consumption of production in three years prior to the project activities, MW·h/t;
Eas—average power consumption of CO2 storage in three years prior to the project activities, MW·h/t;
Eat—average power consumption of CO2 transportation in three years prior to the project activities, MW·h/t;
Eaw—average power consumption of water flooding in three years prior to the project activities, MW·h/t;
EB,y—baseline emissions in year y, t;
EC,y—baseline emissions of exhausted gas and associated gas from industrial facilities in year y, t;
Ecc,y—baseline emissions of power and fossil fuel consumption in CO2 capture, compression and transportation in year y, t;
EC,i,y—power consumption of energy consumption device i in CO2 capture in year y, MW·h;
EE,i,y—power consumption of energy consumption device i in CO2 flooding and storage in year y, MW·h;
EEOR,y—baseline emissions of CO2 flooding and storage in year y, t;
EFL,y—CO2 formation leakage emissions in year y, t;
EG,y—CH4 fugitive emissions from oil and gas production in water flooding and polymer flooding in year y, t;
EL,y—leakage emissions in year y, t;
EP,y—project emissions in year y, t;
EPC,y—carbon emissions energy consumption in CO2 capture and compression in year y, t;
EPE,y—carbon emissions energy consumption in CO2 flooding and storage in year y, t;
EPe,y—CO2 and CH4 dissipation emissions from oil and gas production in year y, t;
EPT,y—carbon emissions energy consumption in CO2 transportation in year y, t;
EPv,y—CO2 and CH4 fugitive emissions from oil and gas production in year y, t;
ER,y—carbon emissions reduction in year y, t;
Es,y—baseline emissions of hard-to-develop and depleted reservoirs and saline aquifers in year y, t;
ETL,y—leakage emissions of transportation in year y, t;
ETr,i,y—power consumption of energy consumption device i in CO2 transportation in year y, MW·h;
Etr,y—carbon emissions of power and fossil fuel consumption in CO2 capture, compression and transportation in year y, t;
EWL,y—wellbore leakage emissions in year y, t;
EFe—average CO2 emission factor of the power grid, 0.570 3 t/(MW·h);
EFG,m—CH4 fugitive emissions factor of device m in crude oil extraction, t/unit;
EFj—CO2 emission factor of fossil fuel in capture, compression, transportation, CO2 flooding and storage for fossil fuel j, t/GJ;
EFs,y—CO2 emission factor of steam, data provided by supplier with priority, or 0.11 t/GJ;
f—number of crack;
Fac,j —average consumption of fossil fuel j for CO2 capture and compression in three years prior to the project activities, t/t;
FaE,j—average consumption of fossil fuel j for CO2 flooding in three years prior to the project activities, t/t;
Fap,j—average consumption of fossil fuel j for production in three years prior to the project activities, t/t;
Fas,j—average consumption of fossil fuel j for CO2 storage in three years prior to the project activities, t/t;
Fat,j—average consumption of fossil fuel j for CO2 transportation in three years prior to the project activities, t/t;
Faw,j—average consumption of fossil fuel j for water flooding in three years prior to the project activities, t/t;
FC,j,y—consumption of fossil fuel j for CO2 capture in year y, t;
FE,j,y—consumption of fossil fuel j for CO2 flooding and storage in year y, t;
FTr,j,y—consumption of fossil fuel j for CO2 transportation in year y, t;
GWP—global warming potential of CH4, t/t;
i—numbers of energy consumption device;
j—types of fossil fuel consumed;
k—numbers of pressure-relief valve in CO2 flooding;
m—numbers of device utilized in crude oil extraction;
n—the sum of energy consumption device;
nf—the sum of crack;
nj—the types of fossil fuel consumed, the value is 0 without fossil fuel consumed;
nk—the sum of pressure relief valve in CO2 flooding, the value is 0 without pressure relief;
nm—the sum of device utilized in crude oil extraction;
np—the sum of permeable layer;
ns—the sum of monitoring points;
nt—the sum of time quantum monitoring the CO2 solubility in produced oil and water, exported crude oil and purified water, the value is 0 without CO2 solubility monitoring;
nw—the sum of wellbore leaked, the value is 0 without wellbore leakage;
NCVj—net calorific value of fossil fuel j, GJ/t;
Nm,y—the sum of leakage device utilized in crude oil extraction in year y, unit;
p—the number of permeable layer;;
PC,y—the quantity of CO2 captured from industrial facilities and associated gas in year y, t;
PP,y—the quantity of production from industrial facilities in year y, t;
QC,y—the quantity of produced fluids in CO2 flooding in year y, t;
QCs,y—the quantity of CO2 storaged in year y, t;
Qffl,f,y—the quantity of CO2 leaked from crack f, the predicted data adopted from crack leakage prediction model, t;
Qin,y—the quantity of CO2 inlet into the metering device of transportation system in year y, t;
Qk—the quantity of gas from pressure relief valve and dissipation point, 104 m3;
Qls,w,y—the leakage rate of sudden leakage of wellbore w in year y, kg/s, the data include the predicted from wellbore leakage prediction model and monitoring data, kg/s;
Qout,y—the quantity of CO2 delivered to the metering device of receiving station at oil field in year y, t;
Qpl,t—the quantity of produced fluids in CO2 flooding in monitoring time quantum t, t;
Qpll,p,y—the quantity of CO2 trapped by permeable layer pin year y, the predicted data adopted from crack leakage prediction model, t;
Qw,y—predicted production of crude oil produced by water flooding in year y, t;
s—the number of monitoring points;
SC,i,y—consumption of stream for CO2 capture in year y, GJ;
Spl,t —CO2 solubility in produced fluids during monitoring time quantum t, g/g;
Sow,t —CO2 solubility in exported crude oil and purified water during monitoring time quantum t, g/g;
t—the number of time quantum monitoring the CO2 solubility in produced oil and water, exported crude oil and purified water;
T—leakage time, s;
Vlg,s,y—the volume of dissipation emissions from of monitoring point s in year y, the data adopted from formation leakage prediction model, m3;
VWL,w,y—the volume of pressure-relief discharge from wellbore w in year y, m3;
w—the number of wellbore leaked;
y—certification year;
ϕb,s,y—the baseline volume fraction of CO2 in atmosphere at the monitoring point s when the CCUS project was not implemented in year y,10-6;
ϕC,k—the volume fraction of CO2 in pressure-relief from valve k and dissipation,%;
ϕC,w—the volume fraction of CO2 in sudden leakage of wellbore w, the data adopted from wellbore leakage prediction model, dimensionless;
ϕG,k—the volume fraction of CH4 in pressure-relief from valve k and dissipation,%;
ϕm,s,y—the monitoring volume fraction of CO2 in atmosphere at the monitoring point s in year y, 10-6;
ϕC, ϕG—the density of CO2 and CH4 in standard state, ϕC=19.7 t/104 m3, ϕG=7.17 t/104 m3;
ρC,w—the mass concentration of pressure-relief discharge from wellbore w, kg/m3.