

Introduction
Researches on reservoir diagenesis and fluid activity in overpressure environments began in 1953 when Dickinson identified fluid pressure anomalies in sedimentary basins along the Gulf Coast of the United States [1-2]. Previous researches on abnormal fluid pressure (i.e., overpressure) focused on the formation mechanism of abnormal fluid pressure [3⇓⇓-6], the relationship between overpressure and changes in authigenic minerals and clay minerals in reservoirs [2,7⇓⇓⇓ -11], the relationship between overpressure and primary pores, secondary dissolution pores, and changes in reservoir physical property [12⇓⇓⇓-16], and the simulation to the quantitative effect of overpressure on reservoir pore evolution[17-18]. The overpressure developed in source rocks is mainly related to hydrocarbon generation and diagenesis. Overpressure in non-source rocks is mainly influenced by factors such as non-uniform compaction, diagenesis, and pressure transfer. The overpressure in conglomerate is caused by pressure transfer [19]. With more researches on deep reservoirs, the qualitative relationship between overpressure and mechanical compaction has been widely recognized. However, there are few researches on the mechanism of overpressure on skeleton particles and various physical changes of deep reservoirs, and comparison with the physical changes of skeleton particles at hydrostatic pressure, especially no research on the quantitative relationship based on diagenetic physical simulation. For the deep layers in the southern margin of Junggar Basin in western China (the Southern Junggar Basin in brief), many years of exploration practice and research demonstrate that hydrocarbon accumulation and exploration in the thrust zone in the Southern Junggar Basin is closely related to the "abnormal fluid pressure zone" [20]. After breaking through the abnormal fluid pressure zone of the Cretaceous Tugulu Group, ultra-deep oil and gas reservoirs (in ultra-deep wells GT1 and HT1) were discovered [20], indicating that overpressure plays an important role in the formation of deep oil and gas reservoirs. Taking the lithic sandstone of the Jurassic Toutunhe Formation in the Southern Junggar Basin, NW China, as a case, this paper studies the changes in primary pores, the changes in skeleton particles, and the development of microcracks in brittle minerals in the skeleton particles of the lithic sandstone in the burial diagenesis process at abnormal fluid pressure through diagenetic physical simulation. By comparing the development characteristics of primary pores and microcracks in the lithic sandstone at hydrostatic pressure and overpressure, this paper quantitatively evaluates the effect of abnormal fluid pressure on the physical properties of the lithic sandstone reservoirs. The study on the overpressure mechanism on the physical properties of deep reservoirs is helpful to the breakthrough to deep oil and gas exploration.
1. Geological setting
The Southern Junggar Basin has segments in the east- west direction and zones in the north-south direction [20-21]. The western segment corresponds to the Sikeshu Sag, and it is separated from the middle segment by the boundary of the Hongshanzhen fault [21]. The middle segment extends eastward toward Urumqi, East Xinjiang, forming the Wukui anticline belt. The eastern segment is situated to the east of Urumqi. From south to north, there are a southern nappe zone, a transition zone, and a piedmont deformation zone, corresponding to the first, second, and third anticline belts, respectively [21] (Fig. 1 ).
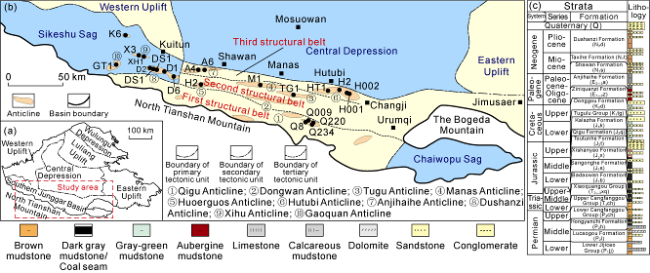
Fig. 1. Tectonic units and stratigraphic column in Southern Junggar Basin (adapted from Reference [21]). |
In recent years, significant advancements have been seen in deep oil and gas exploration in the Southern Junggar Basin. The Cretaceous Qingshuihe Formation in Well GT1 drilled in the Gaoquan Anticline in the western segment and Well HT1 drilled in the Hutubi Anticline in the middle segment has ultra-deep oil and gas reservoirs [22-23]. However, the deep lower reservoirs are less explored. Geological survey on field outcrops [24] found that the Middle and Upper Jurassic conglomerate is relatively shallow, extensively distributed and very thick. With good reservoir physical properties, the conglomerate is promising for deep oil and gas exploration [25], and is a potential target for future oil and gas exploration. Under the influence of rapid burial and strong tectonic compression since the Neogene, overpressure to varying degree has been widely distributed in the Southern Junggar Basin (Table 1 ). The lower play beneath the mudstone in the lower Cretaceous Tugulu Group is a high to extremely high overpressure system [20] (Fig. 1c ). The Kayindike area in the western segment is at normal pressure. However, the formation below 6000 m in wells GT1, DT1 and XH1 is overpressured in the Sikeshu Sag. The Qigu area in the central segment is at weak overpressure, and the Hutubi area at strong overpressure [30]. In conclusion, the deep and lower formations in the Southern Junggar Basin suffer from uneven compaction, lateral tectonic compression, and overpressure from hydrocarbon generation. Lateral tectonic compression from the Himalayan movement is a crucial factor on the development of overpressure, while hydrocarbon generation is the primary cause for overpressure in the Jurassic Sangonghe and Xishanyao Formations [30]. Since the Cretaceous, the deep and lower formations have undergone extensional sedimentation from the Cretaceous to Paleogene (K-E), and compressional and orogenic sedimentary erosion from the Neogene to the Quaternary (N-Q) [31]. Rapid sedimentation occurred during the transition from a tensile to a compressive tectonic dynamic environment, and created ideal conditions for undercompaction, geothermal pressurization and diagenetic transformation of clay minerals in three mudstone intervals in the underlying Neogene Taxihe Formation (N1t), Paleogene Anjihaihe Formation (E2-3a), and Cretaceous Tugulu Group (K1tg) [31].
Table 1. Formation pressure in some wells drilled in Southern Junggar Basin (adapted from References [26⇓⇓-29]) |
| Anticline | Well | Depth/m | Formation | Pressure/MPa | Pressure coefficient |
|---|---|---|---|---|---|
| Xihu Anticline | X3 | 3486.25 | N1s | 34.10 | 0.98 |
| Dushanzi Anticline | D1 | 1439.50 | N1s | 22.90 | 1.59 |
| D2 | 1687.50 | N1s | 30.50 | 1.81 | |
| DS1 | 1882.53 | E2-3a | 30.50 | 1.62 | |
| D6 | 1437.00-1442.00 | N1s | 22.94 | 1.62-1.63 | |
| 1683.00-2667.00 | E2-3a | 30.50-46.50 | 1.67-1.78 | ||
| 2765.70 | E2-3a | 65.90 | 2.40 | ||
| Qigu Anticline | Q009 | 1533.50 | J1s | 16.00 | 1.04 |
| 1993.00 | J1b | 26.20 | 1.31 | ||
| 2458.00 | T2-3 | 32.70 | 1.33 | ||
| Q8 | 2010.00-2030.00 | J1b | 25.62 | 1.27 | |
| 2715.00-2737.00 | T2-3 | 33.03 | 1.21 | ||
| Q220 | 1076.00-1083.00 | J1s | 13.89 | 1.29 | |
| Q234 | 1166.00-1174.00 | J1s | 16.33 | 1.40 | |
| Huoerguos Anticline | Huo2 | 1360.00-1420.00 | E2-3a | 1.90-2.20 | |
| Manas Anticline | M1 | E2-3a | 1.59-1.73 | ||
| Tugulu Anticline | TG1 | 1785.49 | E2-3a | 35.96 | 2.05 |
| 1840.00-1855.00 | E2-3a | 37.65 | 2.03 | ||
| 2591.10 | E1-2z | 46.68 | 1.84 | ||
| 3080.51 | K2d | 52.09 | 1.72 | ||
| Anjihaihe Anticline | A6 | 2765.70 | E2-3a | 65.90 | 2.40 |
| 3251.00-3270.60 | E2-3a | 76.19 | 2.34 | ||
| 3323.50 | E1-2z | 75.95 | 2.33 | ||
| 4100.00-4118.00 | K2d | 83.70 | 2.04 | ||
| 4159.00 | K2d | 85.96 | 2.11 | ||
| A4 | 2993.16 | E2-3a | 66.80 | 2.23 | |
| Hutubi Anticline | Hu2 | 2523.00-3516.00 | E2-3a—E1-2z | 32.10-57.51 | 1.30-1.67 |
| 3516.00 and below | K2d | 34.94-52.97 | 1.01-1.17 | ||
| H001 | 2523.00 | E2-3a | 43.14 | 1.70 | |
| 3587.00 | E1-2z—K2d | 34.68 | 0.97 | ||
| H002 | 2525.00 | E2-3a | 44.20 | 1.80 | |
| 3681.50 | E1-2z—K2d | 35.90 | 0.98 |
Note: N1s—Shawan Formation; E2-3a—Anjihaihe Formation; J1s—Sangonghe Formation; J1b—Badaowan Formation; T2-3—Middle Upper Triassic; E1-2z—Ziniquanzi Formation; K2d—Donggou Formation. |
2. Diagenetic physical simulation
The reservoir diagenesis simulation system [32] is composed of six reactors, an independent fluid system, and a control system. The six reactors simulate vertical mechanical compaction. Prepared samples are held in the sample tubes of the reactors. The physical simulation experiment is carried out by increasing temperature and pressure starting from the set temperature and lithostatic pressure. Fluid is injected into the reactors through the independent fluid system to gradually increase the fluid pressure in the reactors. First calcium chloride and sodium bicarbonate solutions are injected, followed by acetic acid solution to simulate the dissolution of acidic water. The entire experiment should be run in a semi-closed state and designed time frame, and covers the water-rock reaction between rock minerals and fluids at abnormal fluid pressure and hydrostatic pressure.
2.1. Samples
The analysis of the sandstone samples indicates the minerals of the Toutunhe Formation in the Southern Junggar Basin in Table 2 . The sample for diagenetic physical simulation is made of sand and mud samples that are evenly mixed according to the composition in Table 2 , and put into a metal sample tube, with sand at the top and mud at the bottom [33]. A sample in a reactor is composed of sand of approximately 11 cm thick, and mud of 3 cm thick.
Table 2. Composition of Toutunhe Formation samples in Southern Junggar Basin |
| Sample | Minerals/% | |||||
|---|---|---|---|---|---|---|
| Jurassic Toutunhe Formation | Rock fragments | Feldspar | Quartz | |||
| Tuff | Mudstone | Pelitic schist | Feldspar | Albite | ||
| 30 | 7 | 10 | 8 | 14 | 31 | |
| Total | 47 | 22 | 31 | |||
2.2. Parameters
2.2.1. Temperature and lithostatic pressure
The geothermal gradient in the Southern Junggar Basin ranges from 13.2 °C/km to 23.7 °C/km, and higher in the central Qigu fault-fold zone and the western Fukang fault zone [26]. We set 1.71 °C/100 m for our simulation. Sweeney et al. computed the Easy Ro value of organic matter, and rapidly got the Easy Ro value by subjecting it to high temperature. Although this high-temperature alteration replaces the maturation time of organic matter spanning millions of years, it is possible to compute the temperature for shale thermal simulation [34]. The Ro value serves as a significant criterion for segregating the diagenetic stages of reservoirs; therefore, a correlation between the diagenetic evolution stage of clastic rock and the temperature of thermal simulation can be established [35]. For instance, the Ro value during the initial diagenetic stage of clastic rock is below 0.5%; during the middle diagenetic stage A, it ranges from 0.5% to 1.3%; and during diagenetic stage B, it ranges from 1.3% to 2.0% [35]. Based on the Easy Ro values and thermal simulation experiment temperature from Sweeney et al. [34], the thermal simulation reaches ~280 °C when Ro = 0.5%, ~390°C when Ro = 1.3%, and ~450 °C when Ro = 2.0%. Considering our physical simulation experiment system, the experimental temperature for the early diagenetic stage is set to be between 230 °C and 285 °C, and that for the middle diagenetic stage A is between 285 °C and 365°C. The diagenetic evolution stages simulated are consistent with underground reservoir diagenetic evolution [36]. The crust's average density is approximately 2.75 g/cm3, and pressure increases by 27.5 MPa for every 1000 m increase in depth. In order to first meet the diagenetic and consolidating needs of sandstone, the lithostatic pressure equiproportionally increases [37] to compensate the compaction effect of 2000 m. Consequently, the lithostatic pressure is 82.5 MPa at 1000 m, and 268 MPa at 7766 m (Table 3 ).
Table 3. Experimental data at overpressure (1st and 2nd groups) and hydrostatic pressure (3rd group) |
| Depth/m | Temperature/°C | Lithostatic pressure/MPa | Fluid pressure/MPa | Overpressure gradient | Secondary dissolution porosity/% | Remaining primary porosity/% | Total porosity of thin section/% | Under overpressure | Length ratio of line contact length/% | |||||||||||||
|---|---|---|---|---|---|---|---|---|---|---|---|---|---|---|---|---|---|---|---|---|---|---|
| Under static pressure | Under overpressure | Under overpressure | Under static pressure | Under overpressure | Under static pressure | Under overpressure | Under static pressure | Interstitial material/% | Compaction rate/% | Porosity reduction rate/% | Dissolution rate/% | Under overpressure | Under static pressure | Difference | ||||||||
| 100 | 230 | 60.5 | 1 | <1 | 25.0 | 25.0 | 14.0 | 2.5 | 37.5 | 1.0 | 14.60 | |||||||||||
| 1000 | 250 | 82.5 | 10 | 25.0 | 2.50 | <1 | 22.0 | 22.0 | 15.0 | 7.5 | 45.0 | 1.2 | 11.25 | |||||||||
| 1585 | 260 | 99.0 | 16 | 36.0 | 2.25 | <1 | 20.5 | 20.5 | 14.0 | 13.8 | 48.8 | 2.0 | 14.11 | |||||||||
| 2470 | 275 | 123.0 | 25 | 45.0 | 1.80 | 1.0 | 19.0 | 20.0 | 16.0 | 12.5 | 52.5 | 2.5 | 15.96 | |||||||||
| 3048 | 285 | 140.0 | 30 | 50.0 | 1.70 | 2.5 | 13.0 | 15.5 | 14.0 | 32.5 | 67.5 | 6.3 | 15.17 | |||||||||
| 3940 | 300 | 164.0 | 39 | 59.0 | 1.50 | 2.0 | 13.0 | 15.0 | 16.0 | 27.5 | 67.5 | 5.0 | 12.88 | |||||||||
| 4511 | 310 | 180.0 | 45 | 65.0 | 1.44 | 3.0 | 1.0 | 11.5 | 9.5 | 14.5 | 10.2 | 11.0 | 43.8 | 71.3 | 7.5 | 17.62 | 29.49 | 11.87 | ||||
| 5400 | 325 | 204.0 | 54 | 74.0 | 1.37 | 2.0 | 2.0 | 12.0 | 6.3 | 14.0 | 8.3 | 10.0 | 45.0 | 70.0 | 5.0 | 19.64 | 30.59 | 10.95 | ||||
| 5680 | 330 | 211.0 | 57 | 76.0 | 1.33 | 2.0 | 10.5 | 12.5 | 8.0 | 53.8 | 73.8 | 5.0 | 24.81 | |||||||||
| 6295 | 340 | 228.0 | 63 | 82.0 | 1.30 | 2.0 | 2.0 | 10.0 | 9.2 | 12.0 | 11.5 | 9.0 | 52.5 | 75.0 | 5.0 | 14.95 | 37.18 | 22.23 | ||||
| 6850 | 350 | 243.0 | 69 | 88.0 | 1.28 | 3.5 | 3.0 | 7.0 | 6.4 | 10.5 | 9.4 | 9.0 | 60.0 | 82.5 | 8.8 | 23.68 | 34.72 | 11.04 | ||||
| 7766 | 365 | 268.0 | 78 | 97.0 | 1.24 | 2.5 | 4.0 | 7.5 | 3.5 | 10.0 | 7.5 | 10.0 | 56.3 | 81.3 | 6.3 | 29.20 | 31.39 | 2.19 | ||||
2.2.2. Fluid and overpressure
Coal seams are extensive in the Jurassic formations in the Southern Junggar Basin where the diagenetic environment is mainly acidic, and the formation water contains CaCl2 and NaHCO3. The experiment simulated the actual geological evolution process by adding 2% calcium chloride solution and 2% sodium bicarbonate solution in the early diagenetic stage. In the middle diagenetic stage A that simulates the conditions of 3048 m, 285 °C, and 140 MPa, we added 0.5% acetic acid to simulate the dissolution of minerals by acidic fluid.
Zhang et al. [26] analyzed the evolution of the overpressure system in the Southern Junggar Basin. Based on the actual formation pressure prediction curve of Well TG1, it is evident that overpressure developed gradually from the Paleogene Anjihaihe Formation to the underlying Cretaceous. In Well TG1, the pressure at 1000 m is 25 MPa, increases to 39 MPa at 2000 m, and further increases to 49 MPa at 3000 m, the formation pressure corresponding to 4000 m is 60 MPa, and the formation pressure coefficient decreases from about 2.5 to about 1.5 (Table 3 ). This is consistent with the actual measured decrease in the formation pressure coefficient of Well TG1 (Table 1 ). So a formula for the variation of depth (H) with formation pressure (p) in Well TG1 is:
The linear correlation coefficient R2 is 0.994 2. Using the formula, we calculated fluid pressure vs. simulated depth (Table 3 ).
2.2.3. Experimental days
We finished three groups of experiment, 17 d each and totally 51 d. The first and second groups were conducted at overpressure, and the third at hydrostatic pressure. Six sets of experimental results were obtained from each group (Table 3 ).
3. Reservoir pore characteristics at overpressure and hydrostatic pressure
The formation pressure coefficient from the Paleogene Anjihaihe Formation to the Cretaceous Donggou Formation in Well TG1 shows relatively complete and continuous variation from high to low, that is, the measured formation pressure coefficient decreases from 2.05 in the Paleogene to 1.72 in the Cretaceous (Table 1 ). The formation pressure coefficient simulated is consistent with the actual geological characteristics, and set to decrease from 2.5 at 1000 m to 1.25 at 7766 m (Table 3 ). After the experiment, we obtained the sandstone samples at different simulated depths, and then used OLYMPUS BX51 polarizing microscope and CITL CL8200 MK5-2 cathodoluminescence microscope to observe the reservoir pores at different depths, and analyzed the pore types and porosity changes of the deep reservoir in the Jurassic Toutunhe Formation.
3.1. Comparison of reservoir pore characteristics under overpressure and hydrostatic pressure
As illustrated in Figs. 2 , 3 and 4 , and Table 3 , at the simulated depth of less than 3000 m, namely in the early diagenetic stage, skeleton particles mainly float, and only a small portion of particles contact with each other. The formation pressure coefficient at this stage is 1.7-2.5. As overlying pressure and temperature increase, the contact type of particles becomes point to point, and a small amount of particles contact line to line. On the thin section of the reservoir sample, residual primary pores are dominant, and secondary pores are hardly found, indicating a low dissolution rate. The primary plane porosity stands at approximately 15% (Fig. 2a ), but reduces rapidly, even by 60% (Fig. 2b ). When the simulated depth is shallower than 3000 m, it is in stage A of intermediate diagenesis. At 7000 m to 8000 m, the formation pressure coefficient is 1.28 to 1.70, and the remaining primary plane porosity changes slightly. The porosity reduction increases from 60% to 80%, and the apparent compaction rate increases from 30% to 60%. Secondary dissolution pores are well developed, mainly caused by acidic water dissolving the edges of feldspar and rock fragments, and some interstitial matters, such as mud between particles (right in Fig. 3 ). Plane porosity is generally less than 3% (Fig. 2a ), and the total dissolution rate is less than 10%. As the simulated burial depth exceeds 7000 m, the remaining primary pores decrease slightly, and the apparent compaction rate, porosity reduction, and dissolution rate barely increase.
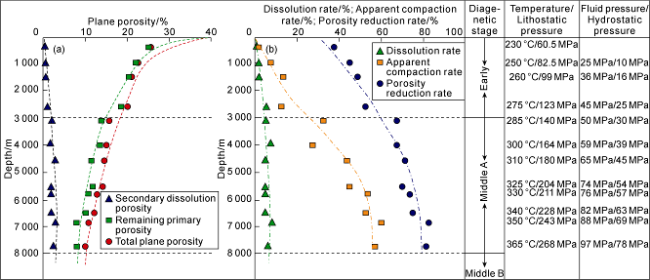
Fig. 2. Pore evolution and changes of some diagenetic parameters of sandstone of Jurassic Toutunhe Formation in Southern Junggar Basin at overpressure based on physical simulation experiments. |
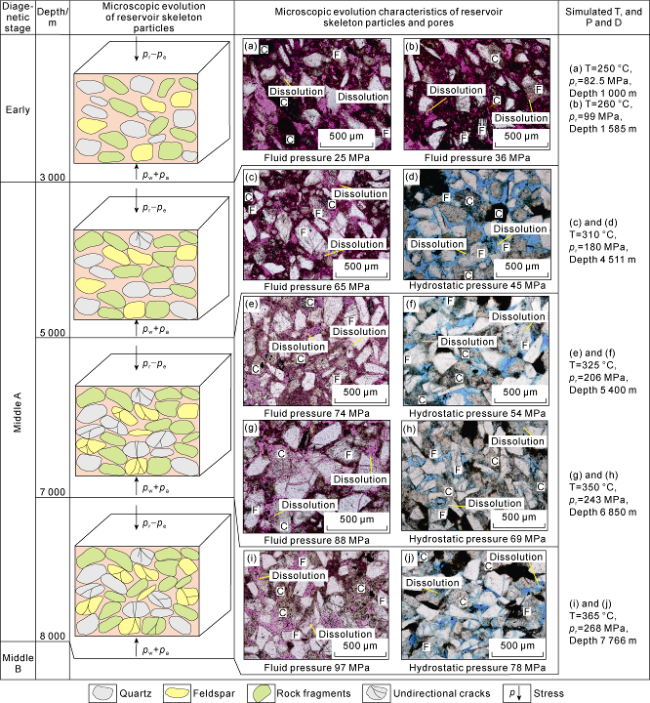
Fig. 3. Pore evolution of sandstone of Jurassic Toutunhe Formation in Southern Junggar Basin at overpressure and hydrostatic pressure based on physical simulation experiments (F-feldspar; C-rock fragments; pw+pa=pr-pe). |
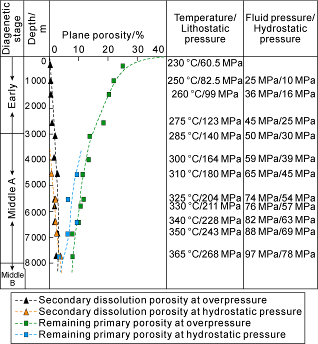
Fig. 4. Comparison of pore evolution trends of sandstone of Jurassic Toutunhe Formation in Southern Junggar Basin at overpressure and hydrostatic pressure based on physical simulations. |
The compaction rate shown in Table 3 is the ratio of the difference of the original pore volume, the volume of fillings and the volume of intergranular pores to the original pore volume. The reduction rate in porosity is the ratio of the difference of the original volume of pores and the volume of intergranular pores to the original volume of pores. The dissolution rate is the ratio of the volume of pores produced by dissolution to the original volume of pores. The analysis considers the original pore volume 40% [38]. The volume of fillings is taken as the content of the fillings. The remaining primary pores are taken as the intergranular pores (i.e., the plane porosity of the remaining primary pores in Table 3 ). The content of dissolution pores i.e., the plane porosity of dissolution pores in Table 3 , is taken as the dissolution pore volume.
At hydrostatic pressure, as the simulated depth increases, the porosity of secondary dissolution pores gradually increases, but it is constantly less than 4% (Table 3 and Fig. 4 ). In the primary pores, the plane porosity shows a gradual decrease as the simulated depth of increases. However, under overpressure conditions, the decreasing amplitude of the primary pores is less than that observed under hydrostatic pressure conditions (Table 3 and Fig. 4 ). The total porosity of thin sections is usually less at hydrostatic pressure than that at overpressure (Table 3 and Fig. 4 ).
3.2. Reasons for reservoir pore retention under overpressure
As sandstone reservoir is buried deeper, pressure from the overlying layers continues to increase, and mechanical compaction on the reservoir increases too, resulting in the decrease of the primary pores and the closer contact among the reservoir particles [32,37,39]. When abnormal fluid pressure reaches a certain level, fluid can replace rock skeleton particles to bear part overlying pressure. This can effectively prevent the continuous increase in mechanical compaction on the skeleton particles.
At hydrostatic pressure, at 4511 m, the plane porosity of the remaining primary pores is 9.5%, the formation pressure coefficient is 1.0, and the fluid pressure is 45 MPa. At 6295 m, the formation pressure coefficient is 1.0, the fluid pressure is 63 MPa, and the plane porosity of the remaining primary pores is 9.2%. 1 MPa increase in fluid pressure causes 0.02% decrease in the plane porosity of the remaining primary pores. At 7766 m, the formation pressure coefficient is 1.0, the fluid pressure is 78 MPa, and the plane porosity is 3.5%. Increase of 1 MPa in the fluid pressure results in 0.32% decrease in the plane porosity.
Comparative analysis indicates that at the same lithostatic pressure (mechanical compaction), when depth increases from 3000 m to around 6000 m, the decrease in remaining primary pores caused by mechanical compaction at overpressure is not significantly different from that at hydrostatic pressure. When fluid pressure increases by 1 MPa, the plane porosity of remaining primary pores is between 0.02% and 0.09% (both values are below 0.1%). When depth increases to more than 6000 m, or even up to 8000 m, mechanical compaction at hydrostatic pressure reduces the remaining primary pores by approximately twice that at overpressure. Specifically, at hydrostatic pressure, increasing fluid pressure by 1 MPa results in 0.32% decrease in the plane porosity of remaining primary pores. In an overpressure environment, the plane porosity of remaining primary pores decreases by 0.17% when fluid pressure increases by 1 MPa. This suggests that mechanical compaction weakens the reduction of porosity in deep and ultra-deep reservoirs at overpressure. Additionally, abnormal fluid pressure can effectively suppress mechanical compaction, and better preserve primary pores among particles.
4. Contact among reservoir skeleton particles
4.1. Contact among reservoir skeleton particles at overpressure
To quantitatively analyze the mechanical compaction on sandstone reservoirs at overpressure and different depths, we use the linear contact length ratio, namely, the proportion of linear contact length of a skeleton particle to the circumference of the same particle. This ratio quantifies the linear contact length (L) between a skeleton particle and surrounding particles relative to the circumference (C) of the skeleton particle.
The criteria for selecting skeleton particles follow. First, choose the particle with a longer linear contact length. If the difference in linear contact length is insignificant, choose the particle with a smaller circumference. Second, consider the composition of skeleton particles. When the above conditions are not significantly different, first select quartz particles, followed by feldspar particles. Particles easy to plastically deform are excluded, such as mica and rock fragments.
As illustrated in Fig. 3 , at 3000 m, the skeleton particles are floating, and a small amount of particles contact point to point, and a smaller amount contact in a linear way. Below 3000 m, the skeleton particles are typically in point contact, and particles in linear contact become more. According to the relationship of linear contact length ratio (Rc) of particles varies with depth at overpressure (Fig. 5 and Table 3 ), in the early diagenetic stage, when the simulated depth is shallower than 3000 m, Rc is typically less than 15%. When the simulated depth is deeper than 4500 m, Rc ranges from 15% to 30%, showing a significant increase. At around 8000 m, Rc may reach 30%. However, compared to hydrostatic pressure conditions, Rc is much smaller, even the difference up to 22% between the two. This indicates that abnormal fluid pressure significantly inhibits particle compaction.
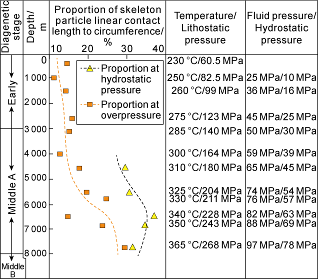
Fig. 5. Evolution of the proportion of skeleton particle linear contact length to circumference in Southern Junggar Basin at overpressure and hydrostatic pressure based on physical simulation experiments. |
4.2. Comparison of particles contact under overpressure and hydrostatic pressure
At hydrostatic pressure, skeleton particles experience a relatively large linear contact length, generally the linear contact ratio of particles (Rj) higher than 30%. As simulated depth increases, Rj first increases, and then decreases. Specifically, Rj gradually increases from 4511 m to 6295 m and then decreases from 6295 m to 7766 m. The maximum Rj is observed at 5900-6700 m.
As illustrated in Fig. 5 , Rj is consistently higher than Rc at the same depth. This suggests that mechanical com-paction is higher at hydrostatic pressure than at over- pressure at the same depth, as observed in two sample groups. Table 3 presents the difference between Rj and Rc at the same depth. At 4511-6295 m, the difference between Rj and Rc increases with depth. The difference decreases at 6295-7766 m. The maximum difference, 22.23%, occurs at 6295 m.
As depth increases from 4511 m to 6295 m, inhibition from overpressure to mechanical compaction gradually increases. However, downward from 6295 m, this inhibiting effect becomes weak. It is inferred that at depth shallower than 6295 m, overlying pressure is small, and overpressure can more effectively reduce mechanical compaction. As a result, sandstone reservoirs experience lower mechanical compaction at overpressure than at hydrostatic pressure at the same depth. Below 6295 m, the difference of mechanical compaction between overpressure and hydrostatic pressure no longer exhibits an increasing trend. Instead, it manifests a declining trend, signaling a weakening abnormal fluid pressure effect that resists effective stress to increase. This brings about a gradual approach of mechanical compaction at overpressure to that at hydrostatic pressure [33].
5. Development of microcracks in reservoir skeleton particles
5.1. Development of microcracks at overpressure
During rock burial and diagenesis, skeleton particles undergo continuous changes in overlying pressure. If the pressure surpasses the tensile or shear strength of the skeleton particles, the particles will crack [40]. The dominant skeleton particles in the sandstone of the Jurassic Toutunhe Formation in the Southern Junggar Basin, include quartz, feldspar, tuff fragments, rhyolite fragments, and schist fragments. Under the same mechanical compaction and structural compression, plastic minerals including tuff fragments, rhyolite fragments and schist fragments would not crack, but brittle minerals including quartz and feldspar will. This study only analyzes the length and width of microcracks in quartz and feldspar, and quantitatively investigates how they change with depth.
5.1.1. Microcrack length
As shown in Fig. 6 and Table 4 , the length of microcracks in quartz particles remains consistent above 3000 m, ranging from 130 μm to 180 μm (Fig. 6a ). A slight increase occurs, about 180 μm, at 3000 m to 7000 m. Then it increases further, up to 240 μm, below 7000 m.
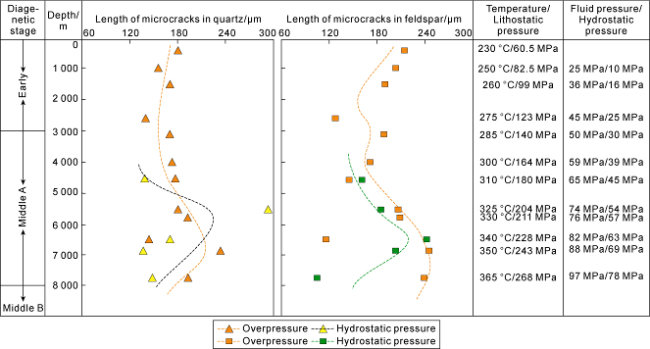
Fig. 6. Simulated microcrack length in quartz and feldspar particles in Southern Junggar Basin. |
Table 4. Microcrack length and width of particles in Southern Junggar Basin under overpressure and hydrostatic pressure conditions based on physical simulations |
| Depth/m | Average length under over pressure/ μm | Length of microcracks in quartz/μm | Length of microcracks in feldspar/μm | Width of microcracks in quartz/μm | Width of microcracks in feldspar/μm | Average width/μm | |||||||||
|---|---|---|---|---|---|---|---|---|---|---|---|---|---|---|---|
| Under overpressure | Under static pressure | Under overpressure | Under static pressure | Under overpressure | Under static pressure | Under overpressure | Under static pressure | Under overpressure | Under static pressure | ||||||
| 100 | 192.00 | 181.55 | 212.90 | 2.33 | 5.70 | 3.77 | |||||||||
| 1000 | 161.74 | 154.80 | 206.86 | 1.74 | 2.34 | 1.82 | |||||||||
| 1585 | 179.39 | 171.30 | 191.54 | 3.09 | 3.62 | 3.30 | |||||||||
| 2470 | 137.41 | 141.13 | 127.17 | 2.28 | 2.05 | 2.22 | |||||||||
| 3048 | 171.67 | 171.49 | 188.93 | 3.60 | 2.65 | 3.73 | |||||||||
| 3940 | 137.41 | 174.02 | 173.69 | 5.70 | 6.59 | 5.99 | |||||||||
| 4511 | 165.97 | 176.65 | 137.52 | 144.61 | 161.21 | 2.53 | 8.12 | 5.00 | 6.71 | 3.56 | 7.52 | ||||
| 5400 | 182.70 | 180.26 | 291.09 | 192.02 | 185.77 | 5.05 | 6.16 | 3.56 | 6.73 | 4.76 | 6.32 | ||||
| 5680 | 194.28 | 194.12 | 194.62 | 2.98 | 7.85 | 4.52 | |||||||||
| 6295 | 138.15 | 143.68 | 170.24 | 116.04 | 241.54 | 3.87 | 7.07 | 4.77 | 6.64 | 4.05 | 7.00 | ||||
| 6850 | 236.78 | 233.01 | 137.86 | 244.95 | 203.43 | 3.03 | 4.70 | 5.32 | 5.35 | 3.61 | 4.87 | ||||
| 7766 | 206.12 | 194.20 | 148.22 | 238.90 | 104.73 | 6.00 | 6.65 | 3.33 | 8.93 | 5.29 | 7.26 | ||||
The development of microcracks in quartz particles remains stable with depth, whereas the length of microcracks in feldspar particles shows significant variation. Above 3000 m, microcracks in feldspar particles are short, from 120 μm to 200 μm. From 3000 m to 6000 m, the length of microcracks in feldspar particles shows a slight increase, reaching 180-200 μm. Below 7000 m, the length of microcracks in feldspar particles increases, ultimately up to 240 μm. The degree and size of microcrack development in feldspar particles are generally greater than those in quartz particles. This may be caused by the natural cleavage cracks in feldspar and the weaker compression performance of feldspar than quartz. At overpressure, feldspar particles are more likely to fracture than quartz particles (Figs. 3 and 7 ).
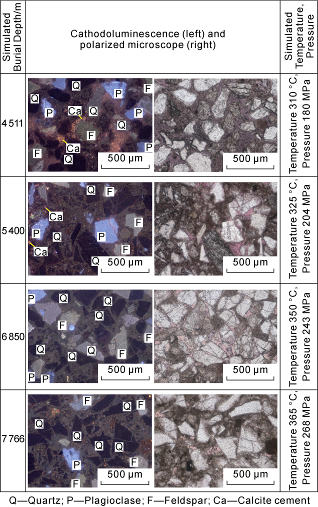
Fig. 7. Simulated microcracks in quartz and feldspar particles in Southern Junggar Basin under cathodoluminescence and polarization microscopy. |
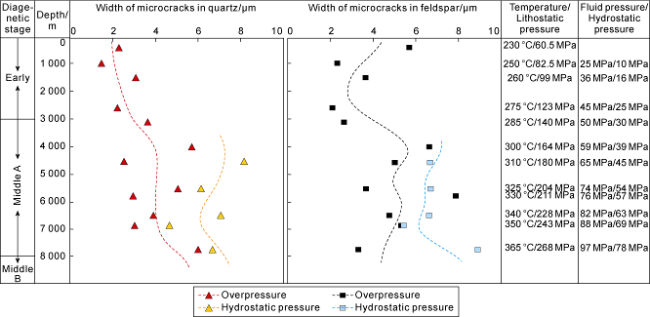
5.1.2. Microcrack width
The average width of microcracks in quartz and feldspar skeleton particles is small, generally less than 8 μm. The width of microcracks in feldspar is a little larger because the compression performance of feldspar is weaker, and feldspar dissolves in acidic fluid.
At abnormal fluid pressure, the width of microcracks in quartz particles remains approximately the same at depth less than 3000 m, around 2 μm. At 3000-7000 m, the width of microcracks increases slightly, ranging from 4 μm to 6 μm (Fig. 8 and Table 4 ). Below 7000 m, the width of microcracks increases, even up to 6 μm.
Fig. 8. Simulated microcrack width in quartz and feldspar particles in Southern Junggar Basin at overpressure and hydrostatic pressure. |
The width of microcracks in feldspar particles changes significantly with depth. Above 3000 m, the width of microcracks is small, generally from 6 μm to 2 μm. This may be attributable to a high fluid pressure coefficient in shallow formations (Table 3 ), and it’s easy to induce hydraulic fracturing [20]. Between 3000 m and 7000 m, the width of microcracks increases significantly, even up to 8 μm. Below 7000 m, the width of microcracks reduces to 4 μm.
5.2. Comparison of microcracks at overpressure and hydrostatic pressure
At hydrostatic pressure, the length of microcracks in quartz and feldspar particles reaches maximum values (Fig. 6 and Table 4 ). The maximum length in quartz particles appears at 5400 m, while that in feldspar particles appears at 6295 m. At overpressure, the maximum length both in quartz and feldspar particles appears at 6850 m, larger than the maximum values at hydrostatic pressure. This signifies that at overpressure, both the development and length of fractures in skeleton particles increase at deeper formations.
At hydrostatic pressure, the development of microcracks in quartz and feldspar particles is poorer, and the length is shorter (Fig. 6 , Fig. 7 , Table 4 ), but the width is larger than at overpressure. In feldspar particles, the width of microcracks can reach 9 μm. The width of microcracks in feldspar and quartz are not very different.
Analysis of the microcrack characteristics shows that the microcracks are thin and long at overpressure, and short and wide at hydrostatic pressure. The morphological differences are caused by fluid pressure which reduces effective normal stress and rock shear fracture strength, so that it is easy to induce fractures [40]. Abnormal fluid pressure causes the stress molar circle at a point in rock to shift leftward. When fluid pressure approaches to the critical value, the minimum principal stress may change from positive (compressive stress) to negative (tensile stress), inducing tensile cracks [40], which are thin and long, as observed in quartz and feldspar particles at overpressure. At hydrostatic pressure, skeleton particles experience vertical mechanical compaction, and particle microcracks are predominantly affected by overlying pressure. Formation pressure linearly increases with depth. Once the combined force of overlying pressure and formation pressure is equal to the rock's rupture stress, a lot of microcracks will develop. After being fractured, new voids will be appeared among the particles, and the fractured skeleton particles will be rearranged at surrounding stress, making that the reservoir tighter than before [39]. This enhances the anti-compaction ability and reduces the microcrack length in ultra-deep skeleton particles (Fig. 6 ). The discovery can contribute significantly to the geological understanding for deep reservoir evaluation and stimulation.
5.3. Significance of microcracks in overpressured reservoirs
In an overpressured environment, the development of microcracks in skeleton particle is influenced by overlying stress and fluid stress, and exhibits multiple stages of development. At 5680 m (Fig. 6 ), influenced by abnormal fluid pressure, the effective stress on skeleton particles like quartz and feldspar is lower, and the microcracks are shorter than at hydrostatic pressure at the same depth. At 6850 m, the effective stress increases significantly, and the sandstone reservoir enters a primary fracturing period, so that numerous microcracks are induced in the skeleton particles. The length of the microcracks increases substantially. As depth increases, the length of the microcracks gradually decreases, but keeps longer than the microcracks induced at hydrostatic pressure (Fig. 6 ).
The development of microcracks is primarily influenced by abnormal fluid pressure and effective stress on the skeleton particles. At overpressure, microcracks may develop in more stages than at hydrostatic pressure because of changing abnormal fluid pressure and increasing effective stress. The development of multiple stages of microcracks improves the reservoir physical properties and permeability. So it is concluded that the development of abnormal fluid pressure in multiple stages is important for the improvement of deep reservoirs.
6. Conclusions
Based on physical simulations, the study investigates the impact of overpressure on pores in the deep reservoirs in the Southern Junggar Basin. At 6000 m to 8000 m, mechanical compaction at hydrostatic pressure reduced the remaining primary pores by about twice at overpressure. The findings demonstrate that overpressure can effectively suppress mechanical compaction and preserve large amount of primary intergranular pores.
The linear contact ratio of particles under overpressure is consistently smaller than that under hydrostatic pressure at the same depth. The difference of mechanical compaction on deep reservoirs between overpressure and hydrostatic pressure exhibits a decreasing trend. In addition, the ability of abnormal fluid pressure preventing effective stress from increasing becomes weak. As a result, the mechanical compaction at overpressure progressively approaches to that at hydrostatic pressure.
The microcracks induced in deep reservoirs are thin and long at overpressure, while short and wide at hydrostatic pressure. The difference is due to the formation of tensile fractures caused by abnormal fluid pressure, which are thin and long.
The concentrated development of microcracks at overpressure is later than that at hydrostatic pressure, and the depth is deeper for the same degree of fracture development and fracture length. The development of microcracks at overpressure is primarily influenced by abnormal fluid pressure and effective stress on skeleton particles. The development stages of microcracks at overpressure exceed those at hydrostatic pressure under the same geological conditions.
The development stages of abnormal fluid pressure significantly enhance the physical properties of deep reservoirs. It is crucial to conduct more in-depth researches on the overpressure development stages in deep reservoirs and seek out zones at abnormal fluid pressure. To discover effective deep reservoirs relies heavily on these efforts.
Nomenclature
pa—fluid pressure, MPa;
pe—effective stress, MPa;
pr—lithostatic pressure, MPa;
pw—hydrostatic pressure, MPa;
p—formation overpressure, MPa;
H—depth, m.