

Introduction
The hydrocarbon accumulation stage is a key parameter in recovering the hydrocarbon accumulation process and plays a vital role in hydrocarbon exploration [1-2]. There are many ways to study the hydrocarbon accumulation stage, including analyzing the main hydrocarbon generation stage of source rock, the trap-forming stage, and the reservoir saturation pressure [3-4]. In particular, the combination of fluid inclusion analysis and apatite fission track (AFT) thermal modeling can provide a valuable reference to evaluate the stages of hydrocarbon accumulation [5⇓-7].
The Bongor Basin in Chad, Central Africa, is one of the most important hydrocarbon-bearing basins in the West and Central African Rift System (WCARS). PetroChina Company Limited has made numerous commercial discoveries of hydrocarbon on the northern slope of the Bongor Basin since 2007, and has begun to investigate the hydrocarbon accumulation in the Lower Cretaceous of the Bongor Basin [5,8⇓⇓ -11]. For example, based on the vitrinite reflectance data, one AFT date and in combination with fluid inclusion data from Well BC-2 in the Bongor Basin, Wen et al. [8] and Dou et al. [9] concluded that the basement reservoirs of Well BC-2 experienced the primary hydrocarbon charging stage at 55-80 Ma in the Late Cretaceous, and the secondary hydrocarbon accumulation events at 25-30 Ma in the Paleogene. Dou et al. [5] further provided the AFT dates from four wells in the Bongor basin and reconstructed the thermal history. Although the above- mentioned studies have obtained pioneering knowledge on the hydrocarbon accumulation stages in the Bongor Basin, there are still certain deficiencies, i.e., the reconstruction of the thermal history seems to be lack of constraints. Because the Bongor Basin underwent repeated cooling-heating events in the temperature range above the AFT closure temperature [5]. In order to constrain the complex thermal history of Bongor basin, the distribution of AFT length is more favorable than the AFT date itself [12]. Therefore, the well cores located on the northern slope of the Bongor Basin were sampled for AFT dating and length distribution measurement to further refine the thermal history of the Bongor Basin. This study provides a new reference for understanding the hydrocarbon accumulation stages on the northern slope of the Bongor Basin by combining thermal history modeling with hydrocarbon inclusion analysis.
1. Geological setting
The Bongor Basin is located in the southwest of Chad in nearly east-west on the whole, with a length of ~280 km, a width of 40-80 km, and an area of approximately 18 000 km2 (Fig. 1a ). It is a Mesozoic-Cenozoic intra- continental rift basin controlled by the dextral strike-slip of the Central Africa Shear Zone [13-14]. The basin is composed of four tectonic units: northern slope, central depression, southern uplift, and southern depression (Fig. 1b ). The majority of the proven hydrocarbon reservoirs are distributed in the northern slope.
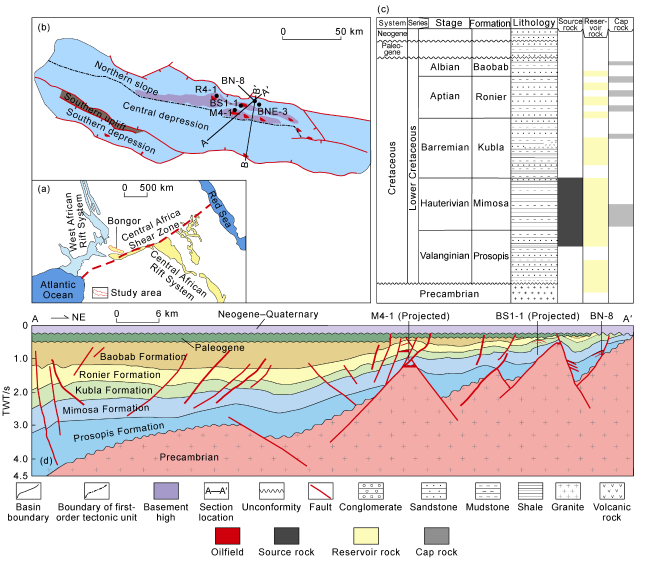
The crystalline basement of Bongor basin is made of Precambrian magmatic rocks with a date range of (525.3± 2.5)-(621.0±16.0) Ma and orthometamorphites with a date range of (464±5)-(553±19) Ma [15]. During the Precambrian-Cretaceous, the Bongor Basin, as a part of the Gondwana continent, underwent a stable platform formation period, where the basement of the basin was exposed to the surface and subjected to weathering and exhumation. Basin drilling has revealed that weathered basement are composed of 10-100 m thick fractured granites that have developed on the tops of different buried hills [16].
In the Early Cretaceous, with the breakup of the Gondwana continent and the split of the Atlantic Ocean from the south to the north, a dextral strike-slip occurred along the Central Afrcian Shear Zone, accompanied by strong faulting and rifting, forming a series of Cretaceous-Paleogene rift basins, which are now called the West and Central African Rift System (WCARS). Located in the west end of the Central African Shear Zone, the Bongor Basin is controlled by syngenetic faults, which formed several rows of half-grabens. The Early Cretaceous was the main period of subsidence and sedimentation in the basin, during which the main source-reservoir- seal assemblage was formed [17-18]. The strike-slip activity in central Africa ceased in the Late Cretaceous, while the collision between the African and Eurasian plates induced a regional north-south compression stress field [14,19⇓ -21]. This resulted in a strong inversion in Bongor Basin, with an overall uplift and strata erosion, the Upper Cretaceous is absent in the Bongor Basin [18-19,22 -23].
In the Cenozoic, the regional stress field changed significantly. In the Paleogene, the tectonic activity of Central African Shear Zone weakened, while the opening of the Red Sea and the East African Rift System resulted in a NE-SW extension in the region. However, the Bongor Basin was only weakly affected. In the Neogene, the Bongor Basin was dominated by thermal subsidence [18,20].
The sedimentary strata in the Bongor Basin are composed of Mesozoic and Cenozoic terrestrial clastics, including the Lower Cretaceous, Paleogene, Neogene, and Quaternary [13,19], with a total thickness reaching 10 000 m[18]. The Early Cretaceous strata are divided, upwardly, into Prosopis, Mimosa, Kubla, Ronier, and Baobab Formations (Fig. 1c, 1d ). An evident unconformity separates the Lower Cretaceous from the overlying strata, which are approximately 200-400 m in thickness [18,24]. The shales of the Prosopis and Mimosa formations are rich in organic matters, which are characterized by Kerogen types I-II1 and average TOC of 3.5%, acting as the main source rocks [9,24 -25]. Oil and gas have been discovered in both the Lower Cretaceous and the fractured Precambrian basement [18,24,26].
2. Experiment method and sampling
From five wells (M4-1, R4-1, BS1-1, BNE-3, and BN-8) on the northern slope of Bongor Basin, 41 samples were collected for fluid inclusion homogenization temperature analysis and 7 samples were collected for AFT analysis, respectively. Sampling wells are shown in Fig. 1 , and the samples for AFT analysis are given in Table 1 .
Table 1 Samples for AFT analysis |
| Sample | Well | Depth/m | Lithology | Formation |
|---|---|---|---|---|
| M4-1-a | M4-1 | 1 187 | Medium-coarse sandstone | Ronier |
| M4-1-b | 457 | Coarse sandstone with bitumen | ||
| R4-1-a | R4-1 | 1 457 | Coarse sandstone | Kubla |
| R4-1-b | 1 578 | Gravel-bearing coarse sandstone | ||
| BS1-1 | BS1-1 | 1 525 | Medium-coarse sandstone | Prosopis |
| BNE-3 | BNE-3 | 1 472 | Coarse sandstone | |
| BN-8 | BN-8 | 1 392 | Gravel-bearing coarse sandstone |
2.1. Analysis of inclusions
Petrographic studies of fluid inclusions aim to determine the relative time relationship between the inclusions and host minerals that capture them [27]. First of all, the lithology, diagenesis degree, mineral assemblages, and sources of parent rock of the samples are clarified. Then the suitable secondary inclusions in the fractures (excluding deformed inclusions, "necked" inclusions, inhomogeneous fluid inclusions, and inclusions undergoing biodegradable) were selected and subjected to temperature measurements based on the homogenization method. The key instruments employed in this study were the MSP2000 fluorescence microscope and the Linkam- THMSG600 heating-freezing stage using the following parameters: temperature range between −196 °C to 600 °C; temperature response between 0 and 2 s; accuracy of 0.1 °C; temperature stability less than 0.1 °C; sample area of 22 mm; minimum objective working distance of 4.5 mm; and minimum spotting scope working distance of 12.5 mm.
2.2. AFT analysis
Each sample was crushed and the single apatite grain was separated by conventional methods such as heavy- liquid and magnetic separation. Apatite grains from seven samples were placed in sample mounts made of Teflon, discharged into uniform strips with a pick under the microscope. The prepared samples were carefully grinded with standard M20, M7, and M315 corundum powders of different grain size levels to produce the inner surface of the grains, and then polished by Cr2O3, washed, and dried. Finally, the spontaneous fission tracks were revealed by etched with 5 mol/L HNO3 for 20 s at 21 °C.
The AFT analysis was completed at the Institute of High Energy Physics, Chinese Academy of Sciences. The fission-track date was determined by the external detector method. A low-uranium muscovite mica sheet was attached to the optical slices and marked with a pin so that the spontaneous fission tracks of the samples correspond to the induced fission tracks on the mica during the track measurements. The samples were then sent to a Chinese atomic energy reactor for the application of irradiation, together with the standard uranium glass UB2 and the date standard sample FC3. The irradiated neutron fluence of four apatite samples was set as 415×1015 cm−2. After the reactor was irradiation and cooling, induced fission tracks were revealed by the etching of the mica sheets in 40% HF for 55 min at 25 °C. The track density and length were measured using the AUTOSCAN system. Calculation of the fission-track center date using the weighted average zeta constant calibration method recommended by IUGS [29]. In this study, the zeta constant of the samples is (416.0±24.7) a/cm2.
The AFT thermal history modeling was performed using HeFTy software (version 1.8.1). Details of the AFT modeling procedure and algorithms are presented in reference [30]. The initial length of the confined fission track is calculated based on the Dpar value [31]. The annealing model was adopted from Ketcham et al. [32]. The AFT length distribution modeling was performed using the K-S testing method [30], and the Monte Carlo method was used for the random search of the T-t (temperature-time) paths.
3. Results of experimental analysis
3.1. Fluid inclusion analysis results
The lithology of the sandstone samples in this study area is dominated by feldspathic sandstone, with high matrix content, low compositional and structural maturity, which is the strong bending and deformation of biotite and other lamellar minerals, widespread calcareous cementation and the local replacement of calcite by iron-bearing dolomite shows that the sandstones experienced strong compaction, cementation, and metasomatism. The characteristics of the quartz and feldspar reveal that the clastic sediments are of diverse sources, including plutonic magmatic rocks, extrusive rocks, metamorphic rocks, and recycling quartz.
The shape of the inclusions in this study is mainly irregular (Fig. 2 ), accounting for 83.7% of the measured inclusions, while other elliptical, rectangular, and round inclusions account for 5.4%, 4.5%, and 3.2%, respectively. The inclusions composed of brine solution and bubbles in the sample are colorless and transparent, with black rings between the bubbles and the solution. Moreover, the bubbles often exhibit a central bright spot. If the gas in the bubble is water vapor, the bubble is colorless, transparent, and occasionally dark. The hydrocarbon-bearing inclusions are colorless under plane and crossed polarized light. The hydrocarbon-bearing brine inclusions are mostly colorless (accounting for 58.7%), light yellow (accounting for 25.6%), and light brown (accounting for 11.6%). The majority of the inclusions in the sample are banded or grouped, with banded intrusions being dominant. In addition, a few inclusions are distributed in isolation, which are mostly primary inclusions and hydrocarbon inclusions captured in intragranular-healing fractures.
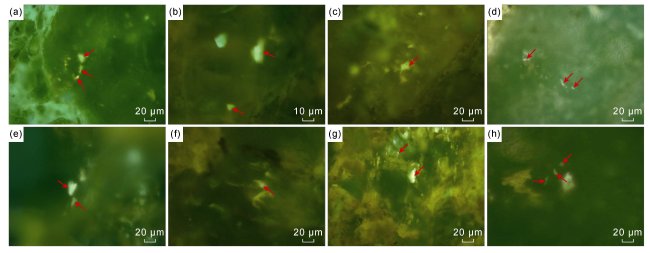
Fig. 2 Fluorescence micrographs of hydrocarbon-bearing inclusions. (a) Hydrocarbon-bearing inclusions in fractures within quartz grains from gravel-bearing medium sandstone in Well M4-1, 1 188 m; (b) Hydrocarbon-bearing inclusions in fractures within quartz grains from very coarse sandstone in Well R4-1, 1 519 m; (c) Hydrocarbon-bearing inclusions in fractures within quartz grains from gravel-bearing coarse sandstone in Well BS1-1, 1 523 m; (d) Hydrocarbon-bearing inclusions in fractures within quartz grains from gravel-bearing coarse sandstone in Well BN-8 well, 1 396 m; (e) Hydrocarbon-bearing inclusions with yellow fluorescence on the edge of quartz grains from gravel-bearing medium sandstone in Well M4-1, 1 188 m; (f) Hydrocarbon-bearing inclusions in fractures within quartz grains in Well R4-1, 1 456 m; (g) Hydrocarbon-bearing inclusions in fractures within quartz grains from gravel-bearing coarse sandstone in Well BS1-1, 1 523 m; (h) Micrographs of fluid inclusions in Well BN-8, 1 387 m. Red arrows indicate the fluid inclusion locations for the homogenization temperature measurements. |
Homogenization temperature revealed that the secondary fluid inclusions in each well generally exhibit two homogenization temperature peaks (except for well BN-8, which presents a single temperature peak of the hydrocarbon-bearing inclusions) (Fig. 3 ): the low-temperature peaks are 75-95, 65-85, and 55-65 °C, respectively; and the high-temperature peaks are 105-125, 115-125, and 85-105 °C, respectively. Except for a single temperature peak of brine inclusions in well BN-8, the brine inclusions of the other wells show two homogenization temperature peaks (Fig. 3 ), in which the brine inclusions consisted of the hydrocarbon-bearing brine inclusions and the brine inclusions coexisting with the hydrocarbon: the low-temperature peaks are 105-115, 95-105 °C, respectively; and high- temperature peaks are 125-135, 115-125 °C, and 125-135 °C, respectively. In general, the homogenization temperature peaks of the hydrocarbon fluid inclusions in each well are lower than those of the coexisting brine inclusions.
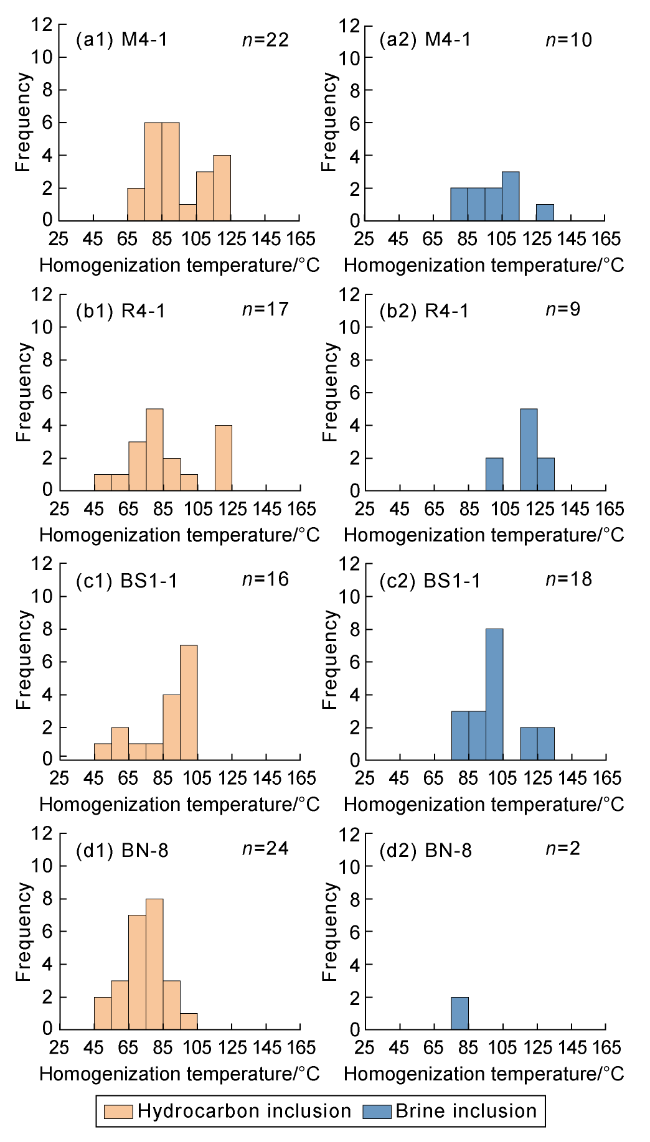
Fig. 3 Homogenization temperatures histogram of hydrocarbon inclusions and coexisting brine inclusions. |
3.2. AFT dating and thermal history modeling results
The detailed AFT data are listed in Table 2 , and Figs. 4 and 5 show the distribution of AFT single-grain dates and confined fission-track length, respectively. Galbraith et al. [33] demonstrated that the single-grain AFT dates of the same sample often vary widely due to different grain annealing properties resulting from distinct provenances and geochemical compositions. In this case, it is advisable to distinguish different components of the apatite grains and choose the central date as the AFT date of the sample. This date calculation method has been verified by numerous research examples. Therefore, the central date was chosen as the AFT date of the sample [34⇓⇓-37].
Table 2 AFT data on the northern slope of the Bongor Basin |
| Sample | Well location | Depth/ m | Strata | Stratigraphic age/Ma | Nc | ρs/ 105 cm−2 | Ns | ρi / 105 cm−2 | Ni | ρd/ 105 cm−2 | Nd | P(χ2)/ % | Central date/Ma | Pooled date/Ma | L/μm | N | Dpar/ μm |
|---|---|---|---|---|---|---|---|---|---|---|---|---|---|---|---|---|---|
| M4-1-a | M4-1 | 1 187 | Ronier | 125.0-127.5 | 28 | 3.96 | 1 202 | 14.09 | 4 274 | 10.46 | 7 312 | 0 | 62±5 | 61±4 | 11.1±2.1 | 108 | 1.4 |
| M4-1-b | 457 | Ronier | 100.0-125.0 | 19 | 11.07 | 1 262 | 8.76 | 999 | 10.48 | 7 312 | 9 | 270±20 | 270±20 | 11.2±1.6 | 109 | 1.2 | |
| R4-1-a | R4-1 | 1 457 | Kubla | 120.5-127.5 | 28 | 2.81 | 1 024 | 10.85 | 3 952 | 10.47 | 7 312 | 14 | 56±4 | 56±4 | 11.5±1.9 | 108 | 1.4 |
| R4-1-b | 1 578 | Kubla | 125.0-127.5 | 28 | 4.09 | 889 | 13.92 | 3 023 | 10.47 | 7 312 | 86 | 64±5 | 64±5 | 11.0±2.2 | 102 | 1.4 | |
| BS1-1 | BS1-1 | 1 525 | Prosopis | 130.0-136.0 | 28 | 3.12 | 782 | 15.20 | 3 812 | 10.48 | 7 312 | 0 | 45±4 | 45±3 | 10.5±2.1 | 102 | 1.3 |
| BNE-3 | BNE-3 | 1 472 | Prosopis | 130.0-136.0 | 28 | 4.71 | 1 140 | 20.11 | 4 868 | 10.48 | 7 312 | 7 | 51±4 | 51±4 | 10.7±1.9 | 106 | 1.5 |
| BN-8 | BN-8 | 1 392 | Prosopis | 130.0-136.0 | 8 | 15.70 | 693 | 18.53 | 818 | 10.47 | 7 312 | 7 | 183±16 | 182±15 | 10.3±1.5 | 61 | 1.1 |
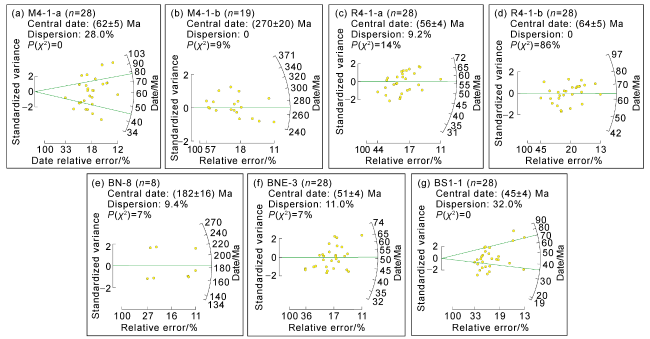
Fig. 4 Radar plots of the AFT single-grain date distribution (radar plots are produced using RadialPlotter [38] software). |
As shown in Table 2 , the AFT dates of samples M4-1-b and BN-8 are 270 Ma and 182 Ma, respectively, which are much older than their stratigraphic ages. Therefore, their fission tracks are not fully annealed, and their fission track dates may represent the uplift and exhumation information of the source rock.
The AFT date of sample M4-1-a (62 Ma) is younger than its stratigraphic age, but its date distribution fails to pass the χ2 test (P(χ2)<5%), indicating that the AFT single-grain dates are relatively scattered. In addition, the radar plot shows that the AFT single-grain date distribution exhibits two peaks (Fig. 4 ), and the histogram of confined fission-track length distribution exhibits two inconspicuous peaks. More importantly, the upper neighboring sample M4-1-b is unannealed. Therefore, the apatite fission tracks of this sample have been subjected to partially annealed but still not completely annealed.
The AFT dates of samples R4-1-a, R4-1-b, and BNE-3 are 51-64 Ma, with an error of 4-5 Ma. These dates are relatively concentrated and much younger than the stratigraphic ages (Fig. 4 ). Furthermore, the confined fission-track length distribution of the above three samples shows a single-peak (Fig. 5 ), and the maximum peaks of brine inclusion charging temperatures at the same depth of samples R4-1-a and R4-1-b are 115-135 °C (Fig. 3 ). Thus, their central dates represent the ages at which apatite fission tracks were reset when subsidence exceeds the AFT closure temperature.
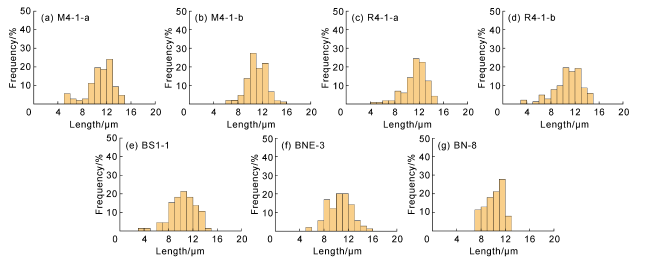
Fig. 5 The confined fission-track length distribution of AFT samples. |
Although the AFT single-grain date distribution of sample BS1-1 also fails to pass the χ2 test, the AFT date radar plot (Fig. 4 ) also shows two peaks, 36 Ma and 71 Ma. However, its maximum single-grain date is less than 90 Ma, and its date distribution range is close to those of samples R4-1-a, R4-1-b, and BNE-3, and is much younger than its stratigraphic age. The histogram of the fission-track length distribution also shows a single peak (Fig. 5 ). In addition, the maximum peak of brine inclusions charging temperature at the same depth of this AFT sample also reaches 115-135 °C (Fig. 3 ). Therefore, its central date is also speculated to represent the ages at which apatite fission tracks were reset when subsidence exceeds the AFT closure temperature.
Based on the above-mentioned analysis, thermal history modeling was conducted for the four samples of R4-1-a, R4-1-b, BS1-1, and BNE-3. Five constraint boxes (Fig. 6 ), which are as large as possible and acceptable in both time and temperature spans, were set to constrain the T-t paths based on the unconformities existing among the Neogene, the Paleogene, and the Lower Cretaceous (Fig. 1c ). The 5×10⁴, 5×10⁴, 1×10⁴ and 5×10⁴ T-t paths searches for thermal history paths were assumed for samples R4-1-a, R4-1-b, BS1-1, and BNE-3, respectively. In this paper, the weighted mean thermal history is used as the final thermal history modeling result (Fig. 6 ). The thermal history modeling result of four samples is divided into five stages: rapid heating from the surface temperature to ~120 °C from 135 Ma to 80-95 Ma; rapid cooling to 60-70 °C during 65-80 Ma; heating slightly to 70-80 °C until 30-50 Ma; cooling slowly to ~60 °C until 10-20 Ma; and slowly increasing temperature stage until the present.
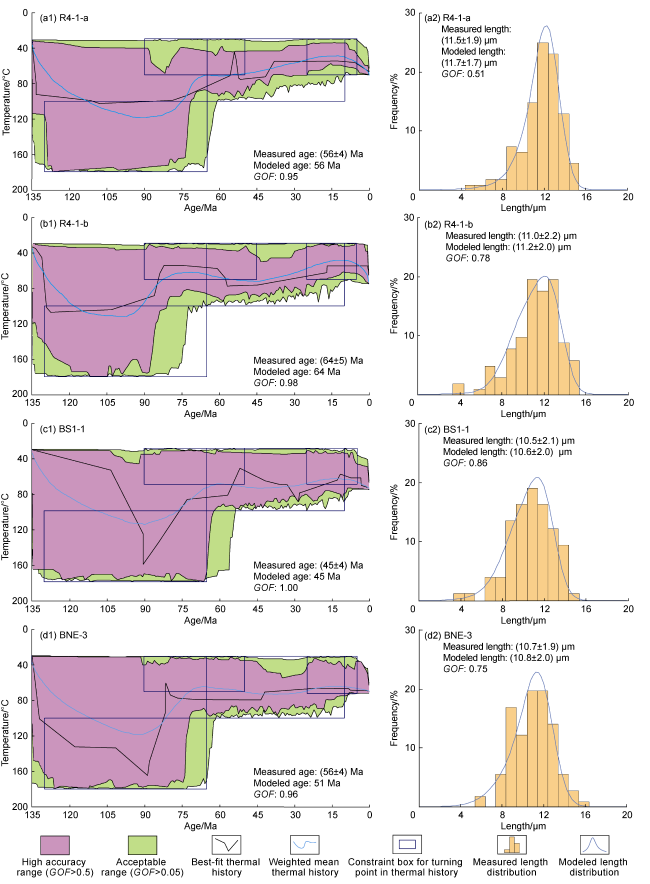
Fig. 6 Thermal history modeling results and histograms of confined fission-track length distribution. |
The rapid heating during the Early Cretaceous and cooling during the Late Cretaceous which the samples R4-1-a, R4-1-b, BS1-1, and BNE-3 experienced reflect a rapid subsidence during the Early Cretaceous, followed by a strong tectonic inversion during the Late Cretaceous in the Bongor Basin. The tectonic inversion is probably related to the Santonian compression event which was caused by the African plate collision with the Eurasian plate [19,22] and was widely recognized in many rift basins of the West and Central African Rift System. After the inversion, the Bongor basin experienced weak subsidence in the Paleogene, uplift around the turn of the Paleogene and Neogene, and subsidence since the Miocene.
The surface temperature was set as 28 °C, and the paleogeothermal gradient in the study area was assumed to equal the current geothermal gradient (about 30 °C/km [5]). The four samples, R4-1-a, R4-1-b, BS1-1, and BNE-3, reached a maximum depth of burial of about 3.1 km after the rapid subsidence and were denuded up to a thickness of about 1.8 km during the Late Cretaceous, and then were denuded about 0.5 km around the intersection of the Paleogene and Neogene. Therefore, the cumulative thickness of denudation reaches about 2.3 km.
4. Discussion
The analysis of the fluid inclusions and their homogenization temperature peaks can be used to determine the stage and timing of hydrocarbon charging, while different homogenization temperature peaks often represent multiple hydrocarbon accumulation stages [39]. Since the gas saturation is low during the capture process, the homogenization temperature of hydrocarbon-bearing inclusions is generally lower than, or even significantly lower than the capture temperature. The homogenization temperature of brine inclusions coexisting with hydrocarbon-bearing inclusions can better reflect the capture temperature. Therefore, these inclusions are usually used to indicate the temperature at which the hydrocarbon is captured.
The homogenization temperature of brine inclusions from the Kubla Formation in the study area can be divided into two peaks: 95-105 °C and 115-135 °C (Fig. 3 ); and the homogenization temperature of brine inclusions from the Prosopis Formation in the study area can also be divided into two peaks: 75-105 °C and 115-135 °C (Fig. 3 ). In summary, based on the homogenization temperature of brine inclusions, the migration and accumulation of hydrocarbon in the study area can be divided into two stages.
Although the AFT thermal history modeling in this study further provides new constraints of the thermal history since the Early Cretaceous, the main tectonic evolution stages revealed by the thermal history modeling are consistent with the previous studies [5,40 -41], i.e., the entire tectonic evolution is dominated by three major stages: Early Cretaceous subsidence, Late Cretaceous strong tectonic inversion, and Cenozoic thermal subsidence.
Combining the AFT thermal history modeling with the homogenization temperature of inclusions, the results that the Kubla and Prosopis Formations generally experienced two stages of hydrocarbon charging: the first stage of charging was 80-95 Ma which corresponds to the end of the rapid subsidence and the maximum depth of deposition; and the second stage was 65-80 Ma which corresponds to the strong tectonic inversion during the Late Cretaceous.
The second stage of hydrocarbon charging in this study (65-80 Ma) is contemporaneous with the earliest charging stage (55-80 Ma) reported by previous studies [8-9]. However, the first stage of hydrocarbon charging (80-95 Ma) in this study hasn't been reported yet. Therefore, the first stage of hydrocarbon charging is considered to the earliest hydrocarbon accumulation stage in the Bongor Basin [5], which represents the initial migration and accumulation of hydrocarbon in the Bongor Basin.
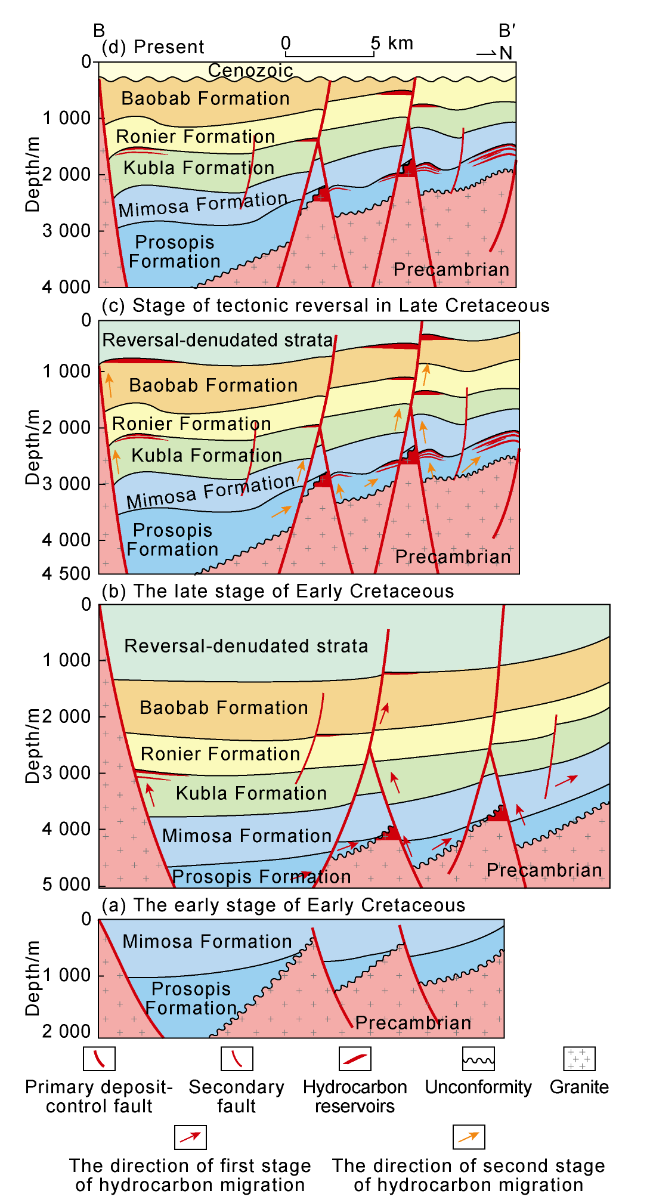
The Lower Cretaceous semi-deep lacustrine shale is the main source rock and widely distributed in the Bongor Basin [41⇓-43]. For example, the source rocks of the Prosopis Formation and the Mimosa Formation are developed on the northern slope area, and the source rocks of the Kubla Formation are developed in the central depression [41]. Based on the source rock distribution characteristics and widely widespread reservoir-seal assemblage [27], combined with the tectonic evolution of the basin, it is suggested that the hydrocarbon accumulation stages on the north slope of the Bongor Basin correspond to the end stage of rapid subsidence and the stage of strong tectonic inversion. In the early stage, hydrocarbon was generated and accumulated without long-distance migration, while hydrocarbon migrated along the faults and tilted strata in the late stage (Fig. 7 ). It is presumed that there might be the similar hydrocarbon accumulation model for the central depression and the southern depression as that of the northern slope area.
Fig. 7 The model of hydrocarbon accumulation in the Bongor Basin (B-B' cross-section location shown in |
5. Conclusions
The homogenization temperatures of secondary brine inclusions from the Kubla and Prosopis formations on the northern slope of the Bongor Basin, exhibit two peaks, with the low-temperature peak and high-temperature peak of 75-105 °C and 115-135 °C, respectively, which correspond to the two stages of hydrocarbon charging in the study area.
AFT thermal history modeling indicates that samples R4-1-a and R4-1-b of the Kubla Formation and samples BS1-1 and BNE-3 of the Prosopis Formation have undergone five stages of tectonic evolution: rapid subsidence in the Early Cretaceous, strong tectonic inversion in the Late Cretaceous, weak subsidence beginning in the Paleocene, followed by a weak inversion, and thermal subsidence from the Middle Miocene to the present. The denudation thickness caused by the Late Cretaceous tectonic inversion amounted to about 1.8 km, and the cumulative denudation thickness from the Late Cretaceous to the present is about 2.3 km.
The Kubla and Prosopis formations in the Lower Cretaceous on the northern slope of the Bongor Basin have the same hydrocarbon charging period, both of which have undergone two stages of hydrocarbon charging at 95-80 Ma and 80-65 Ma. The first stage of charging may correspond to the initial migration of hydrocarbon, at the end of the Early Cretaceous rapid sedimentation. In contrast, the second stage of charging corresponds to the stage of strong tectonic inversion in the Late Cretaceous.
Nomenclature
Dpar—the maximum diameter of etched spontaneous fission tracks measured parallel to the C-axis of crystal and intersecting with the polished surface, μm;
GOF—Goodness-of-fit, dimensionless;
L—average of measured confined fission-track lengths, μm;
n—number of samples;
N—number of tracks counted;
Nc—number of apatite grains analyzed per sample;
Ns—number of spontaneous fission tracks;
Ni—number of induced fission tracks;
Nd—number of fission tracks recorded by the external detector muscovite;
ρs, ρi, ρd—fission track density corresponding to Ns, Ni, and Nd, respectively, 105/cm2;
P(χ2)—Chi-square distribution probability, %;
χ2—Chi-square statistic value, dimensionless.