

Introduction
China is rich in low-permeability oil reserves, and the results of the National 4th Oil and gas resources evaluation show that the cumulative proven medium and low permeability reserves in China account for 12% of the oil in place, and the medium and low permeability prospective resources account for 24% of the prospective oil resources [1-2], which are mainly distributed in the oil provinces in China such as Changqing, Daqing and Jilin [3-4]. Currently, low permeability reservoirs are developed mainly in the mode of water flooding [5], and the production accounts for more than 60% of the total production [6-7]. In the process of water flooding development, the main channel is easy to be formed in the reservoir, and there is a phenomenon of narrowing of the flow channel [8-9]. Because of the small seepage resistance of gas, some low- permeability reservoirs are also developed by means of gas flooding, but there are problems such as the easy formation of gas channeling path in the reservoir [10⇓-12]. In response to the above problems, our research team proposed and gradually developed the water-gas dispersion system flooding technology [13-14], and in 2020, it realized the experimental application of 16 injectors and 68 producers in Wuliwan Area 1 of Changqing Oilfield, NW China. Up to now, the test area still maintains the effect of oil increase, with a cumulative oil increase of 1.7×10⁴ t and a 10- percentage-point decrease in water cut [14]. Water-gas dispersion oil displacement system is a fluid system formed by dispersing the gas phase in the form of micro and nano bubbles in water. Water-gas dispersion system flooding technology has achieved certain research results in the method of bubble generation, oil displacement characteristics, and field test to improve the recovery rate [13,15].
The existing understanding of the oil displacement mechanism of water-gas dispersion system is mainly divided into two aspects: expanding the swept volume and improving the microscopic oil displacement efficiency. The mechanism of expanding the swept volume of water-gas dispersion system is similar to part of the mechanism of chemical foam flooding [16], which utilizes bubbles to seal the pore throat, the Jamin effect of bubble cluster and other roles to improve the seepage resistance of the fluid in the main channel of the water flooding or in the channeling path of gas flooding, so as to change the direction of the fluid into the residual oil region, and to expand the swept volume of the displacement fluid. There is less literature related to the mechanism of water-gas dispersion system in improving oil displacement efficiency. The early researches of the research team [15] show that dispersed microbubbles are easy to adsorb the remaining oil, and continuously carry the remaining oil under the carrying and pushing action of water slug; at the same time, the morphological change due to the influence of wall surface in the microbubbles transport process also contributes to the transport of oil film. The microscopic mechanism of microbubble driving residual oil needs to be studied in depth.
The micro-mechanism of oil displacement should focus on the research on microbubble features, and in recent years, the research of microbubble system in the field of oilfield development has been increasing, such as the application results in the method of microbubble generation and the effect of oilfield application [17-18], but the depth of theoretical and mechanistic understanding is still insufficient [19-20]. The numerical simulation study of microbubbles, however, has received long-term attention from researchers, resulting in a wealth of computational methods for two-phase fluids, such as the volume of fluid (VOF) method [15,20 -21], the VOF combined with the level-set method [22], the smooth-particle hydrodynamics (SPH) method [23], and the lattice Boltzmann method (LBM) [24], which focus on the study of bubble generation and inter-bubble interactions, etc. In contrast, the behavioral characteristics of microbubbles in the seepage process, etc. have been less studied [25-26].
A microscopic glass etching model was used to design the displacement experiment, and observe the morphology change and movement characteristics of microbubbles. The experimental phenomena and oil displacement mechanism were quantitatively studied by means of VOF numerical simulation method.
1. Experiment
The author found that the water-gas dispersion system can improve the crude oil recovery rate in the core displacement experiment, and the degree of reserve recovery can be improved by 16.2 percentage points on the basis of water flooding. Since it is impossible to observe the fluid movement in the pore space in the core experiments, the author conducted microscopic modeling displacement experiments to study the mechanism of recovery enhancement by microbubbles.
1.1. Materials
In order to study the oil displacement process of water-gas dispersion system under reservoir conditions, a visual model that can simulate the pore structure of the reservoir needs to be made. The average permeability of the core in the test area is 1×10⁻³ μm2, and the diameter of the throat is less than 1 μm. Due to the limitation of the resolution of the optical microscope, it is not possible to observe the movement characteristics of the fluids under the condition of formation permeability. The displacement experiments of microscopic model with different permeability levels (average throat diameter from of 1-1 000 μm) show that the model permeability level does not affect the microbubble flow and deformation law, so according to the pore structure of the core thin section, the simulation model of the pore structure was scaled up and produced in accordance with the principle of similarity (Fig. 1a ). The advantage of this model is that it can simulate the influence of pore structure on seepage, and reflect the real oil displacement effect and residual oil distribution state more accurately, but the disadvantage is that the complex pore shape is not conducive to the quantitative analysis of the influencing factors. In this paper, the simplified ball-stick standard model (Fig. 1b ) was used to make up for the above shortcomings, and this model is also convenient for observing typical phenomena in the experiments and carrying out quantitative calculations. The main parameters of the two models are shown in Table 1 .
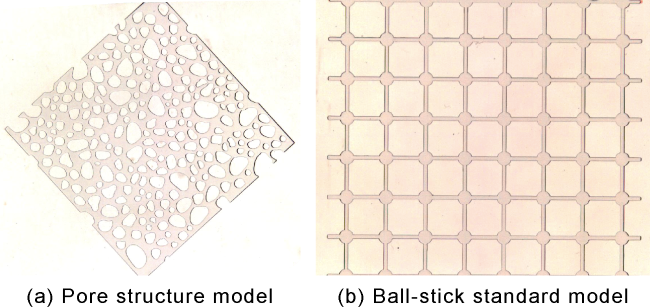
Fig. 1. Microscopic glass etching model. |
Table 1. Model parameters |
| Model | Effective area/ (mm×mm) | Throat diameter/ mm | Pore diameter/ mm | Pore depth/ mm |
|---|---|---|---|---|
| Pore structure model | 50×50 | 0.15-1.00 | 1-3 | 0.35 |
| Ball-stick standard model | 55×63 | 1.00 | 3 | 0.35 |
The water-gas dispersion system in the experiment was prepared with deionized water and CO2 (purity 99.99%) gas with a gas-to-water ratio of 1:3. The diameter of microbubbles under the actual reservoir conditions of Chang 621 of Triassic Yanchang Formation in the Wuliwan Block 1 of Changqing Oilfield, with a temperature of 65°C and pressure of 37.5 MPa, is (200 ± 10) μm.
Two oil samples, Changqing crude oil and kerosene, were used in the experiments. The viscosity of Changqing crude oil is 2.30 mPa•s under reservoir conditions (65 °C, 37.5 MPa), and the viscosity of kerosene is 1.25 mPa•s under ambient temperature and pressure conditions (25 °C, 0.1 MPa). The advantage of utilizing crude oil samples to carry out real displacement experiments under reservoir conditions to observe the displacement phenomenon and effect is that it can truly reflect the influence of crude oil samples, and the disadvantage is that the image is poor in light transmission and unfavorable for observation. In the simulation experiment carried out with kerosene samples, the process of microbubble action can be observed clearly, and at the same time, the precipitation of light components from the oil phase of the crude oil to form microbubbles can be avoided, thus no interference with the observation of microbubbles in the water-gas dispersion system. In order to facilitate the observation, the kerosene was treated with an oil-soluble red coloring agent.
1.2. Equipment
The experimental equipment (Fig. 2 ) mainly includes: dispersion system bubble device, temperature 150 °C, pressure 70 MPa; high-temperature and high-pressure visualization kettle, temperature 150 °C, pressure 70 MPa; Quizix5000 displacement pump, accuracy up to 0.1 μL/min; ZEISS V8 stereomicroscope; FASTCAM Mini high-speed video camera, the frequency of up to 10 000 frames/s.
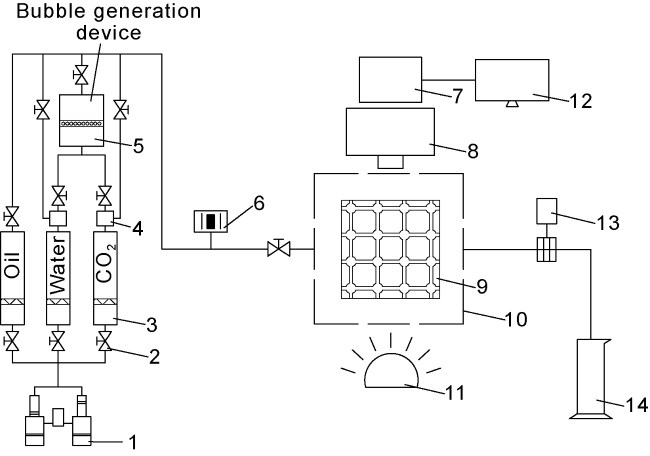
Fig. 2. Schematic diagram of experimental equipment. 1—Displacement pump; 2—Valve; 3—Intermediate container (containing oil samples, water samples, and gas from left to right); 4—Tee; 5—Bubble generation device for dispersion system; 6—SIKA D2 pressure sensor; 7—High- speed camera; 8—Microscope; 9—Glass etching model; 10—HTHP visualization kettle; 11—Light source; 12—Computer monitor; 13—Digital back pressure valve; 14—Measuring cylinder. |
1.3. Procedure
The steps of microscopic oil displacement experiment with water-gas dispersion system are similar to those of water/gas flooding [13], but slightly different. The experimental conditions were based on the actual reservoir conditions, i.e., temperature of 65 °C and pressure of 37.5 MPa. The main experimental steps were as follows.
Step 1: The water-gas dispersion system was prepared by the orifice plate method. The gas-water ratio was 1:3, and the pressure difference between the front and back of the plate was controlled to be 0.1 MPa during bubble generation.
Step 2: After the glass etching model was installed inside the high-temperature and high-pressure visualization kettle, confining fluid was injected, the back pressure valve was connected, and the outlet pressure was set at 37.5 MPa. After the check of the overall sealing and the confirmation of the integrity, the temperature inside the visualization kettle was slowly increased to 65 °C, and at the same time, the confining pressure was slowly increased and ultimately controlled at 40.5 MPa.
Step 3: The model was saturated with oil at a rate of 0.01 mL/min. After the end of the saturation with oil, water and water-gas dispersion system were used to displace the oil at a rate of 0.05 mL/min, and the experiment was ended when the distribution of the remaining oil in the model was observed to be unchanged. The process of saturation with oil and the displacement process were recorded with a high-speed video camera, and the recording frequency was adjusted in the range of 1 000-5 000 frames/s.
There are three pressure monitoring points in the experimental process: the pressure of Quizix5000 displacement pump, with the measurement range of 0-50 MPa, and accuracy of 0.02%; the inlet pressure of glass etching model, with SIKA D2 sensor pressure range of 0-70 MPa, and accuracy of 0.1%; model outlet pressure, with DBPR-type digital back pressure valve controlling the measurement range of 0.3-70.0 MPa, and accuracy of 0.1%.
1.4. Simulation
Due to the size limitation of the micro-etching model, it is not possible to directly measure parameters such as fluid pressure and velocity inside the model, and only relevant data at the inlet and outlet can be recorded. Numerical methods, however, can calculate the values of parameters at any location inside the model.
An equal-diameter pipe flow model (Fig. 3 ) was designed for the vibration phenomenon of microbubbles in the experiment, which can reflect the change of the fluid pressure field, avoid the interference of the complex structure, and easily recognize the weak change of microbubbles. The pipe diameter of the model is 1 mm, and the length is 4 mm. Front oil section, water slug and end oil section are set up inside the model to show the two oil-water interfaces in the model and play the role of position identification.
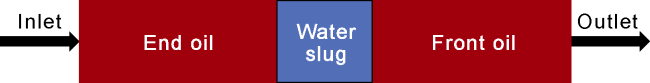
Fig. 3. Equal-diameter pipe flow model. |
The simulation was performed using a two-dimensional axisymmetric model in the VOF method [15] with temperature, pressure, and fluid viscosity settings consistent with the experimental conditions. The inlet fluid velocity was 0.5 m/s and the outlet pressure was 37.5 MPa. The internal fluid was initially under quiescent condition.
2. Oil displacement effects of microbubble and experimental phenomenon
2.1. Oil displacement process of water-gas dispersion system
The conventional CT scanning technology was used to conduct real-time scanning of the oil displacement process in the reservoir cores taken from the test area, observe the distribution status of oil, water and other media, and measure and analyze the oil displacement effect of water flooding and water-gas dispersion system. The cores used in the experiment were 2.5 cm in diameter and 6.0 cm in length, and the relevant parameters were quantitatively and statistically calculated using the saturation analysis software after 27 core cross-section images were acquired by means of helical scanning. Fig. 4a shows the saturated oil state; Fig. 4b shows the oil-water distribution state after water flooding, and the degree of reserve recovery is 46.3%; with the water-gas dispersion system flooding on the basis of water flooding, Fig. 4c shows the final state of the residual oil distribution, and the degree of reserve recovery reaches 62.5%, which is improved by 16.2 percentage points on the basis of water flooding. Comparative analysis of the enlarged images corresponding to the 24th cross section in Fig. 4b and Fig. 4c shows that the residual oil on both sides of the core after the water-gas dispersion system flooding is greatly mobilized, indicating significant improvement of sweep effect; and besides, the residual oil in the main flow path of the water flooding is also reduced greatly, which indicates that the water-gas dispersion system also improves the microscopic oil displacement efficiency.
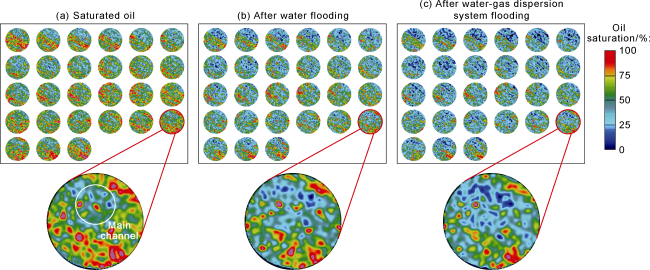
Fig. 4. Residual oil distribution after water flooding and dispersion system flooding. |
In order to study the oil displacement characteristics of microbubbles, a microscopic glass etching model was used to observe the details of fluid movement, and the experiments were conducted using a pore structure model. The water-gas dispersion system was used for displacement after the end of the water flooding, and the final residual oil distribution is shown in Fig. 5. The initial saturated oil state of the model is shown in Fig. 5a . Fig. 5b shows the state at the end of water flooding, and the main flow channel is formed in the middle region of the model. The residual oil is mainly distributed at the edge and corner, which is the weak sweep position of the water flow. There are a certain number of oil droplets inside the main flow channel, which are adsorbed on the wall surface, forming isolated residual oil. Water-gas dispersion system flooding was performed on the basis of water flooding. The residual oil distribution after the end of the displacement is shown in Fig. 5c , which shows that only a small amount of residual oil is distributed in the blind end region of the corners, and there is only a trace amount of adsorbed oil film in the internal region. Pixel point statistics method was used to calculate the degree of reserve recovery of the two flooding methods, which was 66.4% and 94.9%, respectively. Compared with the water flooding, the water-gas dispersion system extracts the un-swept residual oil at the corners and edges, so as to expand the swept volume, while effectively mobilizing the isolated residual oil in the main flow channel, so as to improve the microscopic oil displacement efficiency.
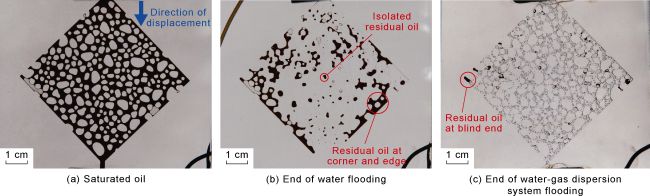
Fig. 5. Comparison of oil displacement effect between water flooding and water-gas dispersion system flooding. |
In order to compare the interface state of the displacement front, water flooding experiment after saturated oil and water-gas dispersion system flooding experiment after saturated oil were carried out. By analyzing the displacement process, it was found that the oil-water interface was always in a clear state during the water flooding, with the front being plunger-pushed (Fig. 6a ). In contrast, in the process of water-gas dispersion system flooding, there is no clear displacement front, the water-gas dispersion system and crude oil flow in a mixed state, with the crude oil area gradually becoming fainter, and the overall effect is similar to that of the miscible-phase displacement (Fig. 6b ). In the local magnification of Fig. 6b , a complex mixed flow of microbubbles, water droplets and oil droplets can be observed.
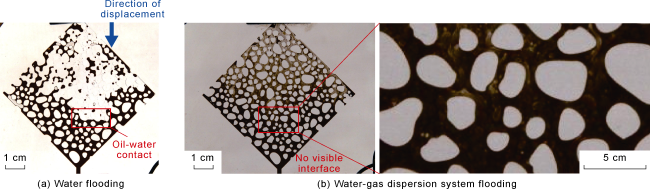
Fig. 6. Comparison of oil-water interface between water flooding and water-gas dispersion system flooding. |
In order to study the mechanism of the water-gas dispersion system in mobilizing the isolated residual oil in the main flow channel, the ball-stick standard model was used to conduct displacement experiments of water flooding and water-gas dispersion system flooding after water flooding. There is a large amount of residual oil in the main flow channel after water flooding, and it is mainly distributed in the transverse channels (Fig. 7a ). The analysis shows that after the formation of the main water-phase flow channel, the pressure on both sides of the transverse pore channel is basically equal, i.e., an isobaric region is formed. When residual oil exists inside it, the adsorption effect of the pore wall binds it stably. In the dispersion system flooding after water flooding, microbubbles can enter the oil phase, so that a small pressure difference is generated between two sides of the transverse pore channel, and then gradually expands, leading to the formation of non-steady pressure fluctuation state. The reciprocating movement of microbubbles in the transverse pore channel plays a role in scouring the residual oil (Fig. 7b ). The final overall oil displacement effect is shown in Fig. 7c , where the residual oil in most transverse pore channels is driven out and the degree of reserve recovery is greatly improved, which is consistent with the results of the pore structure model.
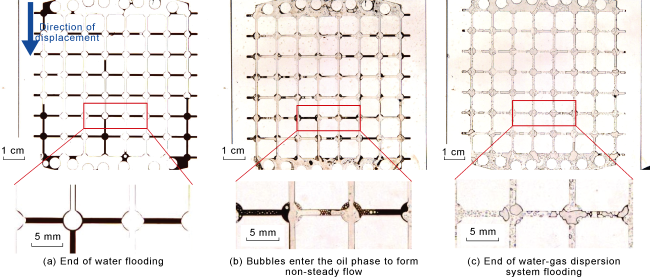
Fig. 7. Mechanism of water-gas dispersion system in mobilizing the isolated residual oil in the main flow channel. |
2.2. Microbubble vibration phenomenon
In addition to the obvious difference in the effects of the two types of flooding, a typical bubble vibration phenomenon was found during the displacement process of the water-gas dispersion system, as shown in Fig. 8. In order to reduce pressure fluctuations caused by the flow and interference with the observation, the position of the blind end, where the flow is weaker, was selected for analysis (Fig. 8a ). Comparison of the selected observation bubbles in Fig. 8b and 8c after zooming in on the observation position reveals that the bubbles have rhythmic expansion-contraction, i.e., they vibrate themselves.
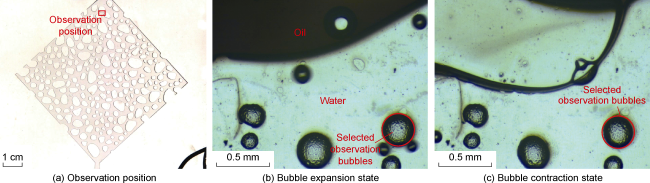
Fig. 8. Vibration phenomenon of gas bubbles in crude oil. |
Both crude oil and bubble boundaries in the above experiments were black, which interfered with the observation and analysis. In particular, the presence of bubbles and water droplets within the crude oil was also identified in the displacement experiments with crude oil, but still interfered by the too dark color of the crude oil. In order to deeply study the microbubble vibration phenomenon and the mechanism of action, kerosene was used to carry out the corresponding experiments. As shown in Fig. 9 , the vibration phenomenon of bubbles is obvious. And Fig. 9c shows the diameter changes corresponding to the expansion and contraction states of bubbles.
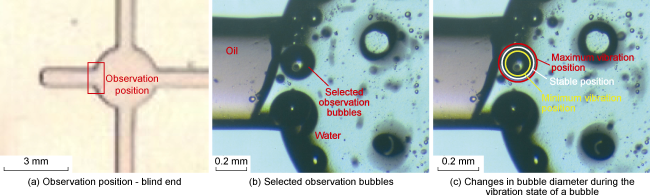
Fig. 9. Bubble vibration phenomenon in kerosene. |
Within the tiny space of the pore structure, the impact of the vibration effect of individual microbubble may not be significant, but with a large number of microbubbles, the combined effect of vibration has a significant effect on driving the remaining oil.
2.3. Effects of microbubble vibration on residual oil
2.3.1. Vibration accelerates the adsorption process of microbubbles and oil droplets
In order to eliminate the kinetic effect of the flow, the blind end location was still chosen for the study, as shown in Fig. 10. The slower moving bubbles first accumulate at the entrance of the blind end and then slowly penetrate into the interior. The number of microbubbles in the first section is small and then increases gradually. Both water- and gas-flooding methods form an interfacial film at the entrance of the blind end, which prevents the movement of the remaining oil inside the blind end. The analysis shows that the vibration of the microbubbles on the one hand produces a weak pressure fluctuation, and on the other hand, the vibration facilitates the adsorption of the microbubbles to the oil phase, so that the subsequent microbubbles enter the oil phase to push the bubbles that has already entered the oil phase to move to the deeper part of the oil phase. This process indirectly creates the effect that the microbubbles extrude the remaining oil out of the blind end.
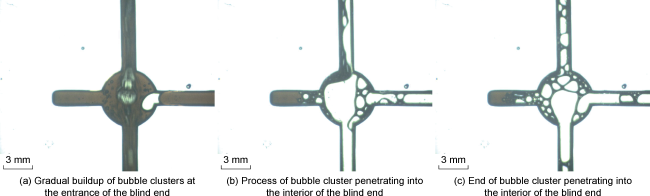
Fig. 10. Bubble vibration accelerating adsorption process. |
The details of the adsorption process between microbubbles and oil film can be clearly observed in the kerosene displacement experiment, as shown in Fig. 11. It shows that the oil film is finally driven out completely from the blind end in a total time of 63 s. Fig. 11 shows the processes of collision, contact, adsorption and entry of microbubbles of different sizes into the oil film within 5.5 s, and also quantitatively calculates the moving distance of the oil film. Fig. 11a identifies the initial position of the residual oil boundary; in Fig. 11b , small bubbles adsorb on the oil film and enter the interior of the oil film, the vibration generated by the larger bubbles drives the vibration of the oil film interface, and a small amount of oil is transported out of the blind end along the pore wall; and Fig. 11c shows the position of the oil film boundary at 5.5 s. The process involved about 60 microbubbles with a bubble diameter of 10 μm continuously contacting the oil film. Eventually the oil film boundary moved by 20 μm, corresponding to a volume of about 7×10⁻³ μL, which is equivalent to an oil droplet with a diameter of 240 μm. In the experimental process of water flooding and gas flooding, once a stable flow channel is formed, it is difficult for the continuously flowing water or gas to move the remaining oil. And the bubble vibration phenomenon accelerates the mass transfer process between the bubble and the oil phase, as well as the adsorption process of bubbles to oil film.
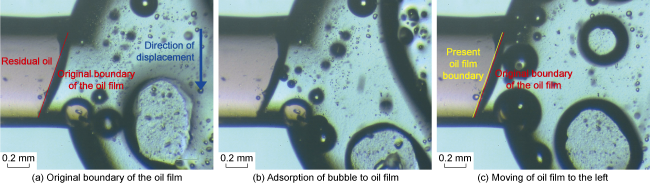
Fig. 11. Bubble vibration carrying oil film. |
2.3.2. Bubble vibration accelerates oil droplet expansion
The entry of microbubbles into the oil phase by vibrational action obviously also contributes to the elastic expansion of the oil phase. Fig. 12 illustrates the entry of bubbles into the interior of the oil film. Zooming in on the region of the observation position chosen for Fig. 12a yields Fig. 12b , 12c, and 12d. Microbubbles in the flow state can change the direction and be adsorbed by the oil film to enter it. The analysis shows that the vibration effect is the key factor. It was observed that the volume of bubbles reduces after they enter the oil film. It is judged that part of the gas enters the oil phase due to dissolution. The dissolved gas absorbed by the oil phase as well as the microbubbles entering the oil phase will make the oil phase expand in volume, so as to improve the fluidity.
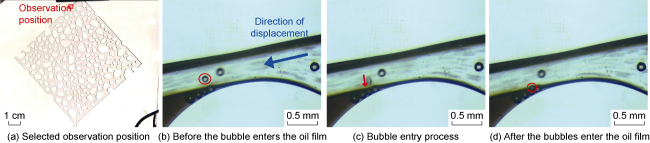
Fig. 12. Bubble vibrates into the oil film. |
2.3.3. Bubble vibration promotes crude oil emulsification
A complex form of crude oil emulsification phenomenon was found in the process of crude oil displacement by water-gas dispersion system, i.e., there are water droplets in the oil phase, which are separated by oil film, and the overall water-in-oil state is shown in Fig. 13. Increasing the brightness of the picture also reveals that the oil droplets contain a large number of microbubbles, which are mainly distributed at the interface position between the oil phase and the water droplets. Fig. 13a shows the state of the water droplets before entering the oil phase; Fig. 13b and 13c show the state of the water droplets entering the interior of the oil phase, where the water droplets rapidly enter the oil phase with a rapidly decreasing velocity and remain in a stable ordering state with the water droplets inside the oil phase. The emulsification phenomenon is not a surfactant effect because no chemicals are added to the water-gas dispersion system. Combined with the high-density distribution of microbubbles in the oil film between droplets, it can be deduced that the microbubbles show strong adsorption to both oil and water, playing a role similar to that of a surfactant, which contributes to the stabilization of the oil film between the droplets and prevents the droplets from merging. The bubble diameters labeled in Fig. 13c are in the range of 5-50 μm. The gases in the water-gas dispersion system are mainly present as micrometer-sized bubbles, with the rest as dissolved gases and nanosized bubbles[27]. Since nanobubbles have stronger interfacial adsorption capacity, they should also be mainly distributed at the oil film interface. The vibration effect of microbubbles promotes the adsorption of oil and water phases, which divides the continuous water phase and promotes the emulsification of crude oil. Crude oil emulsification can increase the seepage resistance, change the original stable seepage direction, and improve the sweep efficiency. The emulsified crude oil caused by microbubbles is easier to be stripped, which improves the microscopic displacement efficiency.
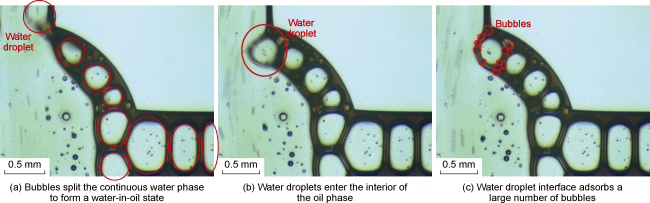
Fig. 13. Crude oil emulsification. |
3. Characteristics and laws of microbubble vibration
3.1. Vibration characteristics
Combined with the experimental phenomena and analysis, the vibration characteristics of microbubbles were discussed in depth by using the equal-diameter model. Comparing with the front interface changes of water flooding and gas flooding makes it easy to judge and identify the characteristics of microbubbles in the process of water-gas dispersion system flooding, and thus the simulation was carried out for the three kinds of flooding methods.
The simulation process and the results can be displayed through the pressure cloud diagram. The pressure cloud diagram can clearly display the pressure value of each position, and the software achieves the accuracy of 0.001 Pa, and has considered the noise processing problem. The analysis focused on the change rule of pressure in the vicinity of the displacement front interface, as shown in Fig. 14. The density distribution can clearly show the boundary of oil, gas and water three-phase fluid, the pressure distribution shows the pressure change, and the combination of the two is convenient for judging the fluid morphology.
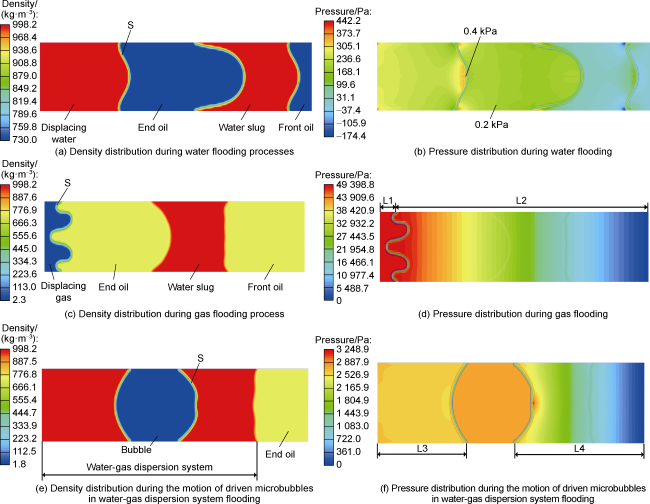
Fig. 14. Density and pressure distribution of flow field. |
In order to analyze the pressure changes at the front interface (S) of the water flooding and gas flooding as well as inside the microbubbles, the pressure data changes at the displacement front in the simulation were plotted as curves based on the pressure distribution graphs. Since the initial pressures of the three flooding methods were different, the normalization method was used to compare the differences in the pressure curves, as shown in Fig. 15.
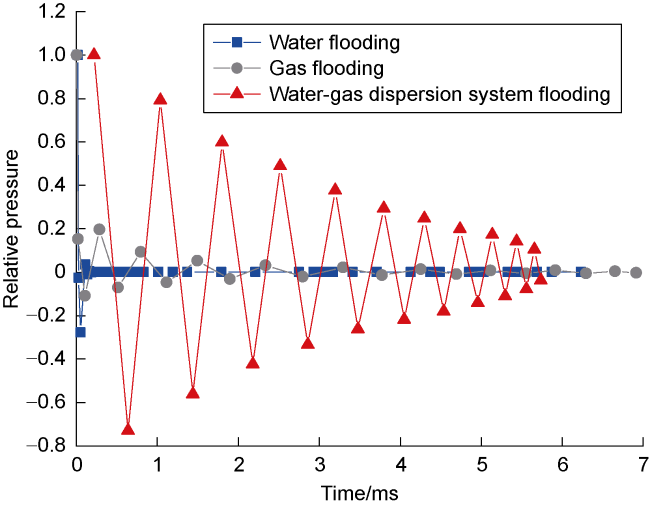
Fig. 15. Normalized pressure change curve (relative pressure is the ratio of displacement front pressure at one moment to the original pressure in each flooding mode). |
In the process of water flooding, the pressure amplitude is the largest at the beginning, up to 450 kPa, and then it decays rapidly with a fluctuation process of no more than 0.2 ms, after which a stable flow is formed, and thus the fluctuation phenomenon can be ignored.
Different from water flooding, gas flooding process exhibits longer period of pressure fluctuation. The initial pressure is large, with a peak value of 525 kPa, which is slightly higher than that of water flooding. After that, it shows an oscillating decay trend, and after 6 cycles, the relative pressure amplitude is lower than 0.1. The decay amplitude is large in the early stage and slows down in the late stage, and the cycle length shows the characteristics of increasing first and then remaining stable, with the pressure half-life of 0.18 ms, as shown in Fig. 16.
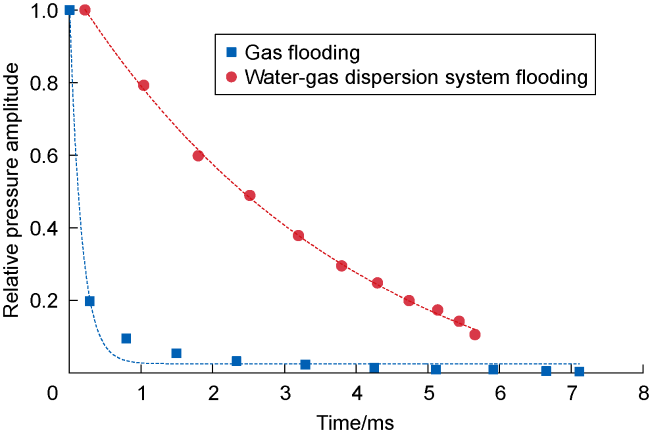
Fig. 16. Pressure decay law at the displacement front. |
From Fig. 15 , it can be seen that the internal pressure change characteristics of microbubbles in the water-gas dispersion system flooding are obviously different from those of water flooding and gas flooding. The vibration phenomenon of microbubbles, i.e., pressure fluctuation phenomenon, is obvious, the decay rate is slow, and the pressure half-life reaches 2.5 ms, which is significantly higher than that of gas flooding (Fig. 16 ). The pressure change is in the form of a sinusoidal function, and the amplitude of the pressure vibration in the same direction decays exponentially (Fig. 16 ). The decay function is:
$ D=C_{1} \mathrm{e}^{-\frac{t}{C_{2}}}+C_{3}$
C2 in Eq. (1) reflects the speed of decay. The C1, C2 and C3 of gas flooding are 1.00, 0.17 and 0.02 respectively, and the C1, C2 and C3 of water-gas dispersion system flooding are 1.25, 3.99 and -0.18 respectively. The C2 value of gas flooding is significantly lower than that of water-gas dispersion system flooding, i.e., water-gas dispersion system flooding has a slower pressure decay.
$ T_{x}=T_{1}-0.06 x$
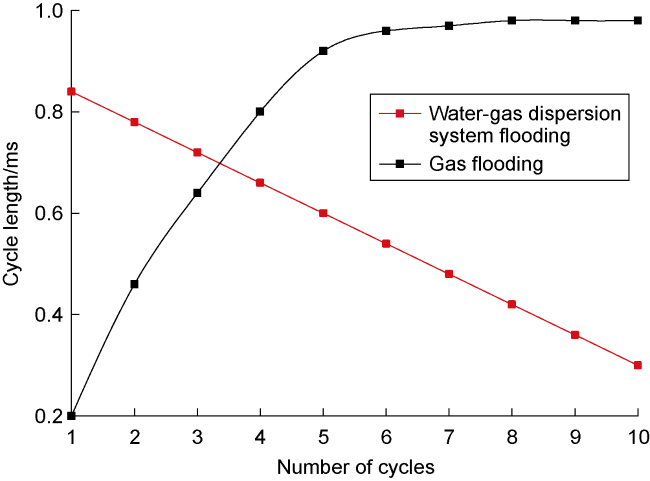
Fig. 17. Pressure change cycle curve. |
The linear change of vibration period makes the microbubble vibration show rigid vibration characteristics, that is, the elastic coefficient is constant. In contrast, the energy of the gas flooding process is released in large quantities at the initial stage, and the elastic energy at the later stage is extremely small.
From the above analysis, it can be seen that gas-liquid interface only exists at the gas displacement front during the gas flooding process, and its number is significantly lower than the number of microbubbles in the water-gas dispersion system, and thus its interfacial fluctuation contributes to the recovery enhancement of the gas flooding in a negligible way. On the contrary, although the initial pressure amplitude of individual microbubble is much lower than that of gas flooding, the cumulative effect on the oil displacement effect is significant due to their huge number.
3.2. Vibration energy release law
The peaks and valleys of the pressure fluctuation curve are used to plot isotropic pressure decay curve (Fig. 18 ), so the energy difference between the peaks and valleys in a cycle reflects the size of the energy released by the bubble to the outside. The released energy is calculated by the following formula:
$ J=\Delta p V$
$ \Delta D=y_{\mathrm{f}}-\left|y_{\mathrm{s}}\right|$
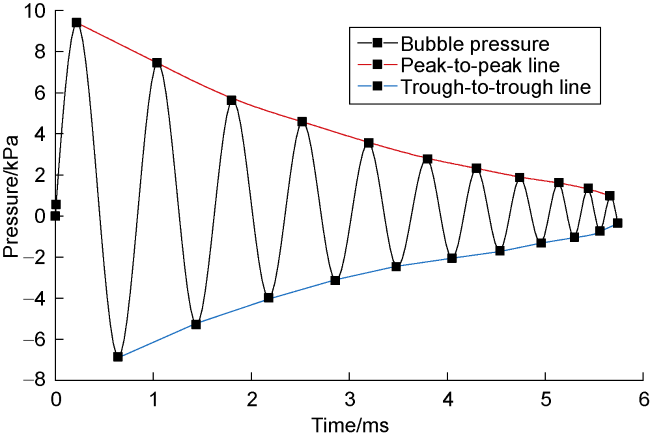
Fig. 18. Bubble pressure fluctuation function analysis. |
The previous experimental data from our research team [15] show that the energy required to push an oil film with a volume of 0. 5×10⁻³ μL (equivalent to a 100 μm diameter oil droplet) is 0. 2×10⁻⁶ J. Calculation shows that the bubble volume in Fig. 14c is 0.5 μL, and the energy released by bubble vibration during the half-life period has reached 0.65×10⁻⁶ J to push three 100 μm oil droplets.
Obviously, the frequency of bubble vibration is related to the rate of energy release, and the higher the vibration frequency, the higher the efficiency of energy release from bubbles. Although the energy released by the bubbles in a single cycle is weak, the higher vibration frequency and the large number of bubbles greatly increase the ability of the microbubbles to utilize the residual oil.
3.3. Effects of vibration on the flow field
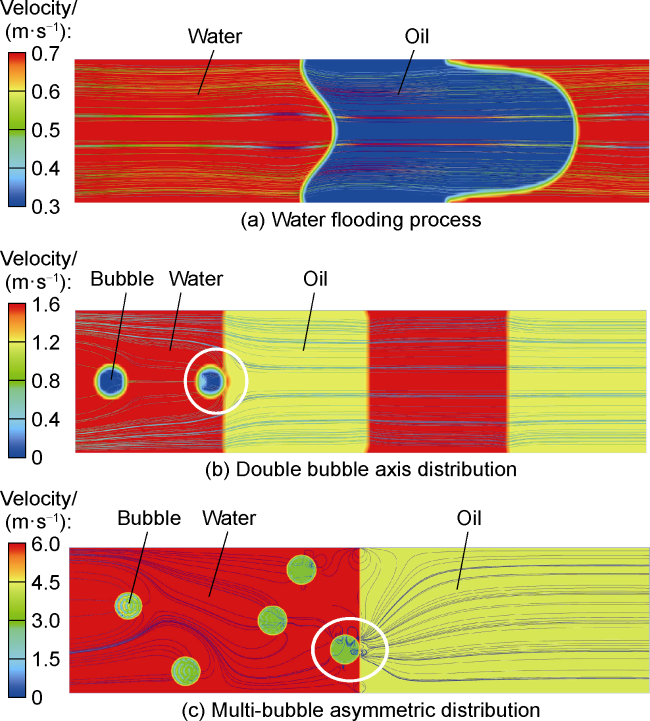
The vibration effect of microbubbles will not only enhance the microscopic effects such as adsorption of oil phase, but also affect the flowline state. The flowlines in the process of water flooding and water-gas dispersion system flooding were analyzed. Fig. 19a shows that the flowlines of water flooding process are approximately straight line, and there is no obvious change at the oil-water interface. Fig. 19b and 19c are the flowline diagrams of the water-gas dispersion system flooding, reflecting that the number and distribution of bubbles significantly affect the flow line. In Fig. 19b , the bubbles are small in quantity and axially distributed, and they disturb the flow field weakly. The degree of flow field perturbation around the bubbles at the oil-water interface is large, and the flow line bends symmetrically along the bubbles (the white circles). In Fig. 19c , the number of bubbles increases and the distribution position is asymmetric, so that the perturbation effect on the flow field is enhanced, and the flow line inside the water phase has formed a large bending. The bubbles at the oil-water interface have the greatest influence on the oil-phase perturbation (see the white circle), and the flow line is a vortex that diverges outward due to the vibration of the bubbles.
Fig. 19. Streamline diagram of the flow field. |
The above understanding explains the phenomenon that the stable state of the residual oil in the transverse pore channel is gradually destroyed by the vibration of microbubbles in the ball-and-stick standard model experiments, which then generates an alternating pressure difference between the two sides of the pore channel and creates a repeated scouring phenomenon. Similarly, the above understanding also explains the utilization mechanism of the isolated residual oil in the pore structure model.
4. Conclusions
The vibration phenomenon of rhythmic expansion- contraction of microbubbles during water-gas dispersion system flooding was found within the pore structure, which is unique to the water-gas dispersion system flooding. In the gas flooding process, a small amount of vibration phenomenon exists at the leading edge interface, but the attenuation pattern and the degree of effect are significantly different.
Microbubble vibration has three ways of action on pore residual oil: accelerating oil droplet adsorption, accelerating oil droplet expansion and promoting crude oil emulsification. These effects have an impact on the flow line of the seepage field, so that the oil phase is easy to flow, the seepage direction is changed, and the seepage field is converted to an unstable state, which enlarges the sweep volume, and improves the microscopic oil displacement efficiency.
Combining the experimental results of the glass-etching model and the core displacement model, it is shown that the water-gas dispersion system effectively enlarges the sweep volume and improves the microscopic oil displacement efficiency, which enhances the degree of reserve recovery on the basis of water flooding.
Nomenclature
C1, C2, C3—constants;
J—energy released in 1 cycle of bubble vibration, J;
p—relative pressure, dimensionless;
Δp—decay value of pressure in 1 cycle of bubble vibration, Pa;
t—time, ms;
T1—duration of the 1st cycle, 0.84 ms;
Tx—the duration of the xth cycle, ms;
V—the volume of the bubble, m3;
x—the number of cycles;
yf—peak pressure function, Pa;
yg—trough pressure function, Pa.