

Introduction
CO2 capture, utilization, and storage (CCUS) technology is currently an important technical approach for addressing the “carbon peak and carbon neutrality” goals [1-2]. In China, utra-low permeability reservoirs with abundant micro-nano scale pores are widely distributed. These reservoirs are rich in resources and important alternative sources of crude oil reservoirs, following medium-permeability and high-permeability reservoirs [3-4]. Such reservoirs, with oil resource reserves of tens of billions of tons and CO2 storage potential of several billion tons, have become one of the main targets for CCUS implementation [5⇓-7]. However, the evolution of the gas-liquid-solid interface, fluid occurrence state, migration pattern, and CO2 storage mechanism within the micro-nano pore throats is complex [8⇓-10]. Thus, clarifying the oil production characteristics and CO2 storage mechanisms during the CO2 flooding process in ultra-low permeability reservoirs is crucial to overcome the technical bottlenecks in CCUS technologies [11⇓-13].
Previous studies have extensively investigated the oil displacement and CO2 storage mechanisms during the CO2 flooding process. For instance, Hou et al. [14] conducted slim tube experiments and numerical simulations to examine the miscibility characteristics of CO2 and crude oil, injection-production parameters, and storage patterns in low-permeability reservoirs. They also compared the mechanisms and effects of CO2 flooding for enhanced oil recovery (EOR) in gaseous and supercritical states and predicted the CO2 storage potential under corresponding production regimes [15]. Zhang et al. investigated the phase equilibrium behavior of the CO2-CH4-H2O-NaCl system and conducted numerical simulations on CO2 injection for EOR and storage [16]. Their results indicated that CO2 injection can increase reservoir pressure, replenish reservoir energy, displace residual natural gas, improve recovery efficiency, and facilitate CO2 storage. Zhou et al. [17] studied the effect of reservoir heterogeneity on CO2-EOR and geological storage. They proposed a method using thermal foam gel systems to block high-permeability layers, thereby improving the CO2 flooding efficiency and CO2 storage in low-permeability reservoirs. Chen et al. [18] utilized nuclear magnetic resonance technology to investigate the CO2 storage forms and distribution characteristics after CO2 flooding. Their results showed that better core physical properties led to higher CO2 storage capacity and utilization efficiency. However, existing studies have not analyzed the pore scale, storage forms, and the synergistic relationship between oil production and CO2 storage during CO2 flooding in ultra-low permeability reservoirs. Furthermore, the impact of miscibility on oil production characteristics and CO2 storage patterns remains unquantified.
To address the above issues, taking the ultra-low permeability reservoir in the Jiangsu oilfield as an example, slim tube displacement experiments of CO2-oil system, injection capacity experiments, and high-temperature high-pressure online NMR displacement experiments were conducted to analyze the oil occurrence characteristics, oil-gas component mass transfer characteristics, and oil producing law under varying miscibility degrees during CO2 flooding. The results clarified the influence of miscibility on the CO2 storage pore size range and storage characteristics during the CO2 flooding process.
1. Experiments
1.1. Experimental sample
The core was obtained from the L block of the ultra-low permeability oilfield in Jiangsu. The core has a porosity of 11% and a permeability of 7×10⁻³ μm2. The core samples were cut into cylindrical specimens with diameter of 25 mm and length of 79 mm. Prior to each experiment, the core samples were thoroughly cleaned with toluene and then dried in an oven at 200 °C for 48 h until the core properties were restored to their initial state. The core samples from the target block were crushed and sieved to obtain rock fragments with particle sizes ranging from 30 μm to 100 μm. These rock fragments were then packed into a 20 m-long slim tube, where high-pressure nitrogen gas was used to compact the fragments. The resulting coiled tube had a porosity of 18% and a permeability of 10×10-3 μm2.
The original formation pressure of the L block is 30.3 MPa, the saturation pressure is 17.0 MPa, and the formation temperature is 110 °C. The gas-to-oil ratio is 94 m3/m3, and the degassed oil density is 0.826 g/cm3. Based on the results of high-temperature, high-pressure pressure-volume-temperature (PVT) experiments, the dissolved gas components and degassed oil components of the target reservoir were determined, as shown in Table 1 . Under the reservoir temperature and pressure conditions, the degassed oil and dissolved gas were mixed in accordance with the gas-to-oil ratio (GOR) in target block to prepare the gas-bearing live oil using a high-temperature, high-pressure mixing apparatus. The prepared oil sample was tested and confirmed to have the same fluid properties as the original reservoir fluid, meeting the experimental requirements.
Table 1. Components of the degassed oil and dissolved gas |
| Degassed oil | Dissolved gas | ||
|---|---|---|---|
| Components | Mole fraction/% | Components | Mole fraction/% |
| C1-C5 | 2.35 | CO2 | 0.83 |
| C6-C10 | 29.41 | N2 | 2.04 |
| C11-C20 | 33.75 | CH4 | 74.76 |
| C21-C30 | 27.47 | C2H6 | 10.06 |
| C30+ | 7.02 | C3H8 | 5.74 |
| C4H10 | 3.35 | ||
| C5H12 | 3.22 | ||
Ion concentration tests were conducted on the formation water from the L block, where the mass concentrations of K++Na+, Ca2+, Mg2+, Cl-, SO42- and HCO32- were 3 409, 10, 4, 3 892, 968, and 1 169 mg/L, respectively. To prevent interference from the 1H signal of conventional water during NMR experiments, deuterium oxide (D2O) was used to prepare the formation water in target block.
1.2. Slim tube displacement tests of CO2-oil system
CO2-oil system miscibility tests were conducted based on the prepared gas-bearing live oil samples and long slim tube. The experiment was conducted according to the Method for determining the minimum miscibility pressure: Capillary tube method (SY/T 6573-2016) [19]. Nine sets of experiments were performed using a multifunctional core flooding system under experimental pressures of 15, 17, 19, 24, 25, 27, 31, 33 and 35 MPa, with enhanced measurement points in the slim tube setup. Parameters such as CO2 injection volume, GOR, mole fraction, and oil production were monitored at different pressures and time intervals. A relationship curve between injection pressure and oil recovery factor was obtained. The pressure intervals for the CO2-oil system were categorized into immiscible, near-miscible, and miscible stages. The products at the output end were collected and subjected to chromatographic analysis.
1.3. CO2 injection capacity tests
The experimental equipment primarily includes an ISCO high-precision constant pressure pump (Corelab, USA) with a pressure accuracy of 0.05 MPa and a flow rate accuracy of 0.001 mL/min; a high-temperature, high-pressure core holder with a maximum pressure of 70 MPa; a high-precision pressure monitoring system with a pressure accuracy of 0.001 MPa; and a MacroMR12-150H-HTHP large-aperture low-field NMR instrument (Suzhou Niumay Analysis Instruments Co., Ltd.), etc. The confining liquid in the core holder was FC-3283 fluorinated liquid, produced by 3M (USA), to avoid interference from the 1H hydrogen signal, and the core casing was made of high-pressure heat-shrinkable tube.
Experimental procedure:
(1) The heating system was turned on to raise the temperature of the entire system to 110 °C, and the cleaned core was dried for 48 h.
(2) The core was placed in the holder and vacuumized. The system pressure was adjusted to above the saturation pressure using petroleum ether.
(3) Two pore volumes (PV) of live oil were injected into the core to ensure that pores of the core were fully saturated with live oil.
(4) CO2 was injected at a constant flow rate of 0.01 mL/min, while monitoring the upstream pressure changes during injection. The pressure differential between the inlet and outlet was calculated, and the CO2 injection capacity was evaluated using the injection index formula as shown in Eq. (1) [20].
(5) The experimental pressure was adjusted to 22, 26, 30, and 35 MPa, and steps (1)-(4) were repeated.
(6) The displacing fluid was switched to water, and steps (1)-(5) were repeated to compare the CO2 and water injection capabilities.
$I=\frac{Q}{A\Delta p}$
1.4. On-line NMR displacement experiments
The CO2 flooding experiment monitored by online NMR, is an important method for evaluating CO2-EOR, the producing characteristics of crude oil, and the CO2 storage potential. The high-temperature and high-pressure online NMR monitoring system was calibrated using a constant-rate mercury injection test, and CO2 flooding experiments were conducted at different oil-gas miscibility degrees.
The experimental devices are shown in Fig. 1 , and the experimental procedure includes the following steps:
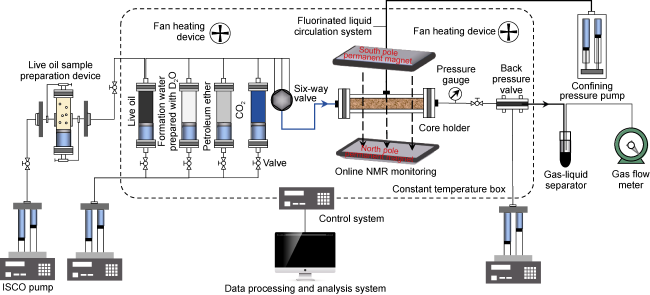
Fig. 1. The experimental device of CO2 flooding monitored by on-line NMR. |
(1) The cleaned core was fixed on the holder of the high-temperature, high-pressure online NMR analyzer using heat-shrinkable tubing. The system was heated to 110 °C, and the core was vacuumized. Petroleum ether was used to increase the system pressure above the saturation pressure.
(2) Formation water, prepared with D2O, was slowly injected into the core at a rate of 0.05 mL/min. Following this, the core was saturated with gas-bearing live oil. The core was considered fully saturated when the gas-oil ratio at the production end remained constant at 94 m3/m3. At this point, the NMR T2 spectrum and 3D image were scanned.
(3) The inlet valve of the core holder was opened, and CO2 was injected at pressures corresponding to miscible, near-miscible, and immiscible conditions of the oil-gas system. Confining pressure was applied to the core via a fluorinated liquid circulation system to exceed 3 MPa. CO2 was then injected into the core at a constant rate of 0.10 mL/min, totaling 1.2 PV. After stabilization, the NMR T2 spectrum and 3D image were scanned again, and the produced fluids at the output end were collected.
2. Results and discussion
2.1. Characterization of miscible degrees of CO2-oil system
The fitting curves of injection pressure versus oil recovery factor for the nine sets of slim tube experiments are shown in Fig. 2 . On this basis, the pressure intervals corresponding to the immiscible, near-miscible, and miscible stages of the CO2-oil system were delineated. As the degree of miscibility increased, the oil recovery factor continuously increased. In the immiscible region, the oil recovery factor exhibited a linear increase with injection pressure. A turning point was observed at 25.3 MPa, where the recovery factor began to increase more slowly and continued to rise until it reached the turning point of Stage 3 at 30.1 MPa, marking the entry into the miscible phase. Based on the previous research and the results from the slim tube experiments, the minimum miscibility pressure (MMP) for the L Block of the Jiangsu oilfield is 30.1 MPa [13]. The near-miscible pressure interval ranges from 25.3 MPa to 30.1 MPa, while the upper limit of the immiscible pressure is 25.3 MPa.
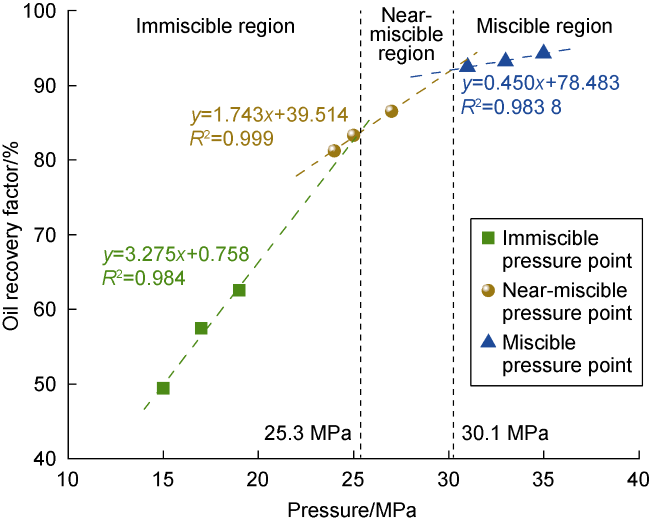
Fig. 2. Fitting curves of injection pressure and oil recovery factor of CO2-oil system. |
2.2. Effect of miscible degree on production characteristics of CO2 flooding
CO2 injection capacity is an important basis for evaluating the feasibility of development methods and parameters optimization in ultra-low permeability reservoirs. The injection capacity differences of CO2 and water under different pressure conditions in the target block are assessed based on the injection capacity index equation. As shown in Fig. 3 , under immiscible pressure conditions (22 MPa), the injection capacity indices for CO2 and water are 0.065 3 and 0.010 6 m3/(d·MPa·m2), respectively. Due to the higher compressibility and greater solubility in crude oil of CO2 compared to water, the degree of improvement in oil properties is significant. Therefore, as the degree of miscibility increases, the CO2 injection capacity index increases exponentially, while the water injection capacity index increases slowly at first and then levels off. When the system pressure reaches the MMP, the oil-gas interfacial tension becomes zero, eliminating capillary pressure, which leads to a significant increase in CO2 injection capacity. Under different pressure conditions, the CO2 injection capacity index is 6.16 to 9.03 times that of water, indicating that CO2 is an ideal injection medium for the target ultra-low permeability reservoir.
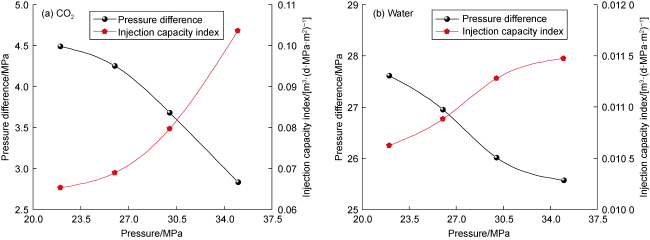
Fig. 3. CO2 and water injection capacity indices under different pressure conditions. |
The CO2 flooding process is divided into three main stages based on the GOR and oil recovery factor charac-teristics: oil displacement stage by CO2, CO2 breakthrough stage, and gas channeling followed by CO2 extraction stage. The CO2 injection volumes corresponding to miscible, near-miscible, and immiscible flooding stages and different oil displacement stages are shown in Fig. 4a and 4b . During the displacement stage, the GOR remains at its original state, the oil-gas interface moves steadily, and oil recovery degree increases approximately linearly with CO2 injection volume. At CO2 breakthrough stage, the GOR rises, and the rate of oil recovery degree increase slows. Following gas channeling, during the CO2 extraction stage, the GOR increases sharply, and oil recovery degree increases slowly until it stabilizes, and the mass transfer between CO2 and oil becomes the primary mechanism for further EOR. Increasing the degree of miscibility enhances oil recovery factor and production rates. In laboratory experiments, the CO2 miscible flooding recovery factor reached 79.0%, which was 11.7 and 18.0 percentage points higher than the near-miscible and immiscible flooding recovery factors, respectively. Due to the viscous fingering effect of CO2 in the immiscible flooding phase [21⇓-23], gas channeling occurs earlier, and the CO2 injection volume required to reach breakthrough in the miscible flooding phase is 0.20 PV and 0.07 PV higher than in the immiscible and near-miscible flooding phases, respectively. These findings indicate that increasing the degree of miscibility improves the stability of the oil-gas front movement, extends the displacement stage in the early production period, and increases sweep efficiency.
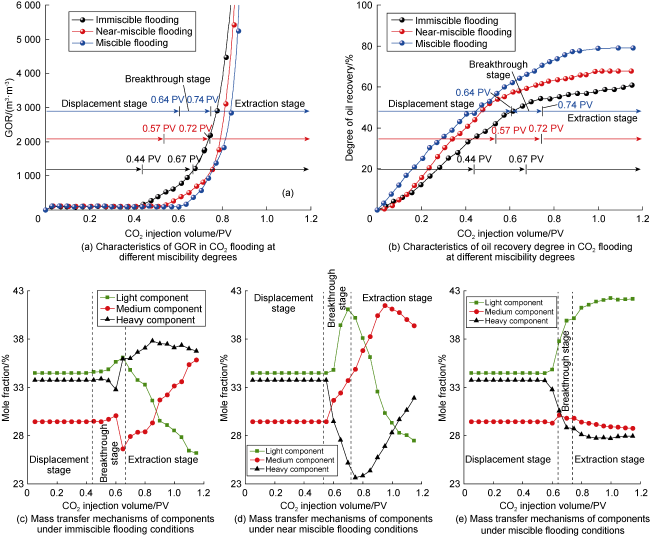
Fig. 4. The effect of miscibility degree on CO2 flooding performance and oil-gas component mass transfer. |
The initial molar fractions of light (C1-11), medium (C12-20), and heavy components (C21+) in the crude oil are 35.3%, 29.4%, and 34.5%, respectively, with CO2 comprising 0.8% of the system. The composition of the produced fluids was analyzed using gas chromatography (Fig. 4c-4e ). The solubility capacity, viscosity reduction of CO2 and oil swelling capacity increase with pressure. During the displacement stage, there is no significant change in the crude oil composition, indicating that this stage primarily relies on the viscosity reduction of oil and swelling effects of CO2 to enhance oil recovery. Under immiscible flooding conditions, after CO2 breakthrough, the extraction effect of CO2 is relatively weak [24]. By the end of the development period, the combined fraction of medium and heavy components in the produced fluids reaches 73.8%, while the light components show a decreasing trend with continued CO2 injection (Fig. 4c ). When the pressure increases to near-miscible condition, the produced fluids during the early CO2 breakthrough are dominated by light and medium components. During the CO2 extraction stage, the heavy component content in the produced fluids decreases by 4.9 percentage points compared to immiscible flooding (Fig. 4d ). Under miscible flooding conditions, after CO2 breakthrough, the light component content in the produced fluids increases to 42.2% as the CO2 injection volume grows. Concurrently, the medium component content shows a slight decreasing trend, while the heavy component content decreases by 6.0 percentage points due to its weaker mobility during fluid migration (Fig. 4e ). Therefore, the mass transfer between CO2 and crude oil progressively becomes the primary mechanism for enhancing oil recovery after CO2 breakthrough.
2.3. Crude oil production under different miscibility degrees in CO2 flooding
Constant-rate mercury intrusion experiments were conducted on rock samples from the target block. The results showed a prolonged plateau stage at high mercury saturation, with a median pressure of 1.36 MPa, a maximum mercury saturation of 85%, a displacement pressure of 0.17 MPa, and a low mercury removal efficiency. The samples exhibited a median pore radius of 0.54 μm, and relatively uniform structural distribution of pores with good connectivity.
Studies have shown that the T2 distribution obtained via NMR can effectively characterize the pore size distribution of reservoir rocks [24⇓⇓-27]. Therefore, low-field NMR technology was utilized to generate T2 spectra of natural cores from Block L. Using a conversion factor between transverse relaxation time and pore radius, the T2 spectra were transformed into pore radius distribution curves, which facilitated the classification of reservoir pore-throat types.
The transverse relaxation time T2 in NMR is associated with the surface relaxation rate of the rock as following Eq. (2) [28]:
$\frac{1}{{{T}_{2}}}={{\left( \frac{1}{{{T}_{2}}} \right)}_{S}}+{{\left( \frac{1}{{{T}_{2}}} \right)}_{B}}+{{\left( \frac{1}{{{T}_{2}}} \right)}_{D}}$
Among this, S, B, D represent surface relaxation, bulk relaxation, and diffusion relaxation, respectively. Due to the significantly higher surface relaxation rate, the effects of diffusion relaxation and bulk relaxation are negligible. Therefore, the T2 can be characterized by transverse relaxation intensity ρ and geometric shape factor Fn [29-30]:
${{T}_{2}}=\frac{{{r}_{c}}^{n}}{\rho {{F}_{n}}}$
The relationship between T2 and pore radius can be expressed by the following equation:
${{r}_{c}}=C{{T}_{2}}^{\frac{1}{n}}$
Based on the results of mercury intrusion and NMR experiments, the cumulative frequency distribution curves of pore radius and transverse relaxation time are shown in Fig. 5a . Using Eq. (4), the parameters C and n were determined to be 0.002 and 0.648, respectively. These values were then used to calibrate the T2 spectrum obtained from the NMR experiments. According to the T2 spectra’s left and right peaks and capping situation, the pores were classified into three categories: small pores (less than 1 μm), medium pores (1-18 μm) and large pores (greater than 18 μm). The oil percentage within different sizes of pores in the target block was found to be 28.8% in small pores, 37.2% in medium pores, and 34.0% in large pores (Fig. 5b ).
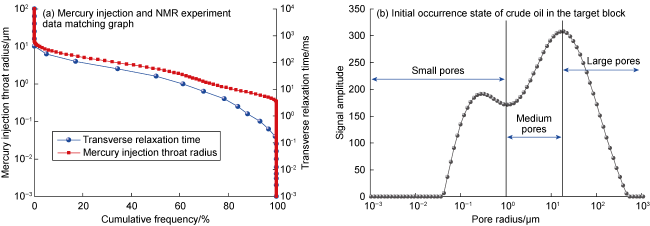
Fig. 5. Mercury injection experiment and NMR experiment data matching graph (a) and the initial occurrence state of crude oil (b). |
The online NMR monitoring results of the CO2 flooding process under different miscibility conditions are shown in Fig. 6 . As CO2 preferentially enters large pores with lower resistance and contacts the crude oil [31], the crude oil in the large pores of the core is preferentially produced. With continued CO2 injection, the minimum threshold size for pore with oil production decreases, and the crude oil recovery in medium pores gradually increases. In the later stage of CO2 flooding, the crude oil in small pores becomes the primary target for recovery. Furthermore, as the diameter of CO2 molecules is smaller than that of the primary nanopore-throats in the target reservoir, CO2 carries some of the light components of the crude oil into the nanopores along the flow path. Due to the actuating pressure and high capillary resistance existed in nanopore-throats, this portion of crude oil becomes more difficult to recover and is considered residual oil. Therefore, the recovery of crude oil during the CO2 flooding process can be roughly divided into three stages: (1) In the early flooding stage, the producing degree in large pores is the highest; (2) In the mid-flooding stage, the crude oil in medium pores becomes a reserve for incremental recovery; (3) In the late flooding stage, the producing degree in small pores increases, and CO2-encapsulated crude oil flows into even smaller pores. Based on the changes in NMR signal amplitude before and after CO2 flooding experiments, the crude oil recovery factor in different pore sizes can be obtained. Under non-miscible, near-miscible, and miscible flooding conditions, the recovery factor in large pores is 33.7%, 35.3%, and 33.4%, respectively; in medium pores, it is 20.5%, 23.4% and 26.0%, respectively; and in small pores, it is 15.1%, 17.2% and 17.2%, respectively.

Fig. 6. Crude oil production characteristics during CO2 flooding under different miscibility conditions. |
As the miscibility degree increases, the crude oil producing degree in large and medium pores improves, while the producing degree in small pores remains low due to higher flow resistance and the migration of some crude oil into nanopores. The total crude oil recovery factor is calculated by the change in accumulated signal amplitude (Fig. 6b, 6d, 6f ). When the displacement pressure increases from 22 MPa to 26 MPa, the oil-gas system transitions from immiscible state to near-miscible state, and the crude oil recovery factor increases from 60.9% to 67.8%, with an increase of 6.9 percentage points. The lower limit of the pore radius with oil production decreases from 5.7 nm to 4.8 nm. When the displacement pressure rises to 35 MPa, the interfacial tension between crude oil and CO2 disappears, and the kinetic energy of CO2 molecules increases, raising the crude oil recovery factor to 79.0%. The lower limit of the pore radius with oil production decreases to 2.4 nm, significantly enhancing the crude oil production capacity. As shown in Fig. 7 , large pores serve as the main zone for oil recovery by CO2 flooding under different miscibility degrees, contributing over 46% to the total crude oil recovery. Medium pores act as the succeeding zone, contributing over 30%. Therefore, as the pressure level increases, the crude oil recovery in large and medium pores becomes more pronounced, while recovery in small pores remains challenging. The pressure adjustment limits should be based on the radius limits of large and medium pores with oil production, rather than the recovery degree in small pores.

Fig. 7. Contribution rate of different pore scales to the total recovery under different miscibility degrees. |
2.4. CO2 storage mechanisms during CO2 flooding process
The primary CO2 storage mechanisms in reservoirs include structural storage, dissolution storage, bounded storage and mineralization storage [32]. Among them, mineralization storage tends to stabilize after several decades or even centuries [33]. Due to the low mass concentration of calcium and magnesium ions in the formation water of the target reservoir (less than 10 mg/L) and the experimental time constraints, mineralization storage can be negligible. In this study, structural and dissolution storage are collectively referred to as free-phase storage, while CO2 migration into small pores is considered bounded storage. In the later stage of CO2 flooding, a large amount of CO2 produced from the production well leads to a sharp decline in the storage efficiency and oil recovery rate. Considering the shut-in conditions for the target oil field by CO2 flooding, the CO2 flooding experiment using NMR ends when the GOR at the production end reaches 2 000 m3/m3. As shown in Fig. 8 , under immiscible flooding conditions, CO2 primarily displaces crude oil from the upper part of the core and is stored in the pores containing the produced oil in a free-phase state. As the miscibility degree increases, the CO2 front advances more stably and sweeps a wider area. Under the same conditions, the CO2 storage range becomes larger, and the buoyancy effect weakens, leading to a more uniform vertical distribution of CO2, thus alleviating the leakage risk of caprock during CO2 storage due to gravity override effects.

Fig. 8. CO2 storage morphology and distribution in pores under different miscibility conditions during the flooding process. |
Corresponding to the oil displacement stage, breakthrough stage and extraction stage, CO2 storage is divided into three stages: (1) The complete storage stage, where the injected CO2 completely replaces the crude oil, and free-phase CO2 is stored in the pores that contain the produced oil; (2) The CO2 escape stage [34-35], where the CO2 front moves toward the production wellhead, and some CO2 escapes, causing a slight decrease in dynamic storage efficiency; (3) The CO2 leakage stage, where the GOR in the production well increases rapidly, and CO2 leaks massively along the dominant flow paths, resulting in a sharp decline in CO2 storage efficiency.
The cumulative summation of T2 signal amplitudes at different CO2 storage stages is calculated, and the CO2 storage efficiency is determined using Eq. (5) to analyze the CO2 storage potential during the flooding process:
${{S}_{C{{O}_{2}}}}=\frac{{{V}_{\text{i}}}-{{V}_{\text{p}}}_{~}}{{{V}_{\text{i}}}}\times 100 \%$
For the sake of comparison, the CO2 injection and production volumes during the CO2 flooding process under different miscibility degrees are normalized to standard conditions (0.1 MPa, 25 °C) for analysis. As shown in Fig. 9 , the CO2 storage efficiency before leakage in miscible flooding (injection volume 0.74 PV) is higher than that in near-miscible and immiscible flooding. After CO2 breakthrough, as the GOR increases, the CO2 storage efficiency sharply decreases. The cumulative CO2 storage in miscible flooding is 0.64 mL and 0.91 mL higher compared to near-miscible and immiscible flooding, respectively.
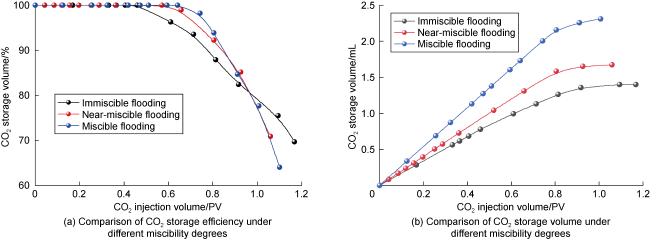
Fig. 9. Dynamic CO2 storage efficiency and storage volume under different miscibility degrees. |
As shown in Fig. 10 , in all three storage processes, the CO2 complete storage stage contributes the most to the overall storage volume. Under immiscible, near-miscible, and miscible conditions, the proportion of CO2 storage in this stage accounts for 47%, 64% and 71%, respectively. During CO2 complete storage stage, the storage of free-phase CO2 in large pores accounts for the largest proportion, with medium pores contributing the second largest proportion.

Fig. 10. The pore size range for CO2 storage and the proportion of CO2 storage volume in pores under different miscibility degrees. |
In the CO2 escape stage, the storage range of some crude oil in the pores does not undergo significant changes. The higher the miscibility degree, the smaller the remaining unsealed pore space from the complete storage stage, so the CO2 storage in this part decreases as the miscibility degree increases (shown in red part I in Fig. 10 ). Another portion of the light components from crude oil is carried by CO2, flowing into smaller pores that were originally without oil under the initial saturation conditions, increasing the bounded storage. As the pressure level increases, the kinetic energy of CO2 molecules and the evaporation-extraction effect become stronger, resulting in an increase in CO2 bounded storage under miscible conditions compared to near-miscible and immiscible conditions (shown in red part II in Fig. 10 ). Therefore, continuous CO2 injection during the escape stage triggers two storage mechanisms: (1) CO2 continues to displace the remaining oil from the displacement stage driven by pressure difference, achieving in-situ storage within the original pore size range occupied by crude oil; (2) CO2 carries some light components into smaller pore throats due to evaporation-extraction effect, where the smaller the pore size, the stronger the spatial confinement effect, thus enhancing the stability of storage.
Due to the higher miscibility, the remaining storage space at the micro-nanoscale in the CO2 escape stage becomes smaller, so the CO2 storage volume decreases as the miscibility degree increases in the leakage stage. Under near-miscible and immiscible flooding conditions, CO2 storage volume is higher than that under miscible flooding conditions. Since CO2 is discharged along the dominant gas migration channels during this stage, in-situ storage in the same size of pores is not significant, manifesting as CO2 carrying crude oil into smaller pores.
During the crude oil production and CO2 storage process, if the gas channeling has already formed in the reservoir, continued CO2 injection will lead to a large amount of CO2 flowing out along the dominant channels, causing a continuous decrease in the overall storage efficiency. At this point, it is necessary to block the dominant channels in the reservoir, improve CO2 flow paths, and promote lateral and vertical migration of CO2 into deeper parts of the reservoir to expand CO2 sweep efficiency. Therefore, based on parameters such as the GOR change characteristics at the production well, identifying the CO2 storage stage and adopting appropriate measures, such as well shut-in, profile modification, and blocking gas migration channels, can increase CO2 storage efficiency and storage volume.
3. Conclusions
The CO2 flooding process can be divided into the oil displacement stage, CO2 breakthrough stage and CO2 extraction stage after gas channeling. In the early stage of displacement, the expansion potential of crude oil is primarily enhanced through CO2 dissolution and viscosity reduction. After CO2 breakthrough, the main mechanisms for improving recovery are displacement and extraction of light components from crude oil. Under the experimental conditions in this work, the light component content in the produced fluid after CO2 breakthrough in the miscible flooding process increased to 42.2%.
During the CO2 flooding process, crude oil in large pores is preferentially recovered. Under the experimental conditions in this work, crude oil in large pores contributed more than 46% to the overall recovery rate. As CO2 injection continues, crude oil in medium pores becomes the main contributor to the increased oil recovery. After CO2 breakthrough, a small amount of crude oil in small pores is mobilized, and some of the extracted oil is carried by CO2 into the nanoscale pores.
With the increase in miscibility degree, the CO2 front advances more steadily, and covering a larger area. Under the same conditions, the range and volume of CO2 storage are larger, and the influence of buoyancy on CO2 is reduced, resulting in a more uniform vertical distribution. This mitigates the risk of caprock leakage caused by CO2 gravity override during the actual storage process. The CO2 complete storage stage contributes the most to the overall storage volume. The CO2 escape stage involves in-situ storage of crude oil within the initial pore size range and the entrainment of crude oil into smaller pores by CO2, which increases the storage volume. In the CO2 leakage stage, CO2 leaks out along with the produced crude oil, causing a sharp decline in CO2 storage efficiency.
Based on parameters such as the GOR changes at the production well, identifying the CO2 storage stage and adopting appropriate measures, such as well shut-in, profile modification, and blocking gas breakthrough channels, can enhance CO2 storage efficiency and storage volume.
Nomenclature
A—core cross-sectional area, m2;
C—pore size conversion coefficient between T2 and pore radius, μm/ms;
Fn—geometric shape factor, dimensionless;
I—injection capacity index, m3/(d·MPa·m2);
n—power exponent, dimensionless;
Δp—pressure differential between the inlet and outlet in the experiment, MPa;
Q—injection rate, m3/d;
rc—pore radius, μm;
${{S}_{C{{O}_{2}}}}$—CO2 storage efficiency, %;
T2—relaxation time, ms;
Vi—CO2 injection volume, cm3;
Vp—CO2 production volume, cm3;
ρ—surface relaxation rate, μm/s.
Subscript:
S—surface relaxation;
B—volume relaxation;
D—diffusion relaxation.