

Introduction
The exploration and development of unconventional oil and gas resources have surged since 2000, and catalyzed transformative advances in conventional petroleum and natural gas geological theories [1] and rapid shale gas development in the Sichuan Basin. Following the pivotal discovery of Fuling shale gas field in 2012, nine shale gas fields have been found in the Silurian Longmaxi Formation by the end of 2023, and contributed proven reserves of 2.98×10¹² m³ and annual production of approximately 240×108 m³. These discoveries position the Sichuan Basin at the primary stronghold for increasing shale gas reserves and production capacity in China [2].
Large-scale discovery and commercial production of shale gas have focused on the Longmaxi Formation, while fewer achievements were made on the Cambrian Qiongzhusi Formation although it has been explored at the same time, besides low gas flows recorded in Jingyan and Weiyuan in Sichuan, and Yichang in Hubei. This discrepancy underscores substantial differences in the structural, sedimentary and reservoir characteristics between the Qiongzhusi Formation and the Longmaxi Formation [3⇓⇓-6]. Since 2020, inspired by marine shale gas accumulation in the Cretaceous Mancos Formation in the San Juan Basin of the United States and oil and gas accumulation in transport channels in Pembina Oilfield of Canada [7], the conventional understanding that only shale with rich organic matter (such as the Upper Mississippi Barnett Formation in the Fort Worth Basin in the United States and the Longmaxi Formation in the Sichuan Basin) may have large-scale shale gas accumulation was broken, instead the viewpoint that shale with low organic matter in transport channels or interlayers may have gas enrichment was proposed. Since the shale in the Qiongzhusi Formation has no rich organic matter, the basic geology, reservoir and shale gas accumulation were studied, and taking the shallow-water silty shale with low organic matter in the Leshan area as a target, Well JS103 well was drilled and a major breakthrough was made to the Qiongzhusi Formation for the first time [8]. In addition, another two wells, ZY2 and Z201, were drilled into the deepwater organic-rich silty shale in the Ziyang area, and high-yield industrial gas flow was obtained during well test [9]. These strategic breakthroughs were made in different locations, wells, sections and types. Based on shale cores, logging, seismic and production data, and through mineral scanning, organic and inorganic geochemical analysis, breakthrough pressure and triaxial mechanical testing methods, this paper studies the basic geology of the Qiongzhusi Formation, analyzes high-yield conditions, reservoir forming mechanisms and shale gas enrichment law, with the intent to provide guidance for future exploration of the Qiongzhusi Formation and similar formations.
1. Geological setting
The “Ancient China Platform”, a component of the supercontinent, was disintegrated from the Late Neoproterozoic to the Early Cambrian influenced by the Xingkai rifting on the tectonic background of the Rodinia supercontinent breakup [10]. The process facilitated the formation of oceanic basins, including the Qinling-Tianshan ocean, and triggered the formation of a north-south-striking extensional trough in the Mianyang-Changning area [11]. The transitional zone of the Middle-Upper Yangtze block (encompassing Chengkou and western Hubei) inherited the deep-water sedimentary environment of an extensional trough established during the Ediacaran, resulting in a depositional pattern of two troughs surrounding a central platform, in conjunction with the Mianyang-Changning trough [12]. Although there are ongoing debates about the origin, time and sedimentation of the extensional trough, it is widely accepted that this tectonic activity directed the sedimentary (subsiding) and hydrocarbon generating center of the Qiongzhusi Formation [13]. Influenced by a rapid global rise of the sea level, black shale accumulated extensively across the Upper Yangtze region, providing a critical material foundation for shale gas enrichment [14⇓-16].
Within the platform-trough system on the continental shelf setting, notable differences in shale deposition, reservoir quality and shale gas enrichment are observable between the interior and exterior of the Mianyang-Changning trough. The thickness distribution of the Cambrian Maidiping, Qiongzhusi, and Canglangpu formations reveals a distinctive extensional trough that is deep in north and south and shallow in the central part, gentle in west and steep in east. Notably, syn-sedimentary extensional faults caused by rifting are along the eastern side of the trough [17-18]. In the Leshan area on the western slope near the central part of the trough, the Qiongzhusi Formation consists of low-organic silty shale of shallow-water gentle slope subfacies (Fig. 1 ). The average TOC is 0.41%, the thickness is 320-380 m, and the burial depth is 3 200-4 000 m. In the Ziyang area located inside the trough, there deposited organic-rich silty shale of deep-water gentle slope subfacies (Fig. 1 ), with TOC exceeding 1%, thickness of 450-600 m, and burial depth of 4500-5 000 m.
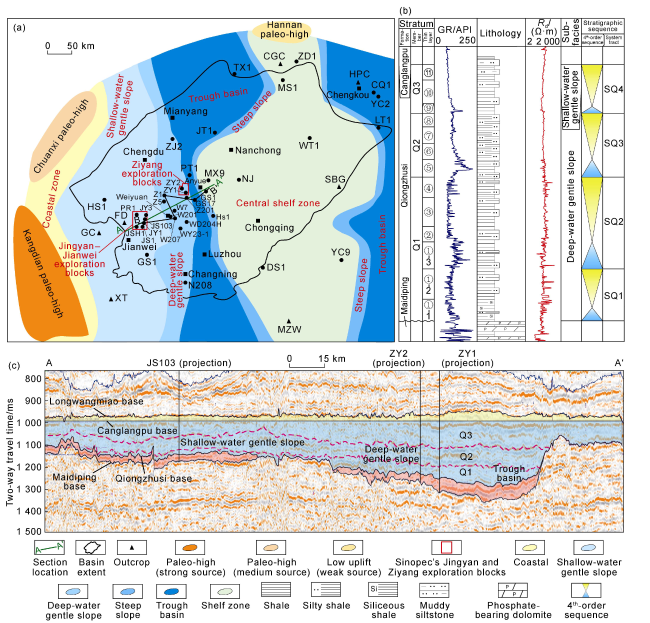
Fig. 1. Comprehensive geological map of the Qiongzhusi Formation in the Sichuan Basin and periphery. (a) Tectonic-sedimentary pattern of the Sichuan Basin and periphery during the Qiongzhusi deposition period; (b) Comprehensive stratigraphic column of the Lower Cambrian Qiongzhusi Formation; (c) Seismic profile flattened at the top of the Canglangpu Formation (GR—gamma ray; Rd—formation resistivity). |
The Lower Cambrian Qiongzhusi Formation comprises four sequence cycles, three members, and 13 thin layers [19] (Fig. 1b ). The complete stratigraphic sequence is observed in the Ziyang area inside the trough, whereas the SQ1 sequence is absent along the trough margin in the Jingyan area. Each cycle begins with black organic-rich shale, and then transitions upward to low-organic silty shale or muddy siltstone. The underlying is phosphate-bearing dolomite of the Maidiping Formation and the overlying is muddy siltstone of the Canglangpu Formation.
2. Geology of Qiongzhusi Formation shale
2.1. Depositional environment
An integrated analysis of petrological, paleontological and logging facies suggests that the depositional environment of the Qiongzhusi Formation in the Sichuan Basin and surrounding areas was a platform-trough system, with two main sedimentary facies: trough and shelf. Both the Jingyan and the Ziyang areas were located within the trough facies, which can be further subdivided into shallow-water gentle slope, deep-water gentle slope, trough basin, and steep slope subfacies. The sedimentary environments of the shallow-water and deep-water gentle slopes closely resemble those of shallow and deep shelves. Following previous microfacies classification of the Qiongzhusi Formation [20], the shallow-water gentle slope subfacies can be further divided into three microfacies: sandy shallow-water gentle slope, sandy-muddy shallow-water gentle slope, and muddy shallow-water gentle slope. The deep-water gentle slope subfacies can be subdivided into two microfacies: sandy-muddy deep-water gentle slope and muddy deep-water gentle slope.
The trough-margin Jingyan area displays three vertical transgressive-regressive depositional sequences of shallow-water gentle slope facies. Stratigraphically, layers ①-3, ⑤ and ⑨ represent transgressive system tract deposits of shallow-water gentle slope subfacies, and layers ②-③, ⑥-⑧, ⑩ and ⑪ are regressive system tract deposits of the shallow-water gentle slope subfacies. In contrast, the Ziyang area within the trough exhibits four transgressive-regressive sequences predominantly of deep-water gentle slope facies. Vertically, ①-1 to the lower part of layer ⑩ are deep-water gentle slope subfacies transitioning to shallow-water gentle slope subfacies from the upper part of layer ⑩ through layer ⑪ (Fig. 1b ). Laterally, the Jingyan area is primarily composed of shallow-water gentle slope subfacies, whereas the Ziyang area is dominated by deep-water gentle slope characterized by stable distribution and considerable thickness of fine sediments. From the trough margin toward the interior, the rock color gradually shifts from gray to black, the grains become finer and finer, and the shale thickness increases progressively.
2.2. Petrology of gentle slope shale
The shale of the Qiongzhusi Formation is mainly silty and clayey silty, with a small amount of calcareous silty shale and siliceous shale. The average content of brittle minerals is 68%. There is little difference in the content of quartz and feldspar in the deep-water shallow slope shale, with quartz content of 37.25% and 39.40%, and feldspar content of 28.75% and 30.20%, respectively (Fig. 2 ). In clay minerals, the content of chlorite in shallow-water gentle slope shale is high, accounting for 73%, followed by illite, accounting for about 25%, and the proportion of illite/smectite (I/S) mixed layers is low, accounting for 2%. In deep-water gentle slope shale, illite is the main component (53% to 58%), followed by chlorite (33% to 36%), and the proportion of illite/smectite mixed layers is low (9% to 11%) (Fig. 2 ). Compared to the Longmaxi Formation, the feldspar content is significantly higher (ranging from 2.6% to 11.8% in the Longmaxi Formation), while the clay mineral content (ranging from 21.0% to 25.6%) is notably lower (ranging from 28.8% to 41.2% in the Longmaxi Formation) (Fig. 2 ). Overall, the mineral composition of the Qiongzhusi Formation is characterized by a high content of felsic minerals, a low content of clay, carbonate and pyrite, and a notably high proportion of chlorite in clay minerals.
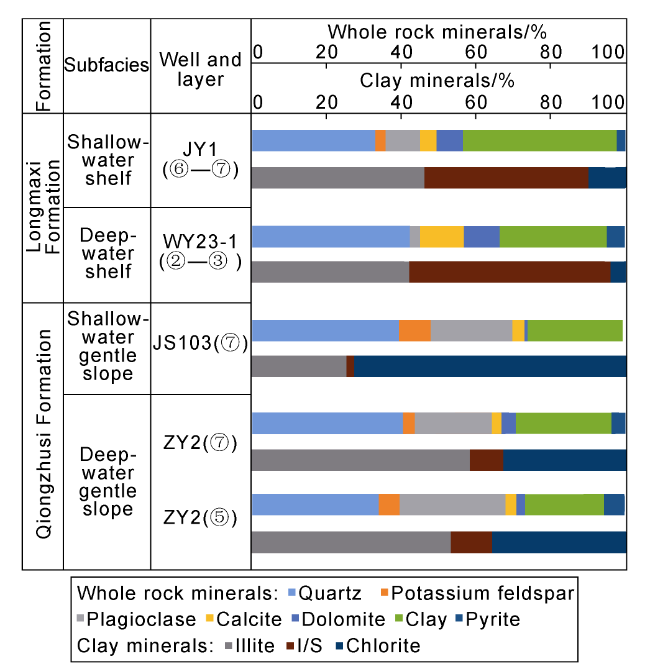
Fig. 2. Comparison of petrological characteristics of shale between the Qiongzhusi Formation and the Longmaxi Formation. |
2.3. Geochemical characteristics of hydrocarbon generation in gentle slope shale
The average TOC of the shallow-water gentle slope shale is 0.41%; the TOC of the deepwater gentle slope shale is greater than 1%, with an average of 1.81%; the TOC of layer ⑤ shale in Well ZY2 is high, with an average of 2.92%; and the TOC of layer ⑦ shale in Well ZY2 is low, with an average of 1.52% (Fig. 3 ). Generally, the TOC of the deep-water and shallow-water gentle slope shale of the Qiongzhusi Formation is lower than that of the shelf shale of the Longmaxi Formation in the stretching trough.
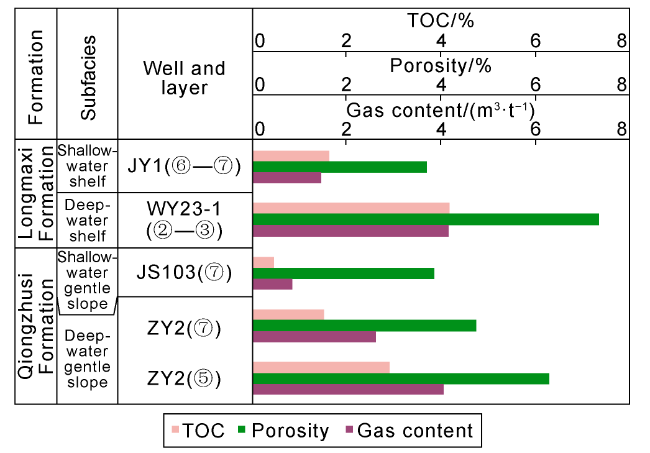
Fig. 3. Comparison of TOC, porosity, and original gas content between the Qiongzhusi Formation and Longmaxi Formation shales. |
The δ13C values of the kerogen in the Qiongzhusi Formation are -37‰ to -31‰, and the organic matter is Type I. The organisms generating hydrocarbon are mainly algae and dubious sources with good parent materials and superior hydrocarbon generating conditions. The organic matter of the Longmaxi Formation is Type I-II1, and the δ13C values of the kerogen are -30‰ to -27‰. The organisms generating hydrocarbon are mainly benthic algae, including graptotes, algae and suspected source species [21]. The organisms of the two formations are different. According to the result of laser Raman spectroscopy, the vitrinite reflectance (Ro) of the Qiongzhusi Formation is 3.30% to 3.49%, and the Ro of the Longmaxi Formation is 3.05% to 3.09%. The thermal maturity of the organic matter in the Qiongzhusi Formation is slightly higher than that in the Longmaxi Formation.
2.4. Reservoirs of gentle slope shale
2.4.1. Physical properties and gas-bearing property
The analysis of helium porosity and pulse permeability shows that the shale of the Qiongzhusi Formation has the characteristics of medium-low porosity and ultra-low permeability. The average porosity of the shallow water gentle slope shale is 3.32%. The porosity of the deepwater gentle slope shale is greater than 4.00%, with an average of 4.90%. The shale porosity of layer ⑤ in Well ZY2 is the highest, with an average of 6.29%, while the shale porosity of layer ⑦ in Well ZY2 is slightly lower, with an average of 4.73% (Fig. 3 ). The permeability of the deep-water and shallow-water gentle slope shale in the Qiongzhusi Formation is relatively low, generally (0.001-0.010)×10−3 μm2.
The gas content of the shallow-water gentle slope shale of the Qiongzhusi Formation is 1.34 m3/t. The gas content of the shallow-water gentle slope shale of the Qiongzhusi Formation is 1.34 m3/t on average. The gas content of the deepwater gentle slope shale is greater than 2 m3/t, with an average of 2.98 m3/t. The gas content of layer ⑤ shale in Well ZY2 is relatively high, with an average of 4.05 m3/t, while that of layer ⑦ in Well ZY2 is slightly lower, with an average of 2.62 m3/t. The gas bearing characteristics are similar to those of the Longmaxi Formation (Fig. 3 ). The gas content of the shale in the deep-water gentle slope of the Qiongzhusi Formation and the deep-water continental shelf of the Longmaxi Formation is equivalent. The low gas content of the shallow-water gentle slope shale is caused by the development of inorganic pores, high proportion of free gas, low TOC, and less adsorbed gas.
2.4.2. Reservoir space
Pore characterization by scanning electron microscopy (SEM) indicates that the shale of the Qiongzhusi Formation, whether in the deep-water gentle slope or the shallow-water gentle slope, has mainly inorganic pores. The inorganic pores are mainly composed of pores between clay and brittle minerals, residual intergranular pores, feldspar dissolution pores, clay mineral intergranular pores, and microcracks (Fig. 4 ), and a few organic pores. Organic pores in the deep-water shale of the Qiongzhusi Formation may be up to 14.63%, while that in the shallow-water shale is less than 5%. In the Longmaxi Formation, the organic pores in the deepwater shelf shale are more. Taking Weirong gas field as a case, the highest percent of organic pores may be 60%, while those in the shallow-water shelf shale account for 10% to 25% [22]. The organic pores in the Qiongzhusi Formation are significantly less than those in the Longmaxi Formation.
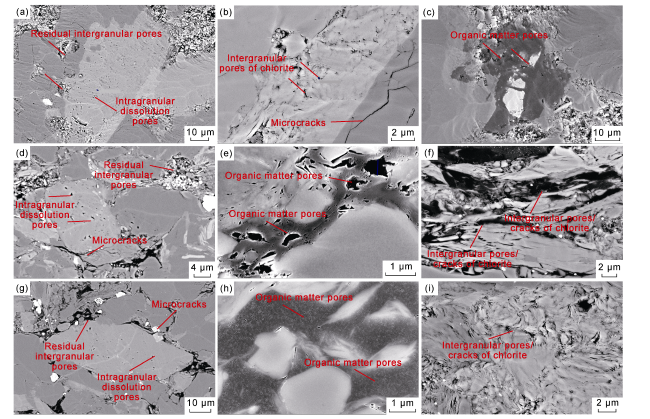
Fig. 4. Reservoir space of Qiongzhusi Formation shale. (a) Residual intergranular pores and potassium feldspar intragranular dissolution pores, layer ⑦, 3 371 m, Well JS103; (b) intergranular pores and microcracks in chlorite aggregate, layer ⑦, 3 371 m, Well JS103; (c) a small amount of organic matter pores, layer ⑦, 3371m, Well JS103; (d) residual intergranular pores, microcracks, and intragranular dissolution pores in potassium feldspar, layer ⑦, 4637.51 m, Well ZY2; (e) well-developed organic pores, layer ⑦, 4 637.51 m, Well ZY2; (f) intergranular pores and fissures in chlorite aggregate, layer ⑦, 4 637.51 m, Well ZY2; (g) residual intergranular pores and microcracks, and intragranular dissolution pores in feldspar, layer ⑤, 4 694.22 m, Well ZY2; (h) organic pores, layer ⑤, 4 694.22 m,Well ZY2; (i) intergranular pores and fissures in sheet-like chlorite aggregates, layer ④, 4 719.23 m, Well ZY2. |
2.4.3. Pore structure
According to high-pressure Hg injection-N2-CO2 adsorption experiments, the pore sizes are significantly different between the deep-water and shallow-water gentle slope shale in the Qiongzhusi Formation (Fig. 5 ). The pore size of the shallow water gentle slope shale reservoir ranges from 9.3 nm to 226.0 nm, of which macropores account for 57.3%, mesopores 39.7%, and micropores 3.0%. The pore size of the deepwater gentle slope shale reservoirs ranges from 1.76 nm to 57.74 nm, of which mesopores are dominant (accounting for 82.3%), followed by micropores (14.1%), and macropores (3.6%). Macropores at the trough margin (57.3%) are more than those inside the trough (3.6%).
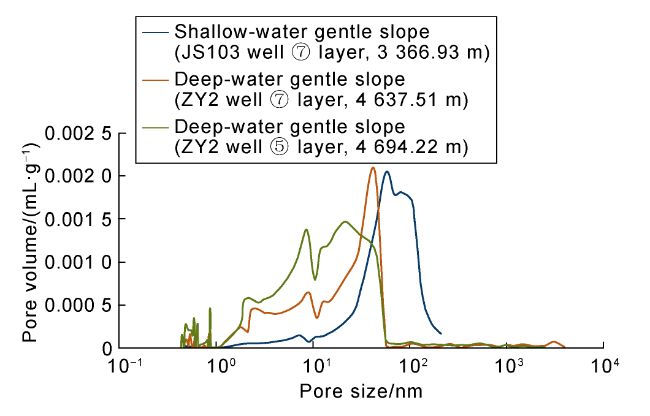
Fig. 5. Typical pore size distribution of shale in deep water and shallow-water gentle slopes. |
The average percent of mesopores in the deep-water continental shelf shale in Weirong Gas Field is 53.7%. The deep-water shales in the Qiongzhusi Formation and the Longmaxi Formation have mainly mesopores, but they are more in the Qiongzhusi Formation.
3. Enrichment and high yield conditions for shale gas in the Qiongzhusi Formation
3.1. The weak extensional tectonic environment established the material conditions for the enrichment of shale gas
Under the background of weak extensional tectonic activities, the Mianyang-Changning extensional trough provided a stable and large accommodation space and multiple source channels, which is conducive to the accumulation of brittle minerals and organic matter. Existing data indicate that the shale of the Qiongzhusi Formation contains comparable amounts of quartz and feldspar in all layers from shallow to deep water, which are totally over 65% on average, and even to 78%. This is favorable for the development of many connected clay and brittle intergranular pores. Furthermore, according to the Si-Al chart, the siliceous materials in the Jingyan area on the trough margin are all terrigenous, while the shale in the Ziyang area within the trough contains not only terrigenous silica but also a small amount of biogenic silica (Fig. 6a ).
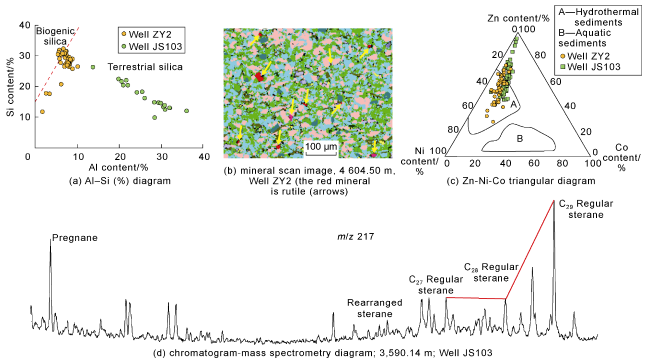
Fig 6. Discrimination diagram of quartz genesis and hydrothermal activities related to the Qiongzhusi Formation. |
The extensional faults in the Precambrian basement created conditions for hydrothermal activities in the study area. First, core observation and mineral scan revealed that the Qiongzhusi Formation commonly contains rutile (Fig. 6b ), indicating the possible presence of hydrothermal activities in the extensional trough. Second, the Zn-Ni-Co ternary diagram shows significant hydrothermal activities in the study area, which were more intense in the Ziyang area (Fig. 6c ), suggesting that the faults in the east may provide good pathways for deep hydrothermal activities. Third, unusually high concentration of C29 sterane was detected in the Jingyan area, which indicates relatively strong hydrothermal activities in the extensional trough (Fig. 6d ). C29 sterane is the primary component after the reduction of sterols in hydrothermal bivalve Bathymodiolus septemdierum [23]. Liang et al. [24] suggested that the enrichment of C29 sterane in the Lower Cambrian is related to the presence of abundant prasinophyte steranes and marine Paleozoic source rocks (possibly genetically related to the planktonic cysts of the genus Gonyaulax). Fourth, the U/Th ratio in the deep-water Ziyang area locally reaches 3.63, which also reflects a hydrothermal environment. Previous studies [25-26] have also proposed the varying intensity of seafloor hydrothermal activities during the Qiongzhusi depositional period in the Sichuan Basin.
Abundant hydrothermal fluid provided rich nutrients for the development of lower marine organisms such as algae, laid a material foundation for Cambrian biological explosion and contributed to the enrichment of organic matter and the increase of productivity [27]. The organic matter in the Qiongzhusi Formation is primarily Type I, and the primary hydrocarbon-producing organisms are uncertain types and planktonic multicellular algae characterized by a lower peak carbon number (C17-20) of n-alkanes and a higher hydrogen-rich component [28]. The organisms are lower than those in the Longmaxi Formation (C21-27). U/Th ratio and biogenic barium content represent redox conditions and ancient productivity [29-30], respectively. The average biogenic barium content in the deep-water gentle slope shale is 1 325.40 μg/g, and the U/Th ratio is greater than 1.25, indicating extremely high ancient productivity and strong reduction. The strongly reducing water environment is conducive to effective preservation and large-scale accumulation of organic matter. In contrast, the ancient productivity at the slope margin is lower, and the average biogenic barium content is 543.00 μg/g. The water was more oxidized, and the average U/Th is only 0.34, indicating that the shallow-water gentle slope shale was affected by the oxidized water, resulting in lower TOC. Compared to the Longmaxi Formation shale (source barium content of 980.73 μg/g, deep-water shelf shale, Well WD204H; source barium content of 361.33 μg/g, shallow-water shelf shale, Well W201) [31], the ancient productivity of the Qiongzhusi Formation shale is higher, indicating that at similar TOC, the Qiongzhusi Formation shale has a better hydrocarbon generation potential.
3.2. Inorganic pores provide the main storage space for shale gas accumulation
The development mechanisms of shale reservoirs in the Qiongzhusi Formation and the Longmaxi Formation are completely different. At the similar thermal evolution, organic pores in the Longmaxi Formation may reach up to 60%, while those in the Qiongzhusi Formation are only 5% to 15%.
The development of shale pores in the Qiongzhusi Formation is mainly controlled by both felsic minerals and TOC. The extensive development of brittle minerals such as quartz and feldspar can enhance their resistance to compaction while retaining more residual intergranular pores, mainly clay-brittle mineral intergranular pores. The porosity of shale reservoirs tends to increase with the percent of intergranular pores (Fig. 7a ). Feldspar has the characteristic of easy dissolution, so a large number of feldspar dissolution pores were observed under scanning electron microscopy. The organic acid complex Al3+ associated with organic matter during hydrocarbon generation can significantly increase the dissolutional rate of feldspar [32]. It is the most important constructive diagenesis in the secondary pore development zone of the Qiongzhusi Formation. With the increase of feldspar content, the porosity of dissolution pores increases with the increase of feldspar (Fig. 7b ). The study also found a good correlation between the porosity of shallow-water and deep-water gentle slope shales and TOC (Fig. 7c ). The correlation between the porosity of deep-water gentle slope shale in the trough and TOC is higher, which is related to higher TOC meaning more organic acid during hydrocarbon generation, consequently more feldspar dissolved. The total porosity also has a good correlation with TOC (Fig. 7d ). Therefore, the development mechanism of high TOC and more inorganic pores in the Qiongzhusi Formation shale is significantly different from that in the Longmaxi Formation.
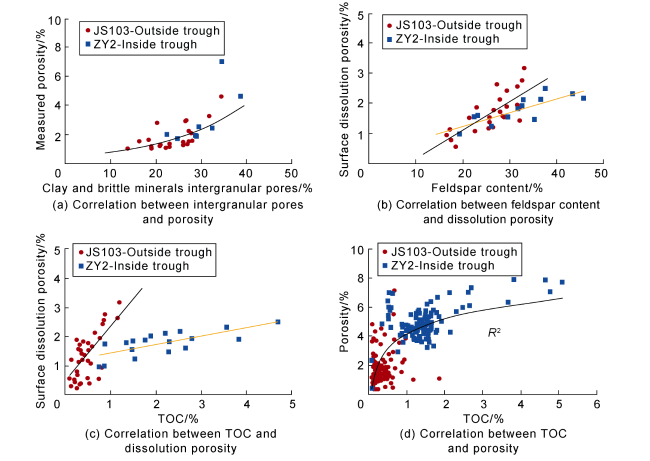
Fig. 7. Relationship among mineral content, TOC and porosity. |
3.3. Multiple isolation systems provide favorable preservation conditions for shale gas
The top and bottom of the Qiongzhusi Formation are tight, thick and at high breakthrough pressure. As good seals, they provide favorable preservation conditions for shale gas accumulation. In the Jingyan well area, a pressure isolation system was found in Well JS103, whose top and bottom correspond to the lower parts of layers ⑨-⑪ and ④-⑥, respectively. They are rich in calcium and strongly cemented. The lithology is very tight, the breakthrough pressure is higher than 40 MPa, and the porosity is lower than 1.7%. Additionally, the calcium-rich and strongly cemented layers ⑨-⑪ weaken the compaction to the pores from the overlying strata, and help maintain the good physical properties and pressure system of the central reservoir section. Layers ⑦-⑧ serve as a pressure isolation section with breakthrough pressure less than 30 MPa and porosity higher than 3% (Fig. 8a ).
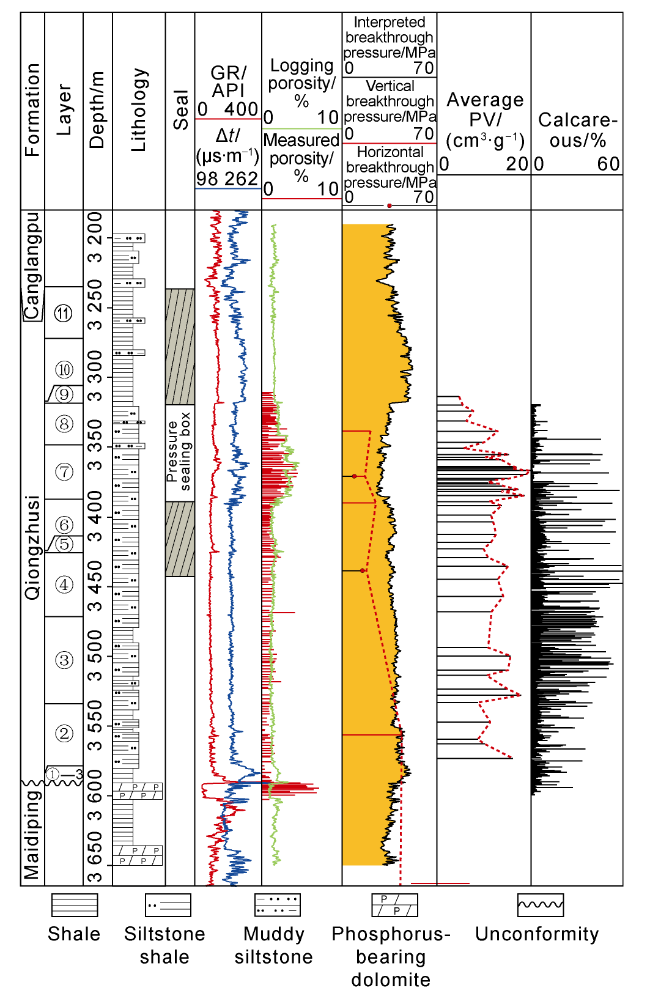
Fig. 8. Abnormal pressure sealing box of the Qiongzhusi Formation in Well JS103 (Δt—acoustic time difference). |
Compared to the Longmaxi Formation (with top breakthrough pressure of 25-33 MPa and bottom breakthrough pressure of 21-42 MPa), the top and bottom of the shale gas section in the Qiongzhusi Formation exhibit higher breakthrough pressure and lower porosity, providing favorable preservation conditions for shale gas accumulation.
3.4. Felsic and quartz brittle minerals facilitate complex fracture networks
The Qiongzhusi Formation exhibits rock mechanics featured by “two highs and one large”: high elastic modulus with an average of 38.4 GPa, high Poisson's ratio with an average of 0.23, and large horizontal stress difference of 13 MPa (Fig. 9a ). Domestic and international studies have shown [33-34] that high elastic modulus, high Poisson's ratio and large stress difference are unfavorable for the formation of complex fracture networks in shale. However, the unique felsic brittle minerals (i.e., composition, bedding and laminae structures) of the Qiongzhusi Formation shale creates favorable conditions for the formation of complex fracture networks.
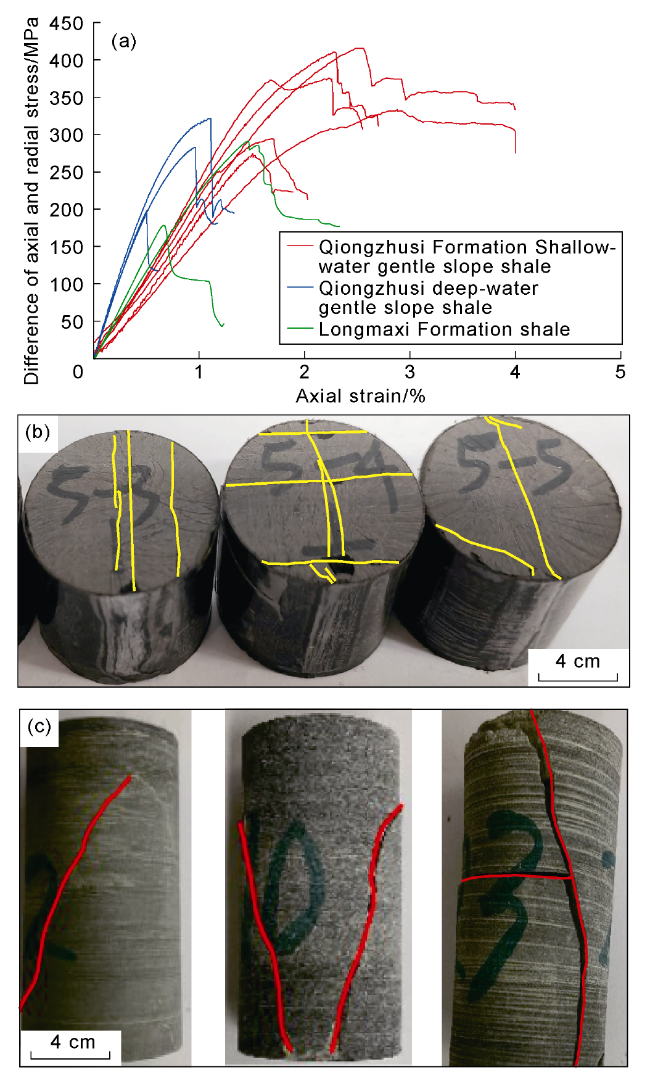
Fig. 9. Stress-strain curves and fracture shapes in plunger samples. (a) Stress-strain curves of shale from Qiongzhusi Formation and Longmaxi Formation; (b) Tensile fracture shapes of shale from Qiongzhusi Formation; (c) Compressive fracture shapes of shale from Qiongzhusi Formation. |
Under scanning electron microscopy, numerous natural micro-fractures at nano-to micro-scale are observable in the Qiongzhusi Formation shale (Fig. 4b, 4d, 4g ). These fractures have opening wider than 50 nm, and their contribution to surface porosity may reach 1%. The micro-fracture networks provide channels for shale gas flow. The development of micro-fractures in the Qiongzhusi Formation shale is mainly based on the following two factors: First, after the deposition of the Qiongzhusi Formation, the Jingyan and the Ziyang areas underwent multiple stages of extensional and compressive tectonic stress modification, laying the foundation for the development of micro-fractures. Second, the shale of the Qiongzhusi Formation has comparable quartz and feldspar content, characterized by uniform mineral particles and mixed dispersion. In particular, feldspar has multiple stress weak planes, and under the action of tectonic stresses in multiple directions over multiple stages, it is more prone to forming heterogeneous stresses and multiple fractures among brittle mineral interfaces and within feldspar minerals, resulting in an extensively developed micro-fracture network system. Compared to the Longmaxi Formation shale in the Weirong Shale Gas Field, the shale of the Qiongzhusi Formation is easier to fracture.
With abundant bedding/laminae, natural fractures are easy to induce in the shale of the Qiongzhusi Formation under high horizontal stress difference, resulting in open and discontinuous surfaces and complex fracture morphologies. Tensile test on the shale of the Qiongzhusi Formation demonstrated that the development of bedding/laminae led to significant reduction in tensile strength (by average 4.0 MPa on bedding/laminae cores and 11.7 MPa on cores without laminae). The fractures in the samples are multiple or in an I-beam shape (Fig. 9b ). Triaxial compression test showed that the shale of the Qiongzhusi Formation was prone to forming complex fracture shapes such as conjugate shear failure and extension along bedding under the influence of bedding/laminae (Fig. 9c ).
4. Formation mechanism and enrichment pattern of shale gas
4.1. Formation mechanism and process
Based on the four factors that influence shale gas accumulation mentioned above, and shale gas genesis, charging stages, asphaltene origin, biomarker and fingerprint, this study clarifies how these factors interact to achieve the accumulation and high yield of shale gas.
4.1.1. Shale gas genesis
The composition analysis of shale gas from the Qiongzhusi Formation indicates (Table 1 ) that natural gas produced from the trough and trough margin is primarily methane. The methane content in the Ziyang area is higher than that in the Jingyan area. Non-hydrocarbon gas is less, the dryness coefficient is high, and the thermal evolution is high. The carbon isotope composition of methane, ethane and propane in the shale gas produced from the trough and trough margin shows δ13C1>δ13C2> δ13C3, indicating that a mixed origin of crude oil cracking gas and kerogen pyrolysis gas.
Table 1. Composition and hydrocarbon isotopic compositions of shale gas in the Qiongzhusi Formation in the trough and at the trough margin |
| Area | Well | Samples | Gas composition content/% | Drying coefficient | δ13C/‰ | δ2H/‰ | ||||||
|---|---|---|---|---|---|---|---|---|---|---|---|---|
| CH4 | C2H6 | C3H8 | CO2 | N2 | CH4 | C2H6 | C3H8 | CH4 | ||||
| Trough margin | JSH1 | 6 | 97.10-97.65 97.49 | 0.47-0.60 0.54 | 0.02 | 0.70-0.95 0.77 | 0.94-1.48 1.12 | 0.993 7-0.995 0 0.994 3 | −36.63-−35.99 −36.42 | −2.94-−42.35 −42.63 | −44.21-−42.30 −43.09 | −142.09-−135.35 −138.94 |
| JS103 | 7 | 96.96-97.47 97.29 | 0.59-0.77 0.67 | 0.03-0.06 0.04 | 0.65-0.81 0.70 | 1.00-1.57 1.21 | 0.991 5-0.993 6 0.992 9 | −37.23-−36.39 −36.83 | −44.39-−43.12 −43.82 | −46.21-−45.53 −45.83 | −144.38-−135.12 −139.44 | |
| JY1 | 9 | 96.38-99.13 97.71 | 0.46-0.61 0.50 | 0.02 | 0.40-2.26 1.12 | 0-0.91 0.62 | 0.993 7-0.995 4 0.994 8 | −37.40-−36.10 −36.79 | −42.90-−41.80 −42.37 | −44.37-−42.60 −43.58 | −142.94-−125.00 −135.47 | |
| JY3 | 1 | 97.52 | 0.64 | 0.03 | 0.61 | 1.15 | 0.993 2 | −37.05 | −43.62 | −45.71 | −140.40 | |
| Trough interior | ZY2 | 16 | 95.20-98.29 97.37 | 0.21-0.39 0.29 | 0-0.01 0 | 0.62-2.11 1.11 | 0.19-3.10 1.23 | 0.996 0-0.997 8 0.997 0 | −34.74-−31.12 −32.64 | −38.21-−36.02 −37.36 | −143.25-−136.27 −138.59 | |
Note: The numerator represents the value range, and the denominator represents the average. |
The carbon isotopic composition analysis of kerogen indicates that the average δ13C1 value of the shale gas produced in the Ziyang area in the trough is −32.6‰, and the average δ13C2 value is −37.4‰, which is not significantly different from the in-situ kerogen carbon isotopic composition (average of −34.0‰). This suggests that the shale gas in the trough is stored in place after generated, similar to the Longmaxi Formation shale gas. In contrast, the average δ13C1 value of the shale gas produced in the Jingyan area at the trough margin is −36.7‰, and the average δ13C2 value is −42.8‰. These values are not only lower than those in the Ziyang area but also lower than the in-situ kerogen carbon isotope (average of −30.9‰). The unusually light δ13C1 in the trough margin indicates that the shale gas has migrated, resulting in an isotope fractionation effect due to diffusion, which makes δ13C1 lighter. This proves that the source of shale gas in the trough margin includes not only autochthonous but also exogenous gas. The δ2H values are higher than −190‰, mainly from −144.38‰ to −125.00‰, indicating typical marine thermal cracking gas.
4.1.2. Fluid inclusions in shale reservoirs
In the Jingyan area of the trough margin, fluid inclusions include liquid hydrocarbon inclusions in oil window, asphalt inclusions, and hydrocarbon-bearing brine inclusions in gas window. Their shapes are mainly triangular, elongated and irregular, and the homogeneous temperature is 100-115 °C, 115-145 °C, and 145-175 °C, respectively. The hydrocarbon-bearing brine inclusions at 145-175 °C have two types of salinity. The inclusions with high salinity represent the tectonic fluid activity during the late Yanshan period, while those with low salinity represent the influence of external low-salinity fluid encountered after the rapid uplift during the Himalayan period. In the Ziyang area in the trough, the inclusions are mainly pure gas inclusions and hydrocarbon-bearing brine inclusions. Their homogenization temperature is 120-135 °C and 135-150 °C, respectively, and they are regular, namely rhombic, elongated and oval.
According to the salinity and burial history revealed by well data (Fig. 10 ), the shale of the Qiongzhusi Formation in the Jingyan area experienced four phases of fluid activity (late Caledonian, middle to late Indosinian, late Yanshan, and early Himalayan). Notably, low-temperature methane inclusions containing asphalt were found in the calcite veins. Since the source rocks in the Jingyan area were not yet mature during the late Caledonian period, the asphalt may be residue of the oil generated and migrating in the trough. The inclusions in the Ziyang area in the trough reveal three phases of fluid activity. With favorable preservation conditions and weak tectonic deformation during the early Himalayan period, no evidence of fluid inclusions was found.
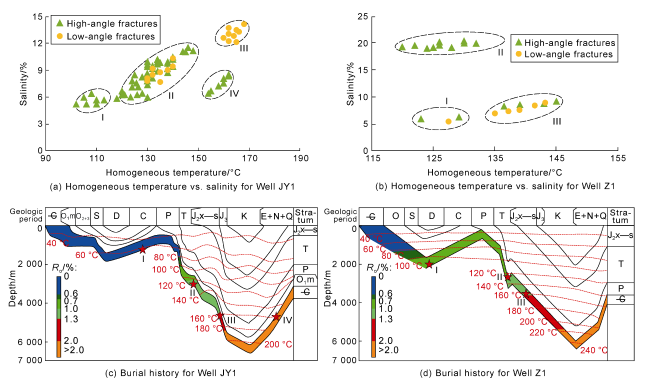
Fig. 10. Homogeneous temperature and salinity of inclusions and burial history for Well JY1 in the Jianyan area and Well Z1 in the Ziyang area. |
4.1.3. Causes of trough margin asphalt and biomarker fingerprints
The Qiongzhusi Formation asphalt in the trough margin can be divided into two categories. (1) Homogeneous asphalt distributed along beddings and with clear boundaries from minerals. Under white light, this kind of asphalt appears black to dark gray, and under fluorescence, it is red-brown or black. Its laser Raman reflectance is slightly lower (2.31%-2.47%). (2) Asphalt fillings in pores and fractures. They exhibit obvious flow structures or include authigenic minerals. Under white light, they are dark gray, gray or bright white, with no fluorescence. They have slightly higher laser Raman reflectance (2.89%-3.45%). The former is mostly in-situ solid asphalt [35], only migrates a short distance, and accounts for about 60%. The latter often fills in reservoir pores and fractures, migrates a longer distance, and accounts for about 40%.
The relative abundance distribution of C27-29 regular steranes (ααα-20R) in reservoir asphalt and source rock has significant source indication and it is generally less affected by thermal effect. It’s an effective indicator for the source of highly evolved shale gas. In the Qiongzhusi Formation in the trough margin in the Jingyan area, the C27-29 regular steranes in the asphalt from fractures and pores exhibit V shape (Fig. 11a ). This shows a certain difference from the biomarker fingerprint (based on chromatographic mass spectrometry) of the in-situ shale organic matter in the area, which is in a L shape, with high dominance of C27 sterane (Fig. 11b ), indicating that the oil and gas in the trough margin in the Jingyan area are originated from different sources. The study suggests that the biomarker fingerprint of the asphalt in the trough margin is similar to the biomarker fingerprint of the in-situ shale organic matter by 60%, indicating that the asphalt is primarily autochthonous.
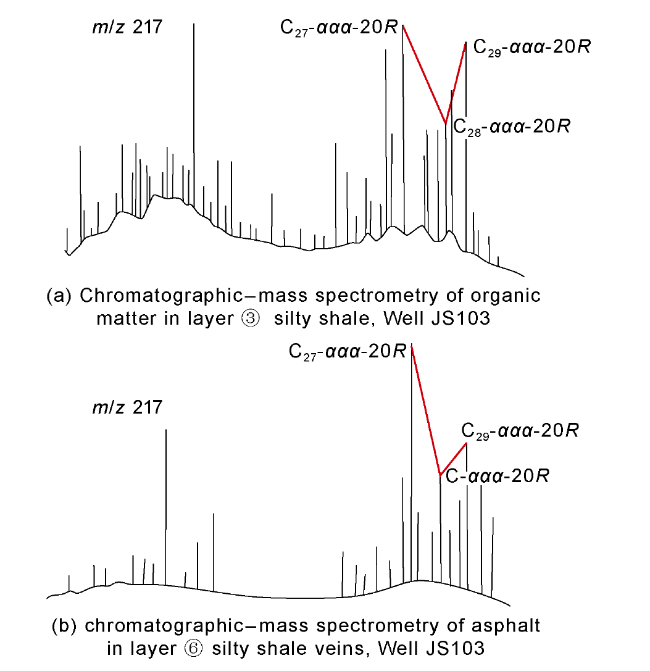
Fig. 11. Chromatographic-mass spectrometry of organic matter and asphalt in the Qiongzhusi Formation shale in the Jingyan area. |
4.2. Shale gas enrichment model
4.2.1. In-situ enrichment model in the trough
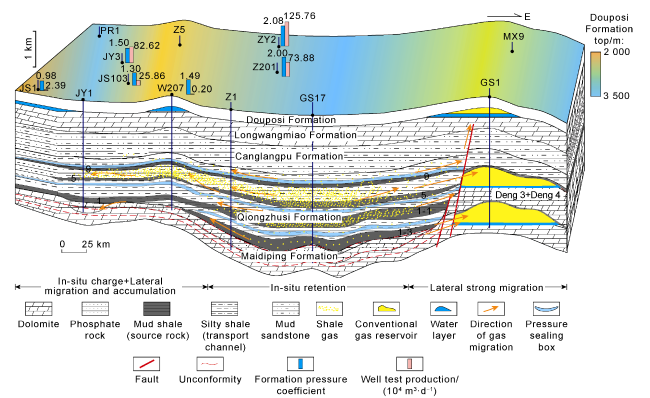
In the Ziyang area within the trough, the Qiongzhusi Formation has developed four sets of thick and continuous deep-water slope shale with TOC greater than 2.0%, laying a solid material foundation for the enrichment and accumulation of shale gas. Abundant intergranular pores, feldspar dissolution pores and microfractures provide space for shale gas accumulation and favorable flow channels. Tight top and bottom, internal isolators and stable structures are excellent preservation conditions, as evidenced by the pressure coefficient of over 2.0 in layer ⑤ in Well ZY2. The generation and accumulation of shale gas went through three stages: (1) Low-maturity oil generated in the trough during the Caledonian Period. Some low-maturity oil migrated under overpressure along shale beddings towards the western margin of the trough (i.e., the Weiyuan-Jingyan area), and left residues as asphalt in fractures, which coexist with low-temperature inclusions. Some migrated through highly dipped and vertical strike-slip faults towards the eastern margin of the trough (i.e., the Gao-Mo area) and accumulated as early low-maturity oil; (2) From the Middle to Late Indosinian, a large amount of shale gas was cracked from crude oil in the trough after reaching medium to high maturity (wet gas), and migrated through open channels towards the structural lows under overpressure; (3) To the Late Yanshan when it was a dry gas stage after reaching high to over maturity, a good pressure sealing box was formed due to further compaction and cementation of the shale reservoir, and the cessation of fault activities in the eastern region. This allowed dry gas to retain in the trough (under overpressure), especially weak modification to the shale gas reservoir during the early Himalayan. Therefore, an in-situ accumulation model of shale gas in the Qiongzhusi Formation within the deep-water environment was established, which is featured by high TOC, high felsic content, high inorganic porosity, and overpressure (Fig. 12 ). High TOC means high hydrocarbon generating ability, high felsic content guarantees high inorganic porosity and high brittleness, high inorganic porosity supports a large volume of free gas, and overpressure provides favorable preservation conditions. They are controlling factors on the enrichment, and high and stable production of shale gas.
Fig. 12. Qiongzhusi Formation shale gas accumulation model. |
4.2.2. In-situ trough margin and transport channel shale gas accumulation
Shallow-water gentle slope silty shale (layers ⑦-⑧) is dominant in the Jingyan area on the trough margin. Although the current residual organic carbon content is low, more than half of the TOC values range from 0.5% to 1.0%, indicating a certain hydrocarbon generation capacity. The pre-oil asphaltenes of low evolution degree represent in-situ hydrocarbon generation, and the hydrocarbon first migrates into the silty shale in layers ⑦-⑧. Layer ⑦ is a high-permeability layer with inorganic pores and micro-fractures which act as the transport system for Qiongzhusi Formation shale gas migrating from the inner trough to the trough margin. This is confirmed by early asphaltenes along beddings and in pores. Later oil -cracking gas also migrates and accumulates in layer ⑦. The silty shales with low porosity and low permeability above and below Layers ⑦-⑧ are effective vertical seals. When favorable lateral seals are available, shale gas can accumulate. The best evidence is that the shale gas in the Jingyan area is composed of oil-cracking gas and highly to over mature kerogen-generating gas. Therefore, a “in-situ + transport channel” accumulation model is established for shallow-water shale gas in the Qiongzhusi Formation, which is characterized by “two highs, one middle, and one low” (i.e., high felsic content, high pressure, medium inorganic porosity and low TOC) (Fig. 12 ).
From the perspective of mineral composition of the surrounding deep-water shelf, there is not much difference between the Qiongzhusi Formation and the Longmaxi Formation. However, in the near-source extensional trough, shale gas accumulation in the Qiongzhusi Formation have three significant differences: first, the feldspar content is higher, and the inorganic porosity and micro-fractures are predominant; second, the hydrocarbon generation potential is greater at the same TOC; and third, in-situ and external shale gas. In addition, shale gas accumulation in the Qiongzhusi Formation shows different TOC between deep and shallow water areas. In the deep-water area, the TOC is higher, the hydrocarbon generation potential is larger, and the organic pores are more (accounting for 14.63%), which increases the shale porosity. In the shallow-water area, the TOC is low, and organic pores are less (accounting for 5%) than inorganic pores, especially in Layer ⑦, forming a favorable pathway for shale gas migrating from inner trough to the margin. In conclusion, shale gas accumulation in the Qiongzhusi Formation follows a model controlled by TOC and inorganic pores under good preservation conditions. TOC controls the hydrocarbon generation capacity, while organic pores connect inorganic pores which provide space for free gas, and whose sizes and quantity determine the degree of shale gas enrichment.
5. Major exploration breakthroughs
Retrospective evaluation on old wells drilled into the Qiongzhusi Formation in the study area found that the low-TOC silty shale section has good oil and gas display and porosity, and the conditions for in-situ and migrating shale gas accumulation are favorable. JS103 that delivered gas production at 25.86×10⁴ m3/d during well test made a commercial breakthrough for the first time. During more than a year of production test, the production performance was featured by “moderate backflow rate, moderate wellbore pressure, high gas production per unit wellhead pressure drop, moderate liquid-gas ratio, and strong and stable production capacity”. The wellbore pressure was 25-40 MPa, gas production was (6-8)×104 m3/d and over 150×104 m3/MPa per unit wellhead pressure drop. It is predicted that stable production will be 3 years. Another evaluation well, JY3 provided shale gas at 82.6×10⁴ m3/d, confirming a good exploration and development potential of low-TOC silty shale.
Re-examination of old wells also showed that why the exploration of organic-rich shale in the past was unsuccessful. It’s believed that the organic-rich shale is shallow but too thin in the Jingyan area, while thick but too deep in the Ziyang area. Although the shale in Ziyang area is close to 5 000 m deep, the quartz and feldspar content is high, and the inorganic pores are developed. Fracturing stimulation can induce an effective fracture network. As a result, ZY2 produced shale gas at 125.7×10⁴ m3/d during well test. The production performance was featured by “low backflow rate, high opening pressure, high gas production per unit wellhead pressure drop, low liquid-gas ratio, and strong and stable production capacity”. During production test, the opening pressure was as high as 73.6 MPa, the daily gas production was (14-15)×104 m3, the pressure drop at the wellhead was 0.04 MPa/d, and the gas production per unit wellhead pressure drop was over 300×104 m3/MPa. It’s expected stable production will last more than 3 years.
The production performance of Qiongzhusi Formation shale gas is significantly better than deep Longmaxi Formation shale gas. The production from the Qiongzhusi Formation in Well ZY2 is 2-5 times the deep Longmaxi Formation, and the predicted recoverable reserves are 1.5-5.0 times the latter. As a new type, Qiongzhusi Formation shale gas will contribute to the increase of shale gas reserve and production after the Longmaxi Formation.
6. Conclusions
The tectonic and sedimentary background and multi-stage stress transformation provide favorable conditions for generation and accumulation of shale gas in ultra-deep formations, and a good foundation for high and stable production of shale gas from the Qiongzhusi Formation.
Controlled by the unique structural and sedimentary pattern of the Mianyang-Changning extensional trough, the Qiongzhusi Formation is mainly silty shale with a high content of felsic minerals. The degree and distribution of TOC are controlled by facies zones. Abundant inorganic pores and residual intergranular pores and felspar dissolution pores determine the degree of shale gas enrichment by their size and quantity. The proportion of organic pores is low, but plays a role in communicating with inorganic pores.
The Qiongzhusi Formation shale is a favorable reservoir. The extensional and hot water environment and algae are favorable conditions for effective hydrocarbon generation. The felsic minerals facilitate the development of inorganic pores and complex fracture networks. Multiple tight and cemented isolators are good preservation conditions.
Shale gas accumulation in the Qiongzhusi Formation follows two models: in-situ accumulation, and in-situ + transport channel accumulation, under the jointing effect of more inorganic pores, high feldspar content, and intralayer migration. Controlled by TOC and inorganic pores, Qiongzhusi Formation shale gas accumulation is different from the Longmaxi Formation from accumulation models to production performance. It is a new type of shale gas.
Thanks to the shift in exploration ideas and advances in engineering technology, significant breakthroughs were made to Qiongzhusi Formation shale gas. Shale gas inside the trough and at the trough margin has broad exploration prospects. It’s the future target for shale gas exploration and development in the Sichuan Basin.