

Introduction
The Sichuan Basin is endowed with abundant shale gas resources in multiple marine organic-rich shale formations of the Cambrian, Ordovician-Silurian, and Permian systems. It was the earliest in China to be commercially explored and developed for shale gas, and has been discovered with multiple large-scale, commercially viable shale gas fields, such as Changning, Fuling, Weiyuan, and Luzhou, especially in mid-deep and deep reservoirs, over the past decade, contributing substantially to national energy security [1]. In recent years, remarkable results have been made in deep (3 500-4 500 m) shale gas exploration and development in the southern Sichuan Basin. By the end of 2024, 1 666 production wells had been deployed, with the cumulative submitted 3P reserves (proved, probable and possible reserves) reaching 2.45×10¹² m3 (including 1.58×10¹² m3 of proven reserves), and the cumulative gas production amounted to 747×108 m3, establishing the largest shale gas production base in China [2-3]. Currently, the main producing interval in the basin is the Ordovician Wufeng Formation to Silurian Longmaxi Formation (hereinafter referred to as Wufeng-Longmaxi) [4-5]. To promote the exploration and development of the Permian marine shale gas, this study analyzes the geological characteristics and key controlling factors for shale gas enrichment and high yield in marine shales of the first member of the Permian Dalong Formation (hereinafter referred to as Da 1 Member), based on the data of drilling, logging, testing, and geological experiments. This study aims to provide technical support for future ultra-deep shale gas exploration in the Permian System.
1. Geological setting and exploration discoveries
1.1. Geological setting
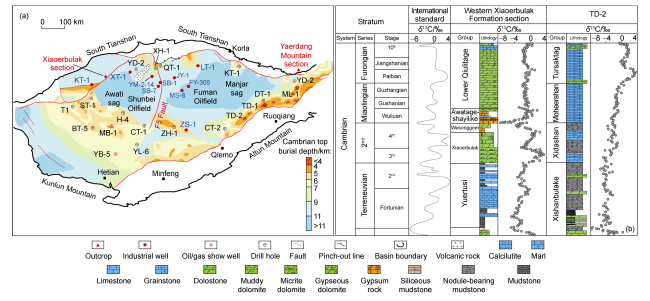
During the Late Permian to Early Triassic, the northern Sichuan Basin was subjected to extensional and tensional stresses due to the Mianlüe Ocean expansion and the Emei taphrogeny, which shaped the depositional architecture of the Permian Maokou Formation-Changxing Formation to different degrees [6]. At the end of Maokou Formation deposition, a platform-sag sedimentary landscape emerged in the northern part of the basin, with a combination of siliceous rocks and siliceous shales developed in the Guangyuan-Bazhong area. During the Wujiaping Formation depositional period, the basin evolved into a paleogeographic framework featuring marine-continental zoning, with higher in southwest and lower in northeast. Intensive uplift occurred in the southwestern basin, while differential subsidence appeared in the northeastern basin, forming the embryonic Kaijiang-Liangping Trough and Chengkou-Exi Trough [7-8] (Fig. 1a ). During the Changxing Formation deposition, differential subsidence intensified, the troughs were basically finalized, and forming secondary platform-sag in the Pengxi-Wusheng area [9]. During the Early-Middle Triassic, the troughs began to shrink, and were eventually filled and leveled by the end of Feixianguan Formation deposition [10]. From the Late Triassic to Cenozoic, intense compression from the Yanshan and Himalayan orogenic movements resulted in the formation of multiple rows of high and steep structures in the basin [11]. During the Himalayan event, the eastern Sichuan Basin was subjected to NW-SE compression and controlled by the Daba Mountain Arc in the north, resulting in strong folding of strata above the Sinian. This created the present-day eastern Sichuan barrier-type structure with asymmetric wings [12].
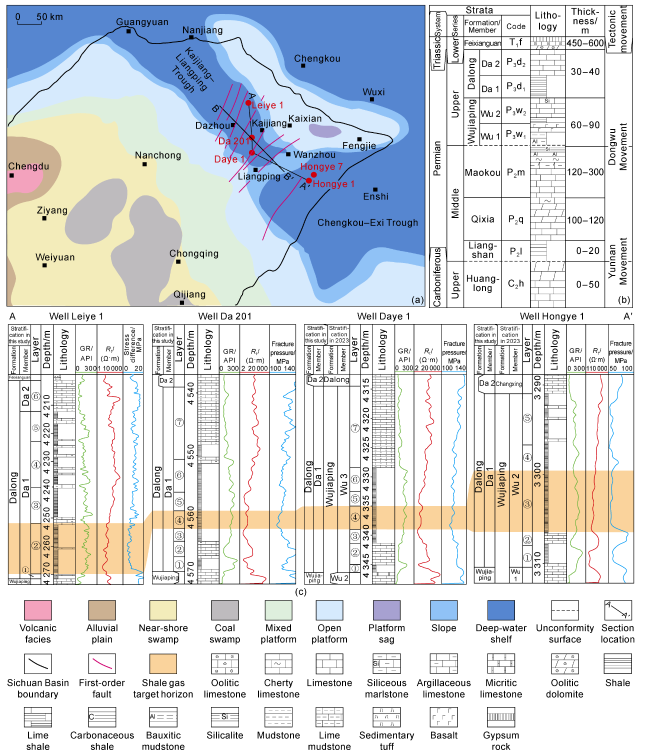
Fig. 1. Distribution of two troughs in the Sichuan Basin and target horizons of shale gas wells in different zones. (a) Sedimentary facies distribution in Dalong Formation of the northern Sichuan Basin; (b) Composite stratigraphic column in the northern Sichuan Basin; (c) Section across Well Leiye 1-Well Da 201-Well Daye 1-Well Hongye 1. GR—natural gamma ray; Rt—resistivity. |
The Permian shale gas play is localized in the northern Sichuan Basin, primarily within the Kaijiang-Liangping Trough. The trough exhibits a U-shaped planar feature, deeper in the west than in the east. Shale gas prospects shallower than 5 000 m are concentrated in the eastern trough, situated within the eastern Sichuan high steep tectonic zone [13]. The study area as a whole presents as a NE-SW-trending structure confined between the Huaying Mountain fault system in the west and the Qiyao Mountain fault system in the east, and bounded by the Daba Mountain fault-fold zone in the north, where intense folding extends for over 100 km, forming multi-crest elongated anticline belts. There are a series of positive structures from west to east, including the Tieshan Structure, Leiyinpu Structure, Qilixia Structure, Datianchi Structure, Nanmenchang Structure, Huangnitang-Yun’anchang Structure, and Dachigan Structure, separated by synclines such as the Dazhu Syncline, Tanmuchang Syncline, Nanya Syncline, Liangping Syncline and Wanxian Syncline (Fig. 2 ). Seismic interpretation reveals a structural pattern of alternating anticlinoriums and synclinoriums within the study area, exhibiting barrier-type longitudinal multi-detachment characteristics. The main faults in the high steep structure are large in scale, with throws of 500-3 000 m. The anticlines are narrow and steep, with asymmetrical wings: the northwestern wing is gentle (formation dip 45°-60°) with multiple NE-trending reverse faults, while the southeastern wing is steep (formation dip 50°-70°), with vertical to overturned strata [14-15]. Wells Daye 1 and Daye 201 are deployed within the Nanya Syncline between the Datianchi and Nanmenchang structures. This syncline, aligning with the structural trend (north-east), serves as the focal area for this study.
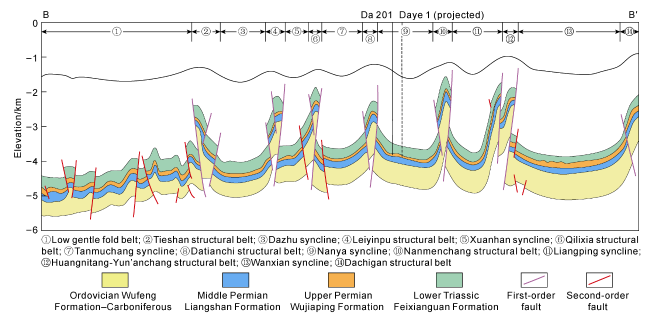
Fig. 2. Geological section derived from the seismic interpretation of Ordovician Wufeng Formation to Lower Triassic Feixianguan Formation in the northern Sichuan Basin (section location shown in |
1.2. Exploration discoveries of shale gas
In 2020, Well Hongye 1HF in southeastern Sichuan Basin achieved a daily gas production of 8.9×10⁴ m3 during testing after horizontal well fracturing in the Permian Wujiaping Formation, marking a significant breakthrough in exploration of marine Permian shale gas within China. In 2021, Well Guan 36 (conventional gas well) was tested after vertical well fracturing in the Permian shale and revealed a daily production of 1.2×10⁴ m3 from the first member of the Dalong Formation (Da 1 Member) at a depth of 4 800 m, indicating a good gas-bearing property in the Permian. Accordingly, the research on the Permian shale was accelerated to identify favorable sedimentary facies. Then, a risk exploration well Daye 1 was deployed in the Kaijiang-Liangping Trough. This well achieved a daily gas production of 32.06×10⁴ m3, confirming the Da 1 Member as the optimal target among multiple sets of shales vertically in the Permian. The Da 1 Member is stably developed in the Kaijiang-Liangping Trough, verifying the resource potential of marine shale gas in the Permian. Following the breakthrough of Well Daye 1, PetroChina Southwest Oil & Gas Field Company initiated comprehensive evaluations of Dalong Formation shale gas. Based on the exploration practices at Well Daye 1, wildcat and appraisal wells were deployed for gas bearing and productivity assessment. Pilot wells were also deployed to test the fracturing and development processes in the Permian shale. In March 2023, Well Leiye 1 in the Puguang area produced 42.7×10⁴ m3/d from the Dalong Formation at the depth deeper than 4 200 m. In December 2023, Well Hongye 7HF deployed by Sinopec Jianghan Oilfield Company in the Hongxing area delivered a high gas flow up to 32.35× 10⁴ m3 m3/d. These mark new milestones in shale gas exploration of the Permian Dalong Formation within the Sichuan Basin. In August 2024, Well Daye 201 (depth of 4 575 m) within the Daye 1 well area recorded a daily production of 56.27×10⁴ m3 in Dalong Formation, proving that, under the background where the eastern Sichuan high steep structure is developed, the wide, gentle syncline area more than 2 km away from the fault has good gas-bearing property and good preservation conditions, and revealing the characteristics of high pressure, high porosity, and high gas content in ultra-deep shale. This discovery suggests the potential for expanding the Permian marine shale gas exploration.
Sinopec evaluated the Permian shales in the Hongxing area of the Chengkou-Exi Trough and the Puguang area of the Kaijiang-Liangping Trough, and then drilled shale gas wells including Hongye 1 and Leiye 1. In Hongxing area, the Wujiaping Formation is divided into two members (Wu 1 and Wu 2), with shale developed in the Wu 2 Member [8]. In the Puguang area, the Wujiaping Formation primarily comprises limestone, while shale exists in the Da 1 Member [16]. The PetroChina Southwest Oil & Gas Field Company previously divided the Wujiaping Formation in Well Daye 1 into three members (Wu 1, Wu 2, and Wu 3), with the Wu 3 Member as the primary producing zone [17], and the Wu 1 and Wu 2 members corresponding to the first member of Wujiaping Formation in the Hongxing area and equivalent to the entire Wujiaping Formation in the Puguang area. According to the paleontological analysis of cores continuously taken from the roof and floor of target shales in Well Da 201, the shales are assigned to the Dalong Formation above the Wujiaping Formation. Comparative analysis of electrical properties, lithology, and geochemical parameters across the wells preliminarily indicates that the high-quality shales in areas where wells Hongye 1, Leiye 1, and Daye 1 are separately deployed belong to the same set of reservoir, exhibiting consistent vertical stimulation targets (Fig. 1b , 1c, Table 1 ).
Table 1. Geological parameters of typical shale gas wells in different zones in the two troughs, northern Sichuan Basin |
| Trough | Well | Shale interval | Shale thickness/ m | Target information | Target shale parameters | |||||
|---|---|---|---|---|---|---|---|---|---|---|
| Target horizon | Target depth/m | Target thickness/m | TOC/ % | Porosity/ % | Gas content/ (m3·t−1) | Gas saturation/% | ||||
| Chengkou-Exi | Hongye 1 | Wu 2 Member | 17.8 | Layer ③ | 3 306 | 6.7 | 8.77 | 6.40 | 4.35 | 77.90 |
| Kaijiang- Liangping | Leiye 1 | Da 1 Member | 33.0 | Layer ② | 4 268 | 12.4 | 7.34 | 3.68 | 6.66 | |
| Daye 1 | Wu 3 Member | 12.9 | Layer ④ | 4 338 | 4.0 | 10.13 | 5.08 | 7.36 | 81.46 | |
| Da 201 | Da 1 Member | 13.1 | Layer ④ | 4 562 | 3.5 | 8.59 | 5.61 | 7.39 | 82.46 | |
2. Geological characteristics of shale
2.1. Layer division and characteristics of the Dalong Formation
The Permian, a critical geological period for the formation of black rocks, contains four major black marine rock systems, including the Middle Permian Qixia Formation coal-organic-rich limestone and Gufeng Formation silicalite, and the Upper Permian Longtan Formation coal and Dalong Formation organic-rich siliceous-argillaceous deposits. Typically, the Dalong Formation black rock series exhibit the highest hydrocarbon generation potential, with high organic carbon content, making it a primary source rock system of the Permian. In recent years, it has become a key target for shale gas exploration in China [18-19]. The Longtan and Wujiaping formations were deposited in the same period but as different facies. Within the Sichuan Basin, the Wujiaping Formation is defined in the northern part, according to the seismic-derived marine-continental boundary. Similarly, the Dalong and Changxing formations were deposited in the same period but as different facies. Currently, the deep- water shelf facies deposits within the Kaijiang-Liangping Trough are assigned to the Dalong Formation. Diachronously, the Da 1 Member black shale corresponds to the late Wujiaping stage, while the Da 2 Member deep-water limestone belongs to the Changxing stage. Based on age determinations from candidate "golden nail" sections in the basin, the boundary between the Wujiaping and Changxing stages is defined by the first appearance of the Clarkina wangi conodont zone [20] (Fig. 3 ).
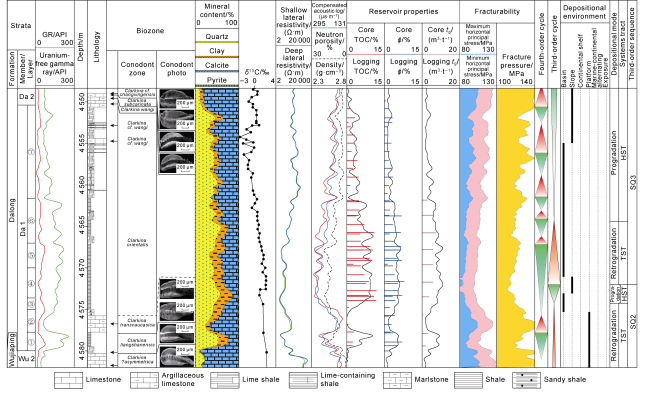
Fig. 3. Composite stratigraphic column of Da 1 Member shale in Well Da 201. ϕ—porosity; tg—total gas content. |
The Da 1 Member in Well Da 201 primarily consists of black shale, dominantly including siliceous shale, carbonaceous shale, and lime shale, locally with limestone and tuff bands. It exhibits well-logging responses characterized by high natural gamma ray, high uranium content, and low thorium content. It is a high-quality shale interval in the Dalong Formation and also the primary target for shale gas exploration and development in the Permian. The Da 2 Member mainly consists of deep-water limestone, presenting as a set of light gray to dark gray, thin to medium, bedded gastropod-spicule-radiolarian wackestone, packstone, and siliceous limestone. Based on lithological assemblages, paleontological features, and logging responses, the Da 1 Member is divided into seven layers from bottom to top (Fig. 3 and Table 2 ). Layer ① contacts gradationally with the Wu 2 Member shallow-water limestone, showing rich bioturbation signs in shale and intact ammonite fossils on core cross-section (Fig. 4a , 4b). Layer ② reflects an abrupt appearance of thin limestone, transitioning upward to calcareous shale with increasing silica content (Fig. 4c , 4d). Layer ③ contacts gradually with the underlying marlstone at the bottom, and it is composed of dark gray lime shale and clayey shale, with foraminifera and ostracod fossils, as well as several tuff bands (10-20 mm wide) associated with pyrite (Fig. 4e , 4f). Layer ④ hosts gray-black carbonaceous shale and siliceous shale, with fossils of radiolarians, ostracods, and spicules, marking the Da 1 Member deposition stage with the deepest waters. Moreover, it has high quartz content and low contents of clay and carbonate minerals, contains pyrite as bands or nodules, and develops five tuff bands and three calcite-filled low-angle fractures (Fig. 4g -4j). Layer ⑤ contains lime-containing siliceous shale and clay-containing siliceous shale, with radiolarian fossils commonly observed, and also five tuff bands (Fig. 4k , 4l). Layer ⑥ is composed of lime shale and clay-containing siliceous shale, with lower quartz content than Layer ⑤, increased carbonate minerals, and presence of shallow-water fossils such as lamellibranch and bivalves, indicating a shallowing depositional environment. It also shows two pyrite bands and one tuff band, with well-developed calcareous nodules (Fig. 4m -4p). Black shale is mainly distributed in layers ①-⑥ and the lower part of Layer ⑦. Calcareous shale occurs in the upper part of Layer ② and the upper part of Layer ⑦, while limestone is developed in the middle and lower parts of Layer ②.
Table 2. Electrical characteristics and reservoir parameters of the Da 1 Member shale in Well Da 201 |
| Layer | Lithology | Layer thickness/ m | Reservoir thickness/ m | Electrical characteristics | Reservoir parameters | |||||
|---|---|---|---|---|---|---|---|---|---|---|
| GR/ API | Average resistivity/(Ω·m−1) | Minimum resistivity/(Ω·m−1) | TOC/ % | Porosity/ % | Gas saturation/% | Gas content/ (m3·t−1) | ||||
| ⑦ | Calcareous shale | 11.1 | 4.9 | 109.7 | 392.7 | 85.4 | 3.9 | 3.09 | 84.5 | 4.3 |
| ⑥ | Lime-containing siliceous shale | 5.4 | 5.3 | 161.2 | 86.6 | 28.3 | 6.4 | 6.74 | 83.7 | 7.0 |
| ⑤ | Mixed siliceous shale | 3.0 | 3.0 | 194.8 | 17.0 | 7.4 | 8.4 | 6.75 | 79.8 | 8.7 |
| ④ | Siliceous shale | 3.5 | 3.5 | 172.0 | 18.6 | 6.6 | 10.1 | 7.57 | 81.9 | 9.4 |
| ③ | Siliceous shale | 1.5 | 1.3 | 161.5 | 9.6 | 5.5 | 5.9 | 5.00 | 70.6 | 7.1 |
| ② | Micritic limestone | 2.8 | ||||||||
| ① | Siliceous shale | 2.2 | 2.1 | 206.4 | 30.9 | 6.0 | 5.8 | 4.90 | 80.7 | 7.8 |
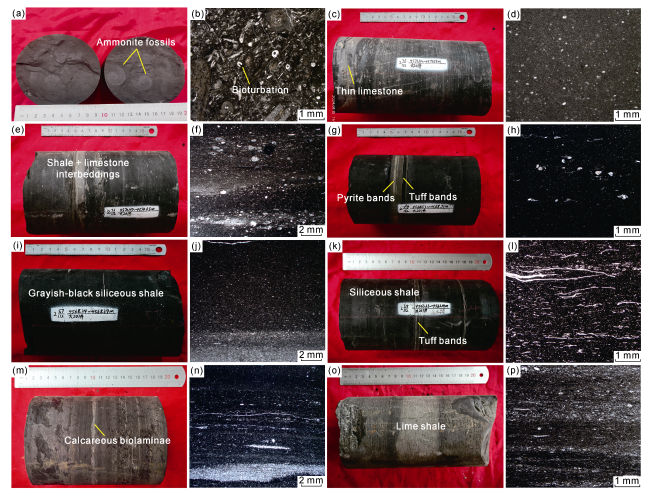
Fig. 4. Core and thin section characteristics of Da 1 Member shale in Well Da 201. (a) Layer ①, Da 1 Member, 4 575.90 m, intact ammonite fossils on core cross-section. (b) Layer ①, Da 1 Member, 4 575.98 m, bioturbated wackestone with brachiopod and echinoid fragments. (c) Layer ②, Da 1 Member, 4 571.10-4 571.19 m, thin limestone developed at the top. (d) Layer ②, Da 1 Member, 4 572.79 m, bioturbated packstone with radiolarian fossils. (e) Layer ③, Da 1 Member, 4 570.47- 4 570.65 m, tuff bands at the bottom, in gradual contact with the underlying marlstone at the top of Layer ②. (f) Layer ③, Da 1 Member, 4 569.42 m, bioturbated carbonaceous-calcareous-siliceous shale with thin-shelled caprinid and radiolarian fossils. (g) Layer ④, Da 1 Member, 4 568.53-4 568.71 m, grayish-black siliceous shale, with tuff and pyrite bands. (h) Layer ④, Da 1 Member, 4 567.83 m, calcareous-carbonaceous shale with shelly fossils. (i) Layer ④, Da 1 Member, 4 668.24-4 568.39 m, grayish-black siliceous shale. (j) Layer ④, Da 1 Member, 4 567.64 m, horizontal laminated carbonaceous shale. (k) Layer ⑤, Da 1 Member, 4 563.23-4 563.41 m, siliceous shale with tuff bands. (l) Layer ⑤, Da 1 Member, 4 565.11 m, siliceous shale. (m) Layer ⑥, Da 1 Member, 4 560.35-4 560.50 m, siliceous shale with calcareous biolaminae. (n) Layer ⑥, Da 1 Member, 4 557.91 m, horizontal laminated carbonaceous shale with caprinid and radiolarian fossils in the lower part. (o) Layer ⑦, Da 1 Member, 4 552.48-4 552.66 m, grayish-black lime shale. (p) Layer ⑦, Da 1 Member, 4 548.50 m, carbonaceous-calcareous- siliceous shale with caprinid-radiolarian in the upper part. |
2.2. Depositional environment of the Dalong Formation
In the late stage of Wujiaping Formation deposition, the Kaijiang-Liangping Trough remained in an extensional rifting state. The Da 1 Member shale is deposited in condensed section, which was formed with insufficient sediment supply and as the trough facies zone rapidly descended to the maximum water depth, and represents the maximum flooding surface of the Upper Permian sequence [21]. A fossil assemblage dominated by ammonites, thin-shelled caprinid, and radiolarians, with minimal calcareous benthic fossils, reflecting deep-water conditions; the presence of horizontal laminations, absence of bioturbation, and high organic carbon content, indicating anoxic depositional environments; enriched productivity proxies, including total organic carbon (TOC) content, Ni, Cu, and Zn concentrations, suggesting elevated marine productivity; and quantitative Mo content (greater than 0.025 mg/g), documenting a persistent sulfidic redox state in the ocean [22]. The trough was morphologically steep in the west and gentle in the east. Within the trough, deep-water shelf facies was dominant, and it evolved under the control of tectonic activity and paleoenvironmental changes [22]. Favorable conditions of low sediment supply, high water level, abundant biomass, and frequent volcanic activity promoted the proliferation of siliceous organism in the surface ocean. Subsequent deep-water sedimentation formed organic-rich black shales in the Dalong Formation [23-24].
2.3. Hydrocarbon generation potential of the Dalong Formation shale
The Da 1 Member shale exhibits high TOC content, ranging from 3.56% to 16.50%. Within the trough boundary, TOC values generally exceed 4.0%, and only a few samples show slightly reduced values (average 9.41%) due to limestone bands. This average TOC is significantly higher than that of the Wufeng-Longmaxi shale. Vertically, layers ④ and ⑤ exhibit the highest TOC values, averaging 10.1% and 8.4%, respectively (Table 2 ). The Da 1 Member shale is dominated by Type II1 kerogens, with humic amorphous matter constituting 76%-81% of the maceral composition, followed by sapropelic amorphous matter and vitrinite (totaling 9%-10%). The δ13C values of kerogen range from −27.3‰ to −26.2‰, further supporting the dominance of humic-sapropelic (Type II1) organic matter based on kerogen isotopic classification [25]. Laser Raman analysis indicates an average thermal maturity (Ro) of 2.94% for the organic matter, suggesting over-maturation. Overall, the Da 1 Member shale demonstrates high organic matter abundance, favorable kerogen type, and strong hydrocarbon generation potential. The organic matter abundance, type, and maturity of the Permian shale collectively determine its hydrocarbon generation capacity, adsorption efficiency, and shale gas reservoir quality.
2.4. Reservoir characteristics of the Dalong Formation shale
2.4.1. Storage space
Shale pores serve as the primary storage space for shale gas, with the storage capacity typically evaluated through parameters such as porosity, permeability, and pore size distribution [26]. Alcohol displacement tests on 21 irregularly shaped samples yielded a porosity range of 3.09%-7.99%, with an average of 5.67%. Vertically, Layer ④ exhibits the highest porosity, averaging 7.57% (Table 2 ). Helium porosimetry on 14 shale samples from Da 1 Member demonstrated a permeability range of (0.069-0.290)×10−3 μm2, with an average of 0.156×10⁻³ μm2. Permeability values are relatively high in layers ④ and ⑤, averaging 0.162×10⁻³ μm2 and 0.176×10⁻³ μm2, respectively.
The Da 1 Member shale exhibits strong vertical heterogeneity. Based on mineral content, three main facies are identified: siliceous shale, mixed shale and calcareous shale [27]. High-precision scanning electron microscopy (SEM) and large-area high-resolution imaging techniques were employed to quantitatively evaluate organic pores, inorganic pores, organic fractures, and inorganic fractures in core samples from different facies, achieving an overall scanning precision of 4 nm. Microscopic characteristics show that both organic and inorganic pores are well-developed in the Da 1 Member shale. The shale minerals are mainly characterized by point contacts and planar contacts, forming a large number of intergranular pores and fracture zones (Fig. 5 ). In Layer ④, dominated by siliceous shale, organic pores are well-developed. Microscopic observations reveal that kerogen is mixed with flaky clay minerals. During thermal maturation, elongated organic pores were formed, while bitumen generated from crude oil cracking fills the intergranular pores and fractures, forming circular organic pores dominated by mesopores and macropores. The pore size of organic pores in siliceous shale mainly ranges from 10 nm to 150 nm. In Layer ⑤, dominated by mixed shale, inorganic pores are well-developed, with pore size mainly ranging from 100 nm to 500 nm. These pores are primarily intragranular dissolution pores, intraparticle pores, and fracture zones around mineral grains. In the mixed shale, pyrite inorganic pores are intermingled with clay minerals and calcite, forming intergranular pores and fracture zones. The dissolution of calcite results in the formation of intragranular pores.
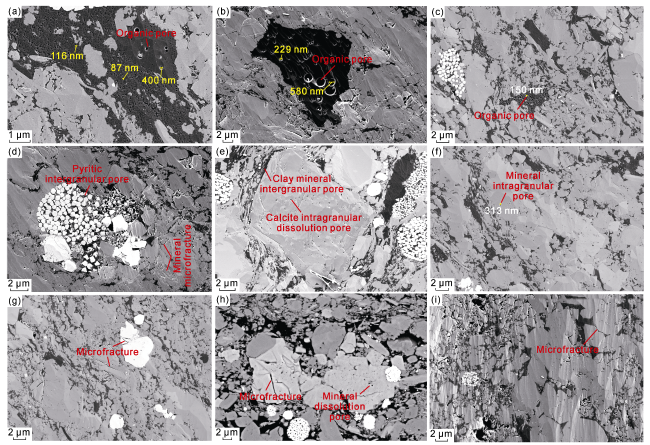
Fig. 5. Thin section images of shale cores from layers in the Da 1 Member in Well Da 201 Well. (a) Layer ④, Da 1 Member, 4 337.65 m, organic pores in shale. (b) Layer ④, Da 1 Member, 4 337.65 m, organic pores in shale (c) Layer ④, Da 1 Member, 4 371.64 m, organic pores in shale. (d) Layer ④, Da 1 Member, 4 335.10 m, pyritic moldic pores and clay mineral intergranular pores. (e) Layer ⑤, Da 1 Member, 4 333.20 m, calcite intragranular dissolution pores. (f) Layer ④, Da 1 Member, 4571.64 m, mineral intragranular pores. (g) Da 1 Member, Layer ④, 4 571.64 m, mineral intergranular fractures. (h) Da 1 Member, Layer ⑤, 4 333.57 m, microgranular calcite and albite dissolution pores and microfractures. (i) Layer ③, Da 1 Member, 4 573.42 m, mineral intergranular fractures. |
2.4.2. Mineral composition
Brittle mineral content determines the alterability and fracturability of shale reservoirs [28]. Mineral X-ray diffraction (XRD) analysis of whole-rock samples from Da 1 Member shale of Well Da 201 indicates that layers ①, ③-⑥ are dominated by siliceous shale, characterized by high siliceous mineral content, low carbonate mineral content, and low clay mineral content. Brittle minerals are primarily siliceous minerals, with contents ranging from 39.3% to 72.1%, averaging 64.6%. Some samples, affected by limestone bands, exhibit elevated carbonate mineral content (8.1%-37.4%, average 19.3%), with minor amounts of feldspar and pyrite. Total brittle mineral content ranges from 27.2% to 92.0%, averaging 80.3%, while average clay mineral content remains below 10%, exhibiting a feature of “high brittleness and low clay”. Triaxial rock mechanics tests measured the elastic modulus and Poisson’s ratio of lime-containing siliceous shale of Da 1 Member from Well Da 201 to be 51.55 GPa and 0.228 under confining pressure of 99 MPa and temperature of 101 °C, demonstrating the characteristics of high elastic modulus and low Poisson’s ratio.
2.4.3. Shale gas content
The Da 1 Member shale within troughs in the eastern Sichuan Basin has burial depths exceeding 3 500 m in synclines, exhibiting an overall good gas-bearing property. Its shale gas content surpasses that of the Wufeng-Longmaxi shale in southern Sichuan Basin. Well Daye 1 recorded the total gas content of 5.36-10.54 m3/t, averaging 7.95 m3/t. Test results yielded a formation pressure coefficient of 2.02. After gas discovery in Well Daye 1, Well Da 201 was drilled primarily to evaluate the impact of the first-order fault in the eastern Sichuan high steep structural belt on shale gas preservation conditions. Located in the Nanya syncline, Well Da 201 is very close to the footwall of the first-order fault (Da ① Fault) on the east wing of the Datianchi Structure. The pilot hole is 3.2 km from the boundary-controlling first-order fault. During Dalong Formation drilling, drilling fluid density of 1.93 g/cm3 was used, gas-logging total hydrocarbon value was 3.96%-14.36%, and four gas logging anomalies were recorded. In core gas content tests, 10 shale samples from Da 1 Member exhibited on-site gas content of 1.05-1.59 m3/t (average 1.32 m3/t) and total gas content of 3.71-11.78 m3/t (average 7.39 m3/t). Well Da 201 has a 2 km horizontal section extending toward the fault, with the terminal 2 km from Da ① Fault. This well was measured with a gas content of 9.1 m3/t, indicating no significant impact from the fault to gas-bearing property.
2.4.4. Shale gas preservation
The roof and floor conditions determine the sealing effect during the early hydrocarbon generation stage of shale burial, and represent a key factor for shale gas accumulation [29]. In the eastern Sichuan Basin, severe erosion of strata in the core of the anticline poses certain risks to shale gas preservation. In certain parts of the syncline zone, latent structures formed by reverse thrusting, such as the Longmenshan latent structure, are well-developed. In other areas, the strata are relatively gentle, and the regional caprock is intact [30]. The roof of the shale reservoir in the Da 1 Member is relatively tight marlstone or limestone in the upper Dalong Formation, while the floor consists of limestone, carbonaceous shale, and bauxitic mudstone in the Wujiaping Formation. Breakthrough pressure test results show that the breakthrough pressure decreases in the following order: bauxitic mudstone, carbonaceous shale, and marlstone. Specifically, the breakthrough pressure of bauxitic mudstone reaches 126.5 MPa, while that of marlstone reaches 119.9 MPa. Both lithologies are tight, with poorly developed pores and fractures, exhibiting excellent sealing capacity. The breakthrough pressure of the thick, tight carbonate layers above and below the target interval reaches 132.3 MPa, demonstrating significant stress isolation. Overall, the roof and floor of the Da 1 Member exhibit strong sealing capacity.
3. Key controlling factors for enrichment and high-yield, resource potential, and development technologies for Permian shale gas
3.1. Key controlling factors for enrichment and high-yield
3.1.1. Stagnant troughs under tensional background as the basis for formation of thin, organic-rich siliceous shale
During the Dalong Formation deposition, the Kaijiang-Liangping Trough in northern Sichuan Basin was characterized by deep-water shelf facies deposition. The deep-water reducing environment facilitated proliferation of siliceous organism, leading to the accumulation of organic-rich black siliceous shale [31]. Therefore, the Da 1 Member shale primarily developed within and around the Kaijiang-Liangping Trough. The water depth in the trough ranged from 200 m to 300 m, with a gradual shallowing trend from northwest to southeast. The broad seafloor in northern Sichuan Basin contracted into a narrow deep-water facies in eastern Sichuan Basin, forming the depositional basis for the Da 1 Member siliceous shale [32-34]. The continuous thickness of Class I shale gas reservoirs of the Da 1 Member in the Kaijiang-Liangping Trough exceeds 10 m and typically ranges from 10 m to 20 m, reaching the lower limit of continuous thickness for high-yield Wufeng-Longmaxi Class I reservoirs. Planar distribution shows that the continuous thickness of Class I shale gas reservoirs of the Da 1 Member increases toward the northwest and decreases toward the slope zone of the trough. The Da 1 Member shale, deposited in deep-water shelf environment, exhibits correlations between TOC/clay mineral content and the indicators of redox conditions, paleoproductivity, paleosalinity and stagnation degree [35]. The Mo-to-U enrichment factor ratio (MoEF/UEF) reflects the degree of water stagnation. As shown in Fig. 6 , for the Da 1 Member shale, TOC and autochthonous organic matter input (AI) are evidently correlated with MoEF/UEF. During this period, the Kaijiangc-Liangping Trough featured deep and closed water, and strong reduction, creating an ideal environment for organic-rich shale deposition.
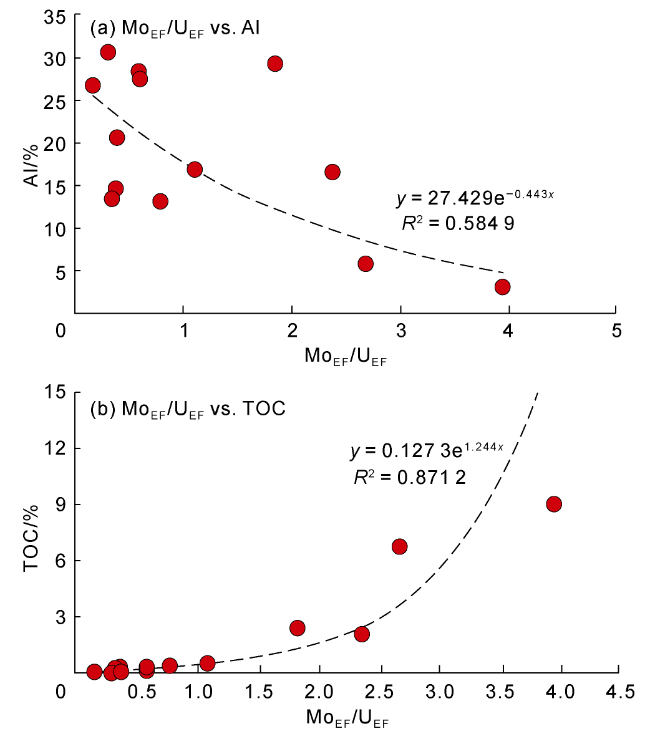
Fig. 6. Redox parameters of the depositional water environment for the Da 1 Member shale. |
3.1.2. Dual-pore development pattern of dominant facies as the key factor for storage space expansion
The organic pores in siliceous shale and inorganic pores in mixed shale collectively constitute the storage space of the Da 1 Member, with superior reservoir properties forming the foundation for the high productivity of Well Da 201. As shown in Fig. 7 , shale facies type is highly correlated with pore development characteristics: siliceous shale is dominated by organic pores, mixed shale by inorganic pores, and calcareous shale exhibits the poorest porosity/permeability. The content of biogenic quartz in the Da 1 Member shale is closely related to the storage capacity of organic pores. Following the accumulation of siliceous organism, biogenic silica formed during early diagenetic Stage A, and the biogenic quartz framework established in the early oil generation stage facilitating the preservation of organic pores. Inorganic pores in the Da 1 Member shale are primarily contributed by carbonate mineral fracture zones and clay mineral intergranular pores. During the rapid compaction phase, both inorganic pores and microfractures decreased significantly. Later-stage mineral fragmentation and dissolution processes re-enhanced inorganic pores and microfractures, forming extensive carbonate mineral fracture zones. In the siliceous shale, organic pores with a pore size range of 10-100 nm are dominant, with an average pore size of 40 nm, while inorganic pores are absent. In the mixed shale, inorganic pores with a pore size range of 100-1 000 nm are primarily developed, with an average pore size of 200 nm, and a small number of organic pores with a pore size range of 40-50 nm are observed. In the calcareous shale, only a small number of inorganic pores are developed. In the Dalong Formation shale, both organic and inorganic pores are well-developed. The interbedding of brittle and plastic mineralspromotes the development of numerous inorganic pores organic pores even in ultra-deep (deeper than 4 500 m) formations, contributing a total porosity over 5% and a permeability of 0.2×10⁻³ μm2, significantly expanding the shale gas storage space.
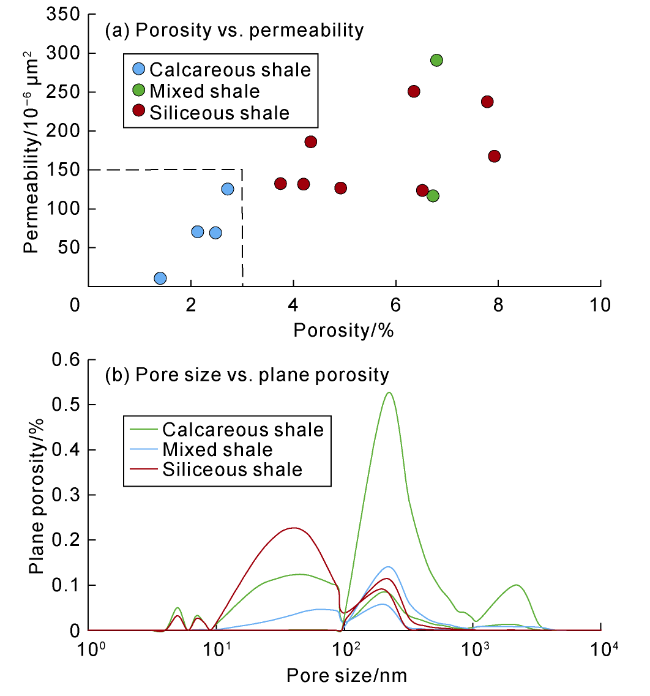
Fig. 7. Porosity, permeability, and pore size vs. plane porosity of lithofacies in the Da 1 Member shale from Well Da 201. |
3.1.3. Inherited uplift in Dazhou-Kaijiang area as favorable condition for large-scale shale gas accumulation
The Kaijiang paleo-uplift, a NE-oriented inherited uplift finalized during the late Middle Triassic Indosinian Movement, exerted significant control over hydrocarbon source rocks, reservoirs, and accumulation in Dazhou- Kaijiang area. The Dongwu Movement induced differential subsidence on the Kaijiang paleo-uplift, governing the sedimentary distribution of the Dalong Formation during the Late Permian [36]. During the Triassic period, the Dalong Formation shale in this area reached its hydrocarbon generation peak. The Kaijiang paleo-uplift positioned the Dazhou-Liangping area at the uplifted highland. Lithological ancient traps were formed on the basis of paleo-uplift during the Indosinian period. In the Middle Jurassic, the source rocks entered their oil-generation peak, controlling the hydrocarbon accumulation [37]. In the Cretaceous, the liquid hydrocarbons in the ancient reservoir were cracked to gas. As the eastern Sichuan Basin gradually developed into a high steep structural belt, the thermally cracked natural gas migrated and accumulated within the structural belt. Therefore, the Dazhou-Kaijiang area covering the Kaijiang paleo-uplift served as a destination for hydrocarbon migration and accumulation during the shale gas generation period. This area exhibits favorable gas storage conditions and represents a high-potential area for shale gas enrichment.
3.1.4. Distance from main faults as deciding factor for gas enrichment in syncline areas
The limestone at roof and floor of the Da 1 Member shale provided effective seals during the early hydrocarbon generation stage, creating favorable conditions for continuous hydrocarbon generation and shale gas preservation [38]. Based on the measured gas contents of cores from Well Daye 1 and Well Da 201, a logging evaluation model was established to assess the gas-bearing capacity of multiple wells in the high steep structural area of eastern Sichuan Basin. Drilling practices have confirmed that shale gas preservation conditions in the Da 1 Member are relatively poor in the syncline zone near major faults. For example, Well YA 23, 1.9 km from a first-order fault, shows a shale gas saturation of only 20% based on logging interpretation. In contrast, the preservation conditions in the syncline zone farther from the main fault are better. Well YA 8, 2.2 km from the first-order fault, shows a shale gas saturation of 65% based on logging interpretation (Fig. 8 ). Drilling results show that the burial depth of the Da 1 Member ranges from 3 500 m to 4 000 m in the hanging wall of the fault and 4 500 m to 5 500 m in the foot wall. A correlation analysis between the gas-bearing capacity of existing wells and the distance from the fault indicates that the shale gas content of the Dalong Formation shale in eastern Sichuan Basin varies greatly. As inferred from the gas-bearing capacity of actual wells, the preservation conditions in the Dalong Formation are not affected when the well in the footwall is located more than 2 km from the first-order fault and the well in the hanging wall is more than 0.25 km from the first-order fault. Structural uplift has not caused any extensive shale gas escape within the broad syncline zone. Therefore, the syncline zones far from the main fault within the high steep structural area of eastern Sichuan Basin, with the Dalong Formation shallower than 5 500 m, are currently the most favorable target areas for commercial shale gas development in the Permian using the available engineering technologies. These syncline zones include the Nanya Syncline, Tanmuchang Syncline and Liangping Syncline.
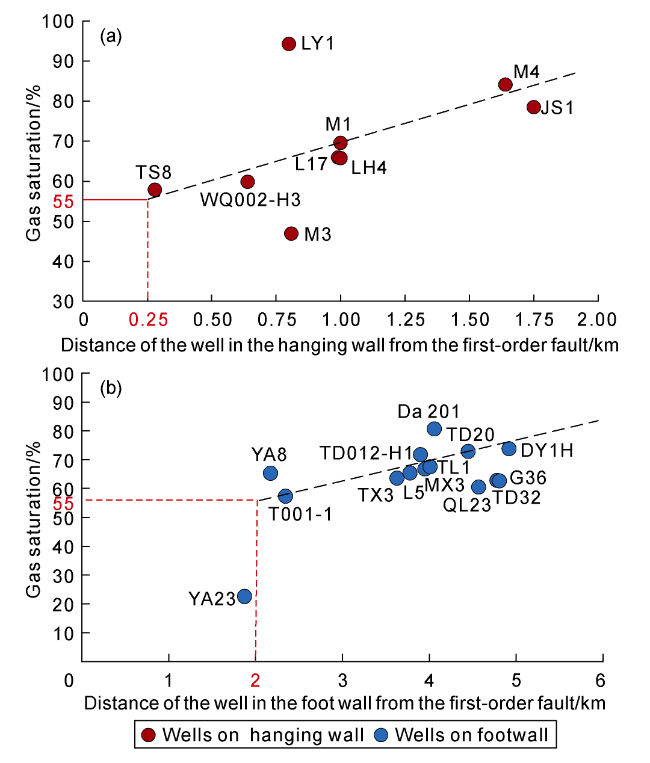
Fig. 8. Relationship between gas saturation and distance from the first-order fault for actual wells. |
3.1.5. Geology-engineering integrated exploration and development as guarantee of high-yield of Permian shale gas
Geological and engineering analysis indicates that the Da 1 Member shale has good reservoir quality and static parameters, which are comparable to those of the Wufeng-Longmaxi shale. The vertical stress is close to the maximum horizontal principal stress, with a weak strike-slip stress regime, posing a low casing deformation risk, and providing favorable conditions for shale gas development. However, the Da 1 Member shale has a relatively small reservoir thickness, with limited vertical recoverable resources. The minimum horizontal principal stress exceeds 100 MPa, making it difficult to form an effective fracture network. Additionally, the reservoir exhibits vertical heterogeneity, with locally high carbonate mineral content, further increasing the difficulty of vertical resource recovery. In response to these characteristics, the concept of horizontal fracturing instead of vertical fracturing was proposed. This approach aims to control the maximum resources by expanding the lateral extension of the fracture network. Based on the mature Version 2.0 fracturing technology for deep shale gas wells in southern Sichuan Basin, an integrated geology-engineering model was established considering the Dalong Formation’s reservoir properties, geomechanics and natural fracture development. Following the fracturing design principle of “one strategy for one stage”, key parameters such as staged perforation, pumping rate, and injection volume were optimized for Well Da 201. A “controlled fracture propagation + complex fracture promotion + strong proppant support” fracturing technique was developed. By adopting “multi-cluster in a stage, and high-intensity” fracturing, with a fracturing stage length of 2 000 m (28 stages in total), an average fluid intensity of 35 m3/m, and a proppant intensity of 3.5 t/m, the estimated ultimate recovery (EUR) reached 1.6×10⁸ m3. Microseismic monitoring results from Well Da 201 show that the average fracture length is 280 m in the east-west direction, with an upper fracture height of 19.2 m and a lower fracture height of 17.8 m. The fracture opening rate is 78.44%, indicating minimal influence from natural fractures and high fracturing effectiveness. A complex fracture network was successfully established in Well Da 201 (Fig. 9 ). The evaluation concludes that the “controlled fracture propagation + complex fracture promotion + strong proppant support” fracturing technique has effectively stimulated the Da 1 Member shale and can be widely applied in the study area.
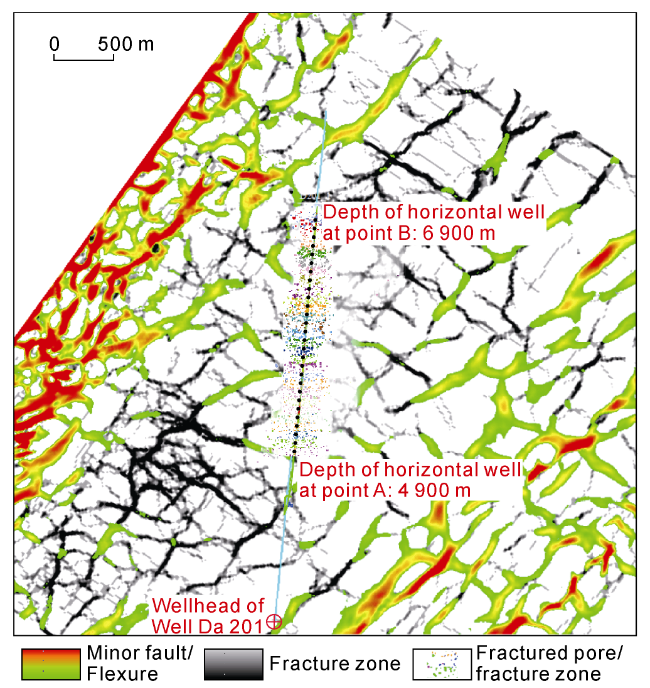
Fig. 9. Microseismic monitoring results in the Well Da 201 area. |
3.2. Exploration potential of Permian shale gas
The distribution of the Permian Dalong Formation shale reservoirs in the Sichuan Basin is controlled by the Kaijiang-Liangping Trough, with a similar planar distribution pattern. Vertically, two sets of shale reservoirs are separated by 20-30 m, exhibiting a three-dimensional exploration potential. Currently, in the southern Sichuan- western Chongqing region, the Wufeng-Longmaxi Class I shale reservoirs mostly have a continuous thickness of 5-7 m, with an average single-well recoverable reserves of 1.4×10⁸ m3 from ten shale gas wells, confirming that thin continuous shale reservoirs also hold commercial development potential [39-40]. In the study area, the Class I shale reservoirs of the Da 1 Member exhibit a continuous thickness of 10-20 m, with superior reservoir quality compared to the Wufeng-Longmaxi shale in southern Sichuan Basin, characterized by higher TOC (average 7.6%), higher porosity (average 6.1%), higher gas content (average 8.3 m3/t), and higher brittle mineral content (average 73.7%). This “thin but rich” shale reservoir demonstrates a solid resource base for large-scale exploration and a promising shale gas development potential. Based on comprehensive geological, engineering, and economic evaluations, the optimal target area for engineering-feasible development (at depths shallower than 5 500 m) is approximately 1 800 km2, with a preliminary estimated shale gas resource volume of 5 400×108 m3 (Fig. 10 ), and currently technically recoverable reserves of 4 500×108 m3 at depths shallower than 5 000 m.
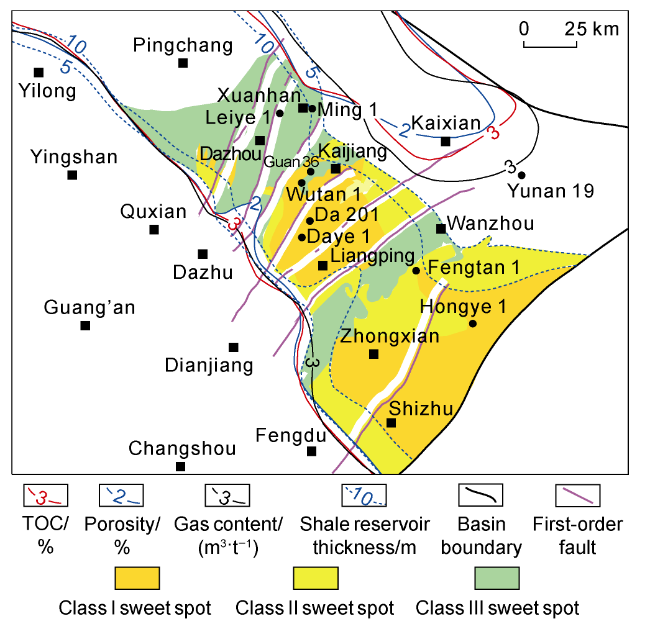
Fig. 10. Distribution of favorable shale gas areas in the Permian Dalong Formation, northern Sichuan Basin. |
3.3. Key technologies for Permian shale gas development
3.3.1. Maximizing the recovery of thin shale reservoirs is crucial to efficient development of Permian shale gas
The Dalong Formation shale in the Sichuan Basin is rich in shale gas resources and holds a great exploration potential, making it a key target for future shale gas exploration and development. However, the challenges of thin and ultra-deep reservoirs pose significant obstacles to efficient development. Therefore, precise geological sweet spot characterization and fracturing technique upgrading are urgently needed [41]. In the study area, the Class I shale reservoirs of the Da 1 Member have a continuous thickness greater than 10 m (Fig. 11 ), with reservoir quality comparable to the Longmaxi Formation shale. In contrast, the cumulative thickness of Class I and II reservoirs is generally less than 30 m, much thinner than the thickness (approximately 50 m) of the Longmaxi Formation shale in southern Sichuan Basin, which is the core development zone [42-44]. As a result, vertical recoverable resources are limited. Key strategies for maximizing the recovery of thin shale reservoirs include: (1) accurate characterization of shale reservoirs using seismic data and other techniques, to find high-pressure, high- gas-content, and high-brittleness geological and engineering sweet spot zones/intervals; (2) high-efficiency platinum-target drilling and advanced reservoir stimulation, to construct an optimal underground connected body; and (3) pilot tests on well spacing, horizontal section length, and well placement pattern, to establish a complex and interconnected fracture network, maximizing the utilization of favorable underground zones.
Fig. 11. Comprehensive reservoir classification and evaluation of the Permian shale in Well Da 201. RXO—flushed zone formation resistivity; Δt—acoustic interval transit time; ϕCNL—neutron porosity; ρ—density. |
3.3.2. Ultra-deep shale stimulation technology is essential for large-scale production of Permian shale gas
In the study area, the Da 1 Member shale buried at depths of 4 500-5 000 m covers 75% of the favorable exploration area. However, in ultra-deep shale reservoirs, the greater burial depth, higher temperature, and higher pressure conditions lead to increased rock plasticity and higher in-situ stress, which significantly increases the difficulty of fracture initiation and fracture propagation. Under these conditions, it is challenging to form an ideal complex fracture network, which is critical for effective shale gas recovery [45-47]. Key strategies for optimizing ultra-deep shale stimulation include: (1) Improving the temporary plugging and diversion techniques, to effectively control fluid loss in natural fracture zones and pre-existing single fractures, for enhancing fracture initiation and extension to the maximum extent; (2) Testing on proppant types, volumes, and ratios, to improve the supporting capacity of the artificial fracture network under high formation pressure and high closure stress conditions; (3) Performing integrated fracturing evaluation for different layers in the deep shale reservoirs, and precisely defining the key fracturing parameters (e.g. cluster spacing, number of clusters, pumping rate, stage length, fluid intensity and proppant intensity) for horizontal sections in each layer; and (4) Developing a precise fracturing strategy by upholding the geology-engineering integrated approach, and utilizing microseismic monitoring + fracture network simulation + index calculation for optimization of field operation, to ensure the effectiveness of reservoir stimulation.
4. Conclusions
In the Kaijiang-Liangping Trough, located in the northern Sichuan Basin, organic-rich black shale of the Permian is well-developed, characterized by high total organic carbon (TOC) content and high siliceous mineral content, providing a solid resource foundation for Permian shale gas reservoirs. Siliceous shale and mixed shale are the optimal lithofacies, which control the development of organic pores and inorganic pores, respectively. The interbedding of brittle and plastic minerals, combined with the dual-pore synergistic evolution mechanism and compaction-induced fracture expansion, allows the ultra-deep (deeper than 4 500 m) shale to maintain high porosity, significantly expanding the shale gas exploration potential. The favorable storage zone (depth less than 5 500 m) is mainly distributed in the high steep structural belt of eastern Sichuan Basin, where shale gas content is primarily influenced by the sealing capacity of the roof and floor and the fault-sealing effectiveness. Preliminary resource assessment estimates that the recoverable shale gas resources in the Dalong Formation (depth less than 5 000 m) reach 4 500×108 m3, making it a reliable replacement for shale gas reserve expansion and production enhancement in the Sichuan Basin.
By integrating sedimentary environment, reservoir conditions, preservation conditions, and engineering parameters, geological-engineering sweet spot zones for shale gas exploration are identified. The strategy focuses on ultra-deep long horizontal wells, ultra-long special horizontal oil wells, and “multi-cluster, multi-perforation, and stepped pumping rate" fracturing techniques to achieve effective stimulation of the thin Permian shale reservoirs, ensuring high shale gas production. The subsequent efforts will focus on continuously optimizing the casing program of ultra-deep shale gas wells, and especially developing the processes for maximizing the recovery of thin reservoirs, and reducing stimulation cost for ultra-deep shale gas reservoirs. These measures are essential for realizing large-scale, efficient development of Permian shale gas resources in the basin.