

Introduction
Marginal sags refer to sags located at the basin margin or the edge of sedimentary bodies during basin evolution. These sags are typically characterized by small depositional areas, shallow burial depths, and abundant coarse clastic deposits near source areas, making it difficult to form large-scale excellent source rocks [1]. Compared to large hydrocarbon-rich sags in basin centers or main parts, the marginal sags have long been underestimated for their exploration prospects. However, with intensified exploration efforts and deepening geological understanding in recent years, offshore marginal sags have gained increasing attention. Current research on offshore marginal sags mainly focuses on structural evolution analysis and hydrocarbon migration-accumulation conditions in the Bohai Sea area, while studies on source rocks in marginal sags are relatively limited [2]. Given the differences in provenance systems and depositional environments between marginal sags and hydrocarbon-rich sags, the organic matter enrichment mechanisms in marginal sags may differ significantly, and the organic matter enrichment mechanisms and source rock development models in such sags have rarely been reported.
The Pearl River Mouth Basin has developed numerous Cenozoic marginal sags. Typically, the Shunde Sag, located in the southwestern part of the Zhu-II Depression within the deep-water area of the basin, covers approximately 3 800 km2 and represents a newly explored sag in recent years [3]. According to previous studies, the Shunde Sag exhibits complex structural patterns and sedimentary assemblages, with strong stratigraphic heterogeneity, dominance of sandy deposits, and limited development of Wenchang Formation source rocks [4]. However, the discovery of thick lacustrine oil shale deposits in the Wenchang Formation by Well W1 in the Northern Shunde Subsag, along with commercially viable heavy oil in the Enping Formation sourced from Wenchang Formation source rocks, marked a significant breakthrough in oil exploration [4]. This breakthrough confirmed that marginal sags possess favorable conditions for developing excellent source rocks and considerable exploration potential. Nevertheless, unlike the proven source rocks in basin centers' hydrocarbon-rich sags, the Wenchang Formation source rocks revealed by Well W1 exhibit strong vertical variability and heterogeneity. The genetic mechanisms and development models of these source rocks remain unclear, significantly constraining detailed studies on the spatial distribution patterns and resource potential of the main source rocks in the Shunde Sag.
Based on petrological analysis and tectonic-sedimentary studies, together with inorganic-organic geochemical approaches, this paper reconstructs the paleo-lacustrine environment and paleoclimate during the deposition period of the second member of the Eocene Wenchang Formation (Wen 2 Member) in the Shunde Sag. It clarifies the genetic types of different source rocks and their organic matter enrichment patterns, and establishes the differential development models of source rocks in marginal sags. These precise evaluation of the distribution model and resource potential of source rock in the Northern Shunde Subsag is expected to have important implication for the optimal selection of petroleum exploration direction in the Southern Shunde Subsag, Wenchang D Sag, and other similar marginal sags.
1. Geological setting
The Pearl River Mouth Basin is a large Cenozoic sedimentary basin developed on pre-Paleogene granite and folded basement, situated at a unique tectonic position influenced by interactions among the Eurasian Plate, Indo-Australian Plate, and Pacific-Philippine Plate [5]. The basin spans in NE-SW direction as a whole. From north to south, it is divided into five first-order tectonic units: the Northern Fault Terrace Belt, Northern Depression Belt (Zhu-III Depression, Zhu-I Depression), Central Uplift Belt (Shenhu Uplift, Panyu Low Uplift, Dongsha Uplift), Southern Depression Belt (Zhu-II Depression, Zhu-IV Depression), and Southern Uplift Belt [6] (Fig. 1a ).
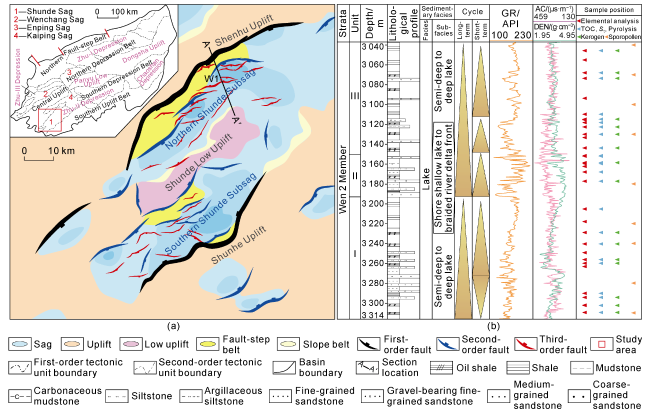
Fig. 1. Regional location and structural outline of Shunde sag in Pearl River Mouth Basin (a), comprehensive histogram of the second member of Wenchang Formation (b) (St—total sulfur content). |
The Shunde Sag, located in the southwestern part of the Zhu-II Depression, lies within the shelf-slope transition belt of the Pearl River Mouth Basin. It is adjacent to the Kaiping Sag to the east, neighbors the Shenhu Uplift to the north, and borders the Changchang Sag of the Qiongdongnan Basin to the southwest. This Sag has undergone multiple tectonic events during the Cenozoic, including the Zhuqiong Movement I and II phases, the South China Sea Movement, and the Dongsha Movement, forming a dual-layer basin structure with “lower faulting and upper sagging” [5,7]. Its tectonic evolution can be divided into: the Eocene rifting stage (Wenchang Formation), Oligocene fault-depression transition stage (Enping Formation and Zhuhai Formation), and Miocene to present depression stage (Zhujiang Formation to Quaternary). During the early Eocene, the subduction direction of the Pacific Plate shifted, triggering the development of large-scale NE-trending faults in the northern South China Sea margin. Under a NW-SE regional extensional stress field, the Shunde Sag was rifted, with large-scale NE-trending boundary-controlling faults developing along its northern and southern margins. The sag is separated into northern and southern subsags by the Shunde Low Uplift in the center, forming a double-fault composite half-graben structure. The Northern Shunde Subsag exhibits a half-graben with fault in the north and overlap in the south, while the Southern Shunde Subsag displays as a half-graben with fault in the south and overlap in the north.
The sedimentation period of the Wen 3 Member in the Early Eocene of the Northern Shunde Subsag was the initial faulting stage, with strong faulting activity, forming a composite half-graben structural pattern. The sedimentary center was limited to local low-lying areas, mainly consisting of shore shallow lake sediments. The development of fan deltas of varying scales in the northern and southern source areas laid the foundation for early sedimentary prototypes. In the Middle Eocene, a strong rifting period, the faulting activity intensified, and the subsidence rate exceeded the sedimentation rate of the lake basin. The ancient water depth rapidly increased, creating an uncompensated environment and developing the main source rocks of the Wen 2 Member (Fig. 1b ). In the Late Eocene, affected by the Huizhou Movement, tectonic activity shifted from strong to weak, and the sedimentary center of the Wen 1 Member (T80-T81) migrated. The uplift and erosion of the sag led to the expansion of the lake basin and the shallowing of the water body. Controlled by the scale of the source area and the direction of the fault, the fan delta sedimentary system developed extensively, showing the characteristics of abundant sandstone across the basin. Well W1 in the eastern part of the Northern Shunde Subsag penetrated the Paleogene granite basement, and fully revealed the Wenchang Formation (Fig. 2 ) [8].
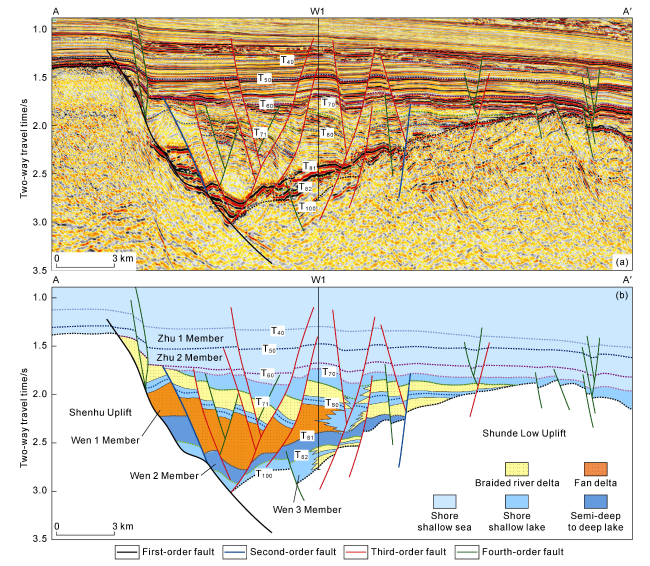
Fig. 2. Typical well-tie seismic section (a) and sequence stratigraphic interpretation section (b) of the Northern Shunde Subsag in the Pearl River Mouth Basin (section location shown in |
2. Sample collection and test analysis
All samples were obtained from the Wen 2 Member of Well W1 in the Northern Shunde Subsag. To minimize experimental errors, sidewall core samples were used for all analyses except for palynological studies. Sample locations are shown in Fig 1b . Organic carbon content analysis and rock pyrolysis were performed on 26 sidewall core samples. Total organic carbon (TOC) testing instrument is LECO CS230 carbon/sulfur analyzer. Rock pyrolysis instrument is ROCK-EVAL 6 pyrolyzer. 18 wall core samples were tested for kerogen elemental analysis, and testing instrument is Vario Isotope Cube elemental analyzer. Biomarker compound analysis was conducted on 17 sidewall core samples, and testing instrument is Agilent 5977B GC/MSD chromatography-mass spectrometer.
Elemental content analysis of sedimentary rocks was conducted on 35 sidewall core samples, using an iCAP7400 spectrometer and a X2ICP-MS mass spectrometer.
Palynological concentration and quantitative identification testing instrument is Leica DM4000B, which was completed by the CNOOC Experimental Center (Zhanjiang) affiliated with CNOOC EnerTech-Drilling & Production Co.
3. Source rock and stratigraphic unit division
Well W 1 in the Shunde Sag has revealed that the thickness of the Wen 2 Member (T81-T82) is 274 m, mainly composed of grayish brown to brownish gray oil shale and shale, with a thickness of 271 m. The sample analysis indicated a TOC content of 1.2%-8.9%, with an average of 4.9%. The Rock-Eval pyrolysis generated free hydrocarbons content (S1) of 0.1-23.4 mg/g (avg. 3.1 mg/g) and pyrolysed hydrocarbons content (S2) of 0.7-61.0 mg/g (avg. 23.1 mg/g). The maximum pyrolysis temperature (Tmax) is 435-445 °C, with an average of 440 °C. The hydrogen index (HI) is 216.9-695.6 mg/g, with an average of 436.5 mg/g. Overall, the Wen 2 Member shale is a mature source rock rich in organic matter, which is the major source rock in the Shunde Sag.
The drilling, well logging, seismic, geochemistry, and other data from the Wen 2 Member suggest differences within the interval. The lower part is mainly composed of grayish brown oil shale, falling in the semi-deep to deep lake subfacies. The middle part is dominated by gray mudstone interbedded with thin siltstone, being shore shallow lake to braided river delta front subfacies. The upper part mainly contains brownish gray shale and grayish brown oil shale, belonging to the semi-deep to deep lake subfacies. The upper and lower parts exhibit typical high GR, low density, and high AC values on logging curves (Fig. 1b ), and show low-frequency, continuous, and strong amplitude responses on seismic section (Fig. 2 ). Accordingly, combined with the high-precision geochemical analysis results, the source rocks in the Wen 2 Member are divided into three stratigraphic units (I, II, and III) for detailed analysis.
Unit I, the lower part of the Wen 2 Member (oil shale), has a TOC value of 2.9%-8.9% (avg. 5.9%) and a HI value of 463.0-632.5 mg/g (avg. 555.0 mg/g). Unit II, the middle part of the Wen 2 Member (mudstone, and shale), has a TOC value of 1.2%-4.1% (avg. 2.2%), and a HI value of 246.2-428.0 mg/g (avg. 342.7 mg/g). Unit III, the upper part of the Wen 2 Member (oil shale), has a TOC value of 3.2%-8.3% (avg. 4.9%), and a HI value of 216.9-695.6 mg/g (avg. 427.8 mg/g). The crossplot of TOC and (S1+S2) (Fig. 3a ) shows that the Wen 2 Member hosts good to excellent source rocks as a whole, with Units I and III being good to excellent, and Unit II being moderate to good, ranking as Unit I, Unit III, and Unit II in a descending order of TOC (Fig. 3b ). The results of pyrolysis analysis (Fig. 3c ) and elemental analysis of kerogen (Fig. 3d ) show that kerogens are mainly type I-II1 in Unit I, type II1-II2 in Unit II, and type II1 in Unit III. The results of source rock evaluation indicate that Unit I host the best hydrocarbon source rock in the Wen 2 Member.
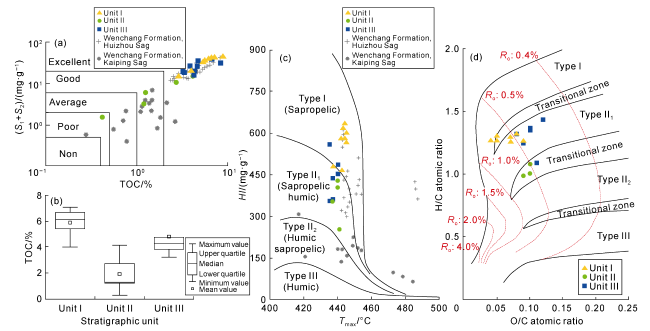
Fig. 3. Geochemical characteristics analysis of source rocks in the Wen 2 Member. (a) TOC-(S1+S2) crossplot; (b) TOC classification; (c) Tmax-HI cross-plot; (d) Kerogen elemental analysis. |
The oil shale in the Northern Shunde Subsag is well correlated with the source rocks of semi-deep to deep lake subfacies in the Wenchang Formation in the Huizhou Sag of the Zhu-I Depression [9]. They have similar source rock quality and organic matter types. Compared to the neighboring Kaiping Sag where significant oil and gas discoveries have been obtained, the oil shale in the Northern Shunde Subsag is much superior in quality and organic matter types, suggesting a good exploration prospect in the subsag [10]. The comparative results indicate that the Shunde Sag located in the marginal zone of the basin can form excellent source rocks, which however have poor homogeneity, varying quality and diverse types compared to the central hydrocarbon-rich sag.
4. Paleoclimate and paleoenvironmental reconstruction
4.1. Paleoclimate reconstruction
4.1.1. Sporopollen characteristics
Organisms, especially plants, are highly sensitive to climate change. Analyzing spore pollen fossils in sedimentary strata can infer changes in paleovegetation, paleoenvironments, and paleoclimatic evolution [11]. During the depositional period of the Wen 2 Member, abundant palynomorph fossils were preserved in thick oil shale beds. A total of 880 palynomorph grains from three major groups (Pteridophytes, Gymnosperms, and Angiosperms) were identified in 9 cutting samples from the Wen 2 Member of Well W1. Angiosperms dominate absolutely, as 44.3%-94.1%, while Pteridophytes and Gymnosperms show relatively lower abundances, ranging from 1.3% to 51.9% and 3.8% to 12.8%, respectively (Fig. 4 ).
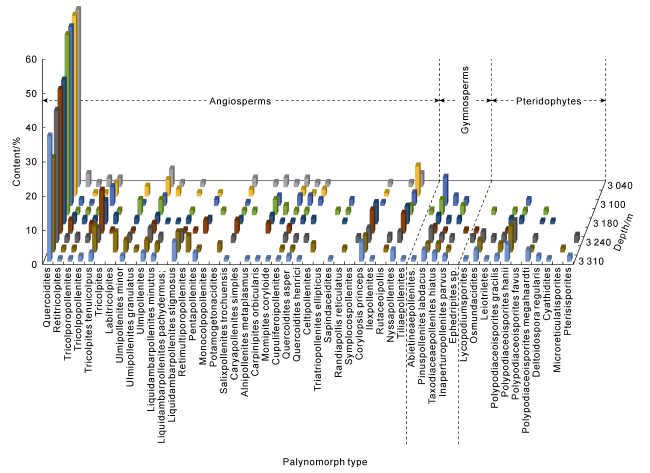
Fig. 4. Palynomorph types and contents in the Wen 2 Member (color corresponds to depth). |
The identified Palynomorph assemblages are characterized as follows:
(1) Angiosperm pollen is overwhelmingly dominated by evergreen Quercus pollen (including Quercoidites and Q. henrici), with common occurrences of Tricolpites tenuicolpus, Nyssapollenites, Ulmipollenites (including Ulmipollenites, U. minor, U. granulatus), Corylopsis princeps, and Liquidambarpollenites (including Liquidambarpollenites minutus, L. stigmosus, and L. pachydermus), while Retitricolpites, Cupuliferoidaepollenites, Pentapollenites, Tricolpopollenites, Carpinipites orbicularis, and Salixipollenites trochuensis are sporadically present.
(2) Gymnosperm pollen is dominated by Pinuspollenites labdacus, followed by Taxodiaceaepollenites hiatus, with common occurrences of Inaperturopollenites parvus, and rare appearances of Abietineaepollenites and Ephedripites.
(3) Pteridophyte spores are primarily represented by Polypodiaceoisporites (including Polypodiaceoisporites hanii, P. gracilis, and P. megahaardti), with common occurrences of Osmundacidites, and sporadic presence of Deltoidospora regularis, Leiotriletes, and Pterisisporites.
Based on sporopollen identification results, the concept of sporopollen vegetation was applied to qualitatively reconstruct paleovegetation types by analyzing the ecological conditions and distribution characteristics of modern plants with the closest phylogenetic relationships, and further reveal the inferred temperature belt and humidity type [11-12]. The paleoclimate includes plaeotemperature and paleohumidity, which can be divided into four types: warm and humid, warm and arid, cold and humid, and cold and arid.
In the Wen 2 Member, angiosperm pollen is dominated by evergreen Quercus-type pollen [13] (e.g., Faguspollenites, Ulmapollenites), indicating that the vegetation during the depositional period was primarily deciduous plants under a tropical-subtropical climate, with humidity classified as “mesic” in the sporopollen-based humidity zonation.
Gymnosperm pollen is rich in Pinus pollen, mainly Pinus diploxylon-type, suggesting the presence of eurythermal evergreen trees or montane coniferous forests in a temperate climate. A portion of Taxodiaceaepollenites (indicative of subtropical coniferous forests) is also observed. The co-occurrence of tropical-subtropical and temperate plant pollen implies the existence of mountainous terrain near the depositional area.
Pteridophyte spores include Polypodiaceae monolete spores (thriving in tropical-subtropical climates) and Osmundacidites (preferring warm, humid environments). The parent plants of Osmundacidites grow in temperate to tropical belts, inhabiting swamps, moist valleys, or acidic soils near streams and forest understories, collectively indicating a warm and humid paleoclimate [14]. The total abundance of pteridophyte spores gradually decreases from the early to late stages of the Wen 2 Member, suggesting superior hydrothermal conditions in the early phase (Unit I) compared to the late phase (Unit III) (Fig. 4 ).
The sporopollen assemblage of the Wen 2 Member is dominated by tropical-subtropical plant pollen, reflecting a vegetation dominated by evergreen broad-leaved forests or trees. The presence of hygrophilous spores (e.g., Taxodiaceaepollenites, Salixpollenites, Potamogetonacidites) further supports a warm and humid tropical-subtropical climate during the Eocene Wen 2 Member deposition. Notably, Quercus pollen shows an increasing trend from early to late stages, while temperate-adapted Pinus pollen (mainly Pinus diploxylon-type) also increases progressively (Fig. 4 ), suggesting a gradual cooling trend from the early to late stages of the Wen 2 Member.
4.1.2. Elemental variation
The elemental composition of sediments is influenced by climate. During arid periods, water evaporation leads to alkalization, promoting the deposition of elements such as Mg and Ca. Elevated temperatures enhance Mg deposition, resulting in an increasing Mg/Ca ratio with intensified aridity [15]. In the Wen 2 Member of the Shunde Sag, the Mg/Ca ratio exhibits a trend of decrease-increase- decrease, vertically (Fig. 5 ). Specifically, Units I and III display relatively low Mg/Ca ratios, indicative of humid climates with limited lake water evaporation and strong terrestrial weathering. In contrast, Unit II shows a significant increase in Mg/Ca ratio, reflecting a semi-humid to semi-arid climate characterized by enhanced lake evaporation, shallower water bodies, increased alkalinity, and reduced input of nutrient elements, which are unfavorable for the formation of excellent source rocks.
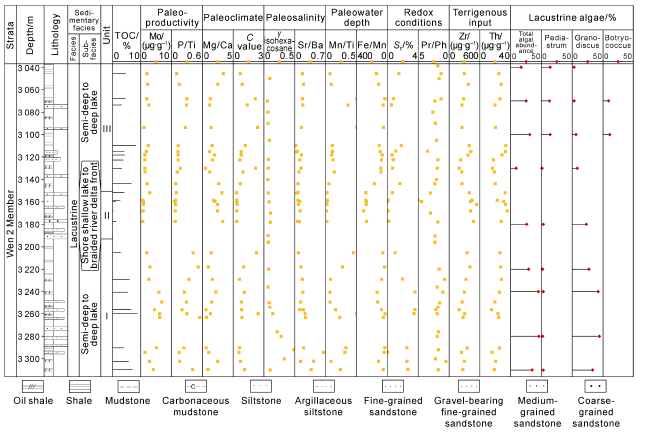
Fig. 5. Comprehensive geochemical column of the Wen 2 Member in Well W1. |
The C-value serves as an effective parameter for paleoclimate reconstruction [16]. This is because alkaline elements (e.g., Ca, Mg, K, Na), which prefer drought, will precipitate from water and accumulate in sediments as the climate becomes dryer and water evaporation increases. Conversely, humid climates promote the enrichment of hygrophilous elements (e.g., Fe, Mn, Cr) in sedimentary strata, leading to higher C-values [17]. Previous studies classify C-values higher than 0.8 as humid climates, 0.2-0.8 as semi-arid to semi-arid and semi-humid climates, and less than 0.2 as arid climates [17-18]. In the Wen 2 Member, the average C value is 1.04 in Unit I, and 1.16 in Unit III, both indicating predominantly humid conditions, while it is 0.35 in Unit II, suggesting semi-arid to semi- arid and semi-humid climatic characteristics (Fig. 5 ).
Integrating paleontological and elemental geochemical analyses, it is found that the Wen 2 Member depositional period was dominated by a warm and humid paleoclimate. Specifically, Unit I represent warm and humid conditions, Unit II reflects a semi-arid climate with warm-cool transition, and Unit III corresponds to cool and humid paleoclimatic conditions.
4.2. Paleoenvironmental reconstruction
Sedimentary environment is one of the key factors controlling organic matter enrichment. Investigating the depositional settings of organic-rich oil shales can reflect paleoenvironmental information and also provide insights into the spatial distribution and resource prediction of hydrocarbon source rocks.
4.2.1. Terrigenous input conditions and biogenic characteristics
Terrigenous debris is primarily transported into lacustrine basins by rivers. Excessive terrigenous input can dilute organic matter. Variations in the concentrations of high field strength elements (HFSEs) such as Zr and Th in trace elements are commonly used to indicate changes in as terrigenous input, their contents are minimally affected by weathering and diagenesis [19-21]. In the Wen 2 Member, the units I and III (semi-deep to deep lacustrine subfacies) show lower Zr and Th contents, suggesting reduced terrigenous input conducive to organic matter preservation. In contrast, Unit II (shore shallow lacustrine facies) displays relatively higher Zr and Th contents, indicating increased terrigenous input (Fig. 5 ).
The relative variations in terrigenous input intensity can be effectively reflected by analyzing the abundance of biomarker compounds indicative of higher plant origins in organic matters of hydrocarbon source rocks. In the Wen 2 Member of the Shunde Sag, Unit I source rocks exhibit a bimodal, front-peak-dominated pattern of n-alkane distribution (Fig. 6 ), suggesting mixed organic sources dominated by autochthonous lacustrine organic matter with minor contributions from terrigenous higher plants. Unit II source rocks display a unimodal, rear- peak-dominated pattern, reflecting predominantly terrigenous organic input. Unit III source rocks are bimodal, reflecting the mixed source characteristics of organic matter. However, compared to Unit II, the contribution of lake generated organic matter is significantly increased. The relative abundances of C27-29ααα20R regular steranes effectively distinguish hydrocarbon source rocks of different parental origins. Some samples from the Wen 2 Member in the W1 well showed a slight advantage in C27 steranes content, while others showed a slight advantage in C29 steranes content, reflecting the significant contributions of organic matter sources from terrestrial higher plants and lacustrine algae/bacteria sources, with mixed sources being the main source. The content of C30-4-methylsteranes (C30-4MST), which represents algal input, is very high in the hydrocarbon source rocks of Unit I of the Wen 2 member, with the tetramethyl sterane index (C30-4-methylsteranes/C30 hopanes) averaging 1.54, indicating a dominant algal source in lacustrine environments, while not containing the higher terrestrial higher plant source of dodecane. Its characteristics are similar to those of the main source rocks in the Huizhou Sag (Fig. 6 ). In Unit II source rocks, C30-4MST content decreases significantly, while C29 steranes (terrigenous markers) dominate, with the tetramethyl sterane index averaging only 0.27, reflecting a substantial increase in terrigenous higher plant contributions. Unit III source rocks show a slight increase in C30-4-methylsterane content (tetramethyl sterane index averaging 0.42) compared to Unit II but remain lower than Unit I, indicating persistent terrigenous influence with subtle variations.
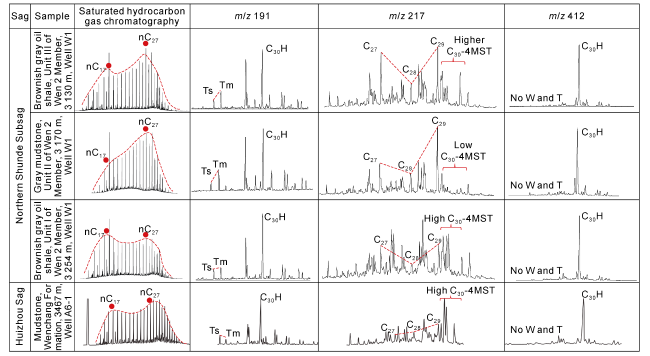
Fig. 6. Typical n-alkane and biomarker compound distribution of hydrocarbon source rocks in the Wen 2 Member of the Northern Shunde Subsag and the Wenchang Formation of the Huizhou Sag. |
4.2.2. Paleoproductivity
Paleoproductivity refers to the total organic matter produced by ancient organisms per unit area and time during geological history. The organic matter content in hydrocarbon source rocks directly reflects the paleoproductivity level, which, though influenced by preservation conditions and post-depositional alterations, generally correlates with high total organic carbon (TOC) values [20]. TOC content decreases in order (Fig. 4b ), indicating the highest paleoproductivity in Unit I, followed by Unit III, and the lowest is in Unit II.
Modern plant studies reveal that phosphorus (P), an essential element for biological growth and skeletal composition, serves as a direct proxy for paleoproductivity [21-22]. The P/Ti ratio further eliminates terrigenous input influences, precisely reflecting the nutrient status of paleo-lakes: higher P/Ti ratios indicate greater productivity [22-24]. Analysis shows that Units I and III, deposited in semi-deep to deep lake subfacies, exhibit higher P/Ti ratios (Unit I > Unit III), signifying relatively higher paleoproductivity. In contrast, Unit II, deposited in shore shallow lacustrine subfacies, displays lower P/Ti ratios, suggesting relatively lower productivity (Fig. 7a ). However, under reducing conditions, microbial activity at the lake bottom and the reduction of Fe/Mn oxides decrease phosphate adsorption sites on iron oxyhydroxides, leading to significant phosphorus release into the water column. To refine paleoproductivity evaluation, Cu and Mo concentrations in source rocks are utilized. Cu forms sulfides under reducing conditions, making it suitable for assessing paleoproductivity in the predominantly anoxic Wenchang Formation [23]. Mo, irreversibly co-precipitated with organic matter or iron sulfides, remains unaffected by redox conditions [25]. Mo content in the Wen 2 Member follows the trend as Unit I > Unit III > Unit II (Fig. 7b ), reflecting that unit I has the highest ancient productivity, followed by unit III and unit II. This is consistent with the change in P/Ti value, indicating that indicators such as TOC, P/Ti, Cu, and Mo can effectively indicate changes in paleoproductivity.
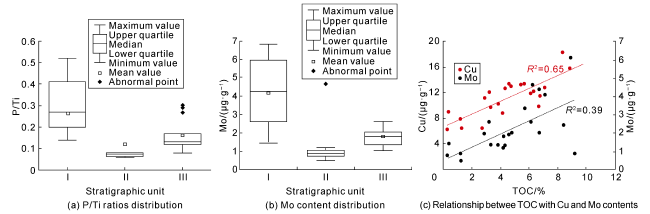
Fig. 7. Variations in productivity indicators and cross-plots for different stages of the Wen 2 Member. |
Correlation analysis between paleoproductivity proxies (Cu, Mo) and TOC in the Wen 2 Member reveals a strong positive relationship (R2>0.6; Fig. 7c ), demonstrating that high paleoproductivity was a key driver of organic matter enrichment in this interval.
Previous studies indicate that warm and humid climates and water eutrophication enhance productivity by increasing the abundance of photosynthetic primary producers and their photosynthetic flux [26]. To clarify the relationship between algal community evolution and primary productivity in the Wenchang Formation, quantitative analysis and identification of algae in the Wen 2 Member oil shales were conducted (Fig. 5 ). Results demonstrate that phytoplankton thrived during the Wenchang Formation depositional period. Units I and III, deposited in semi-deep to deep lacustrine subfacies, exhibit higher algal abundance compared to Unit II (shore shallow lacustrine subfacies), correlating well with paleoproductivity trends. Unit I is mainly composed of granodiscus, while Unit III is gradually increasing in pediastrum and Botrytis cinerea, which are the main primary producers in lakes. Notably, Pediastrum, a freshwater green algae typically inhabiting shallow lakes, suggests shallower water depths in Unit III compared to Unit I, despite both units representing semi-deep to deep lake environments. Comprehensive analysis reveals a strong synergistic variation pattern among paleoclimate shifts, algal abundance, and paleoproductivity, indicating that paleoclimate and lake eutrophication levels controlled primary producer algal biomass, thereby governing the lake productivity.
4.2.3. Paleosalinity
The relative abundance and parameters of cyclic terpane series compounds provide critical indicators for depositional environment discrimination. Marine and saline lacustrine facies typically exhibit the predominance of C23 tricyclic terpane (C23TT) (Fig. 8a ), whereas freshwater lacustrine source rocks are characterized by the predominance of C21 tricyclic terpane (C21TT). Swamp facies source rocks show marked C19+C20 tricyclic terpanes (C19-20), while fluvial/deltaic facies samples fall within transitional belts [27]. Analysis of tricyclic terpane distributions in the Wen 2 Member of Well W1 (Fig. 8a ) reveals that oil shales are C21TT-dominated, consistent with freshwater lacustrine deposition. Unit II displays greater environmental variability, with elevated C19-20TT content, indicating pronounced freshwater characteristics. Unit I exhibits slightly higher C23TT content than Unit III, suggesting marginally higher water salinity in Unit I. The gammacerane index (GI) serves as a dual indicator of paleosalinity and water stratification [28]. The Wen 2 Member generally exhibits low GI values (Fig. 5 ), supporting freshwater deposition. However, relatively higher GI values in Unit I source rocks, combined with its deep lake setting and elevated algal abundance, suggest combined influences of salinity and water stratification during this phase.
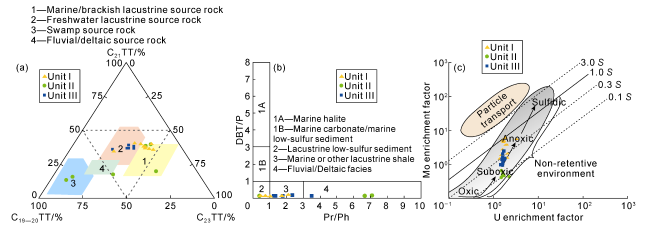
Fig. 8. Discrimination diagram for depositional environments of source rocks in the Wen 2 Member (S represents the Mo/U ratio in seawater). |
Strontium (Sr) and barium (Ba) concentrations in sediments are key discriminators of marine versus terrestrial environments. The Sr/Ba ratios are typically less than 1 for freshwater sediments, higher than 1 for marine sediments, and 0.6-1.0 for brackish transitional sediments. In the Wen 2 Member, average Sr/Ba ratios for Units I, II, and III are 0.13, 0.08, and 0.23, respectively, all indicative of freshwater conditions. Notably, Units I and III exhibit slightly higher paleosalinity compared to Unit II, implying that moderate salinity enhancement may have positively influenced organic matter preservation.
4.2.4. Paleowater depth
Authigenic coloration of sedimentary rocks provides critical insights into depositional environments, with dark hues (gray, grayish black, black) typically indicating deep-water reducing or strongly reducing conditions, where water depth generally correlates positively with color intensity. Core and sidewall core samples from the Wen 2 Member of Well W1 predominantly exhibit grayish brown to brownish gray, consistent with deep-water reducing environments.
Elemental geochemistry remains the most widely applied method for qualitative to semi-quantitative paleowater depth assessment. During transport, Fe and Mn undergo fractionation: Fe preferentially oxidizes and accumulates in estuarine or nearshore belts, whereas Mn undergoes long-distance transport and deposits distally. Consequently, lower Fe/Mn ratios in sediments reflect greater water depths, and vice versa [29]. Among Mn and Ti of terrigenous origin, Ti oxides exhibit lower oxidation resistance than Mn, enabling Mn/Ti ratios to indicate transport distance. Increasing water depth and offshore distance correlate with decreasing Fe/Mn ratios and rising Mn/Ti values [30]. Integrated analysis reveals that the Wen 2 Member was with distinct vertical evolutionary stages (Fig. 5 ). In Unit I depositional period, with the maximum paleo-water depth, Fe/Mn ratio less than 100 and Mn/Ti ratio of 0.1-0.3 suggest deep lake environments (dominantly semi-deep to deep lake subfacies), favorable for excellent source rock formation. In Unit II depositional period, with shallower water column, Fe/Mn ratio higher than 150 and Mn/Ti ratio less than 0.1 reflect shore shallow lake to braided river delta front subfacies. In Unit III depositional period, a lake expansion phase with renewed deepening, Fe/Mn ratio of 100-150 and Mn/Ti ratio less than 0.1 record primarily semi-deep to deep lake subfacies, with smaller depth than Unit I but the largest depositional extent, conducive to the widespread development of favorable source rocks.
For biomarker parameters, the pristane/phytane ratio (Pr/Ph) is a critical proxy of depositional redox states, with phytane dominance under reducing conditions and pristane preference in oxidizing environments [31]. The relative abundance of dibenzothiophene (DBT) and phenanthrene (Phen), controlled by depositional settings [32], also serves as a paleoenvironmental indicator. The Wen 2 Member displays generally low DBT/P and Pr/Ph values (Fig. 8b ), aligning with freshwater reducing lacustrine conditions. However, Unit II depositional period records marked shallowing, transitioning from deep-lake reducing environments to fluvial/deltaic shallow-water deposition.
4.2.5. Redox characteristics
A clear correlation exists between paleowater depth and redox conditions, with deeper water generally exhibiting stronger reducing environments. The paleowater depths of the depositional period of Wen 2 Member units follow the sequence: Unit I > Unit III > Unit II, corresponding to a redox intensity gradient of Unit I (strongest) > Unit III > Unit II (weakest).
Framboidal pyrite serves as a direct and effective indicator of water column anoxia. According to thin section observations, there is abundant bedding-parallel framboidal pyrite in Unit I oil shale from the Wenchang Formation (Fig. 9 ). In contrast, framboidal pyrite is sparse in Unit III, and almost absent in Unit II. This confirms that Units I and III formed under reducing conditions, whereas Unit II experienced weaker reduction.
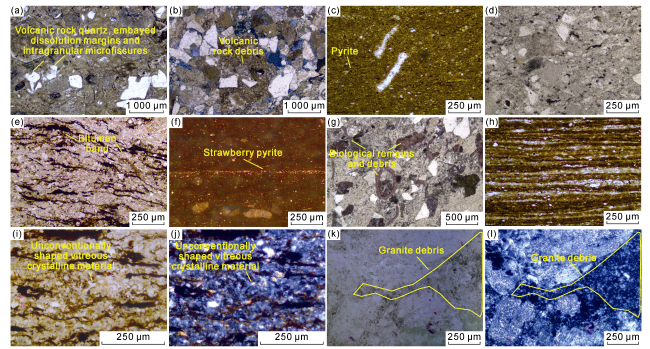
Fig. 9. Thin-section characteristics of clastic rocks in the Wen 2 Member of Well W1, Wenchang Formation. (a) 3 023.0 m, tuffaceous texture with volcanic dust cements, irregularly shaped quartz grains derived from volcanic rocks, displaying embayed dissolution margins and intragranular microfissures (plane-polarized light). (b) 3 033.4 m, tuffaceous sandstone containing volcanic debris, predominantly with coarse debris grains, and extremely coarse grains occassionally (plane-polarized light). (c) 3 122.6 m, mudstone composed mainly of mud mixed with minor silt, exhibiting lepidoblastic texture and sparse pyrite (plane-polarized light). (d) 3 156.5 m, tuffaceous texture dominated by debris with minor crystal fragments, cemented by mud (plane-polarized light). (e) 3 177.5 m, tuffaceous texture with bitumen-like bands filling fractures, containing abundant irregularly shaped volcanic materials (plane-polarized light). (f) 3 256.5 m, oil shale interbedded with clay layers or lenticular clay laminae, strawberry pyrite distributed along bedding planes (plane-polarized light). (g) 3 288.0 m, tuffaceous texture containing bioclasts and minor crystal fragments (plane-polarized light). (h) 3 309.6 m, alternating thin layers of oil shale and claystone. (i) 3 177.5 m, unconventionally shaped vitreous crystalline material (plane-polarized light). (j) 3 177.5 m, unconventionally shaped vitreous crystalline material (cross-polarized light). (k) 3 023.0 m, granitic lithic fragment with tuffaceous cement in intergranular spaces (cross-polarized light). (l) 3 023.0 m, same field of view as Fig. k (plane-polarized light). |
Molybdenum (Mo) and uranium (U) exhibit distinct enrichment patterns in response to redox potential under varying water conditions [33]. When authigenic Mo enrichment significantly exceeds U enrichment, it typically indicates sulfidic anoxic conditions, whereas the reverse suggests non-sulfidic anoxia [33-34]. The covariation plot of Mo and U enrichment factors (Fig. 8c ) further reveals Mo transport processes and sulfidation intensity in basin bottom waters [34]. Unit I depositional period Molybdenum (Mo) and uranium (U) exhibit distinct enrichment patterns in response to redox potential under varying water conditions predominantly developed under anoxic conditions favorable for source rock preservation. Unit III depositional period straddles the anoxic-dysoxic boundary, characterized by reducing to weakly reducing conditions with moderate preservation potential. In contrast, Unit II depositional period reflects dysoxic-hypoxia environments with elevated oxygen levels, leading to weak reduction-oxidation conditions that promote organic matter oxidation and poorer preservation.
In lacustrine or marine bottom waters, oxygen depletion is primarily driven by algal decay and organic matter decomposition. When dissolved oxygen falls below 5%, reduced sulfur species emerge, triggering total sulfur content (St) increase [35]. St can be used as an effective parameter in evaluating the bottom water redox conditions. Comparative St analysis (Fig. 10a ) shows Unit I depositional period with the highest St values, consistent with its anoxic signature (aligned with Fig. 8c ). Strong correlation between TOC and St (R2>0.65; Fig. 10b ) confirms anoxic conditions as a key control on organic matter enrichment. Unit II depositional period displays the lowest St values, with Mo-U covariation indicating weakly oxic conditions. Despite high TOC-St correlation (R2>0.94), this suboxic environment of the unit facilitated organic matter degradation. Unit III depositional period exhibits moderate St levels (anoxic-dysoxic) and robust TOC-St correlation (R2>0.75), suggesting preservation conditions comparable to Unit I.
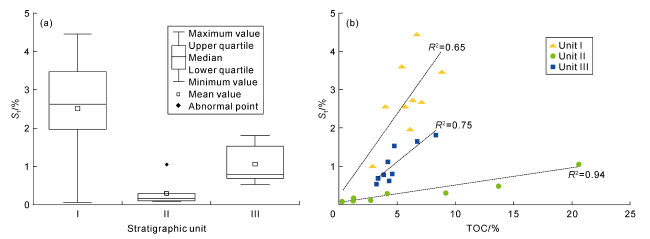
Fig. 10. Distribution of St in whole-rock samples (a) and correlation between St and TOC (b). |
Integrated biomarker, framboidal pyrite, elemental geochemistry, and sulfur systematics demonstrate consistent redox intensity trends: Unit I > Unit III > Unit II. This pattern aligns with coeval variations in paleoproductivity, water depth, and salinity, indicating synergistic multi-factor controls on organic matter accumulation in the study area.
4.3. Volcanic activity
Previous studies have confirmed that volcanic activity can provide substantial nutrient inputs to lakes [36-38] and induce warm humid climatic conditions, thereby promoting high primary productivity and organic matter accumulation. According to petrological and mineralogical analyses, thin sections of the Wen 2 Member oil shale exhibit extremely fine volcanic ash cements, sporadic granitic fragments, and elongated vitreous crystalline materials (Fig. 9d , 9e, 9i-9k). Ubiquitous embayed quartz with angular edges and pyroclastic content below 25% (Fig. 9a , 9b) indicate that the oil shale in this section was affected by volcanic activity during the deposition period, with short transportation distance and poor roundness.
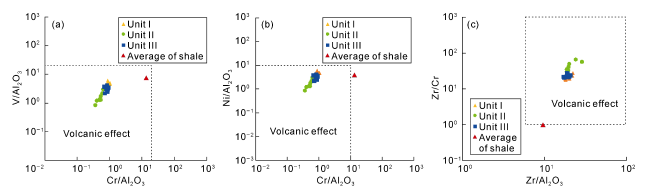
The combined application of multiple elemental indicators can effectively assess volcanic influence and its intensity in sedimentary rocks. Kiipl et al. [39] successfully identified volcanic activity signatures in the Scandinavian section of the eastern Baltic region using TiO2, Zr, Cr, and V. Yang et al. [40] established geochemical element identification templates for Ordovician-Silurian boundary volcanic activity by comparing geochemical characteristics of shale layers influenced by volcanism with those unaffected. Building on these methodologies, cross-plots of characteristic elements (Cr, V, Ni, Zr, Al2O3) from the Wen 2 Member oil shale in the Shunde Sag were employed to identify volcanic effects in the Wenchang Formation (Fig. 11 ). The results demonstrate significant volcanic influence during the deposition of the Wen 2 Member. Additionally, previous studies confirm widespread 40-50 Ma volcanic rocks in the vicinity of the Shunde Sag [41-44], further corroborating active volcanism during the deposition of the Wen 2 Member.
5. Source rock development model
Integrated analysis reveals that the source rocks of the Wen 2 Member in the Northern Shunde Subsag formed under synergistic controls of rapid lacustrine basin subsidence during intense rifting, undercompensated sedimentary environments, paleoclimate, volcanic activity, and dynamic depositional conditions. This establishes a unique model of organic matter enrichment in the Wen 2 Member source rocks (Fig. 12 ).
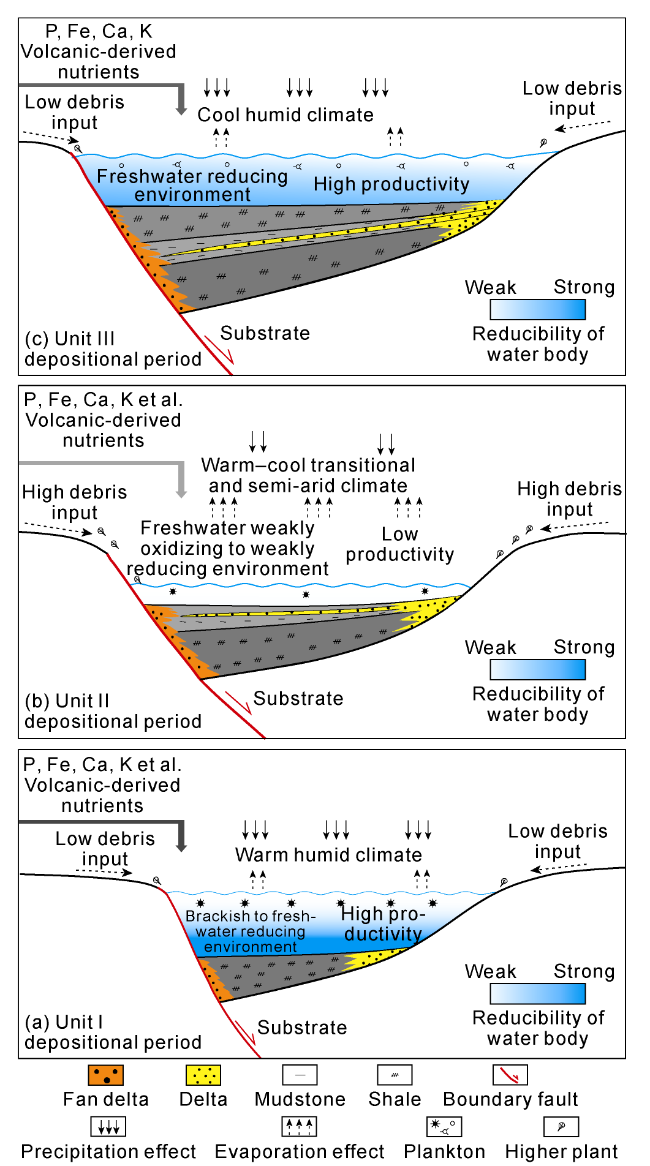
Fig. 12. Development model of excellent source rocks in the Wen 2 Member of the Shunde Sag (colors changing from light grey to deep grey represents organic matter content changing from low to high). |
Unit I depositional period: Under a warm humid paleoclimate (evidenced by sporopollen, C values, and Mg/Ca ratios), volcanic activity (volcanic ash) introduced nutrient elements (e.g., phosphorus), triggering blooming algals (primarily Granodiscus) which induce high primary productivity, accompanied with a rapid accumulation of autochthonous Type I organic matter (reflected in TOC, HI and (S1+S2)). Anoxic reducing conditions in deep-lake settings (indicated by St, Fe/Mn-Mn/Ti ratios, and tricyclic terpanes) combined with elevated salinity (gamacerane) created ideal conditions for organic matter preservation. Limited terrigenous input further minimized dilution effects, enhancing the formation of excellent source rocks. The perfect coupling of volcanic activity, warm humid climate, and deep-water reducing environment drove the deposition of excellent source rocks in this stage.
Unit II depositional period: As the paleoclimate transitioned to cool humid and semi-arid conditions, the lake productivity declined, with reduced algal abundance and a shift to mixed Type II2-II1 terrigenous organic matter. Lower primary productivity resulted in diminished initial organic matter content. Concurrently, weak oxidation in shore shallow lake subfacies and increased terrigenous input exacerbated organic matter dilution and oxidative degradation, ultimately yielding lower organic content and inferior source rock quality. The interplay of semi-arid climate, low productivity, and shallow-water oxidizing environment negatively impacted source rock development.
Unit III depositional period: With a shift to cool humid paleoclimate, the lacustrine ecosystem rejuvenated, marked by diversified algal communities (e.g., Pediastrum, Botryococcus) and rebounded primary productivity. Organic matter originated predominantly from lacustrine autochthonous sources, supplemented by minor terrigenous higher plant input, forming Type II1 source rocks. The transition from shore shallow to semi-deep lake environments, coupled with enhanced reducing conditions and reduced terrigenous input, favored organic matter preservation. Although slightly inferior to Unit I, Unit III source rocks remain favorable. The synergy of cool humid climate, moderate productivity, and semi-deep lake reducing environment positively influenced source rocks quality.
In summary, the development of the Wen 2 Member source rocks reflects a complex interplay of tectonic-sedimentary conditions, warm humid climate, volcanic activity, and depositional environments. These factors not only promoted lacustrine biological prosperity (particularly algae as primary producers) but also facilitated the formation of deep-water reducing environments in semi-deep to deep lakes through intense early-stage faulting in the rift basin. This combination enabled the initial enrichment and preservation of excellent source rocks in small yet fertile marginal sags during the early rift phase. Comparative analysis highlights the heterogeneous and rapidly varying nature of marginal sag source rocks, with Unit I representing the highest quality, followed by Unit III, while Unit II ranks lowest.
6. Conclusions
The Northern Shunde Subsag is confirmed to host source rocks of semi-deep to deep lake subfacies in the Wen 2 Member, characterized by high organic matter abundance (TOC of 1.2%-8.9%) and favorable organic matter types (hydrogen index: 217-696 mg/g), which are dominantly Type I-II1 kerogens suggesting a high potential of hydrocarbon generation. Based on logging, seismic and geochemical characteristics, the Wen 2 Member is vertically divided into Units I, II, and III. Units I and III comprise excellent, thick-bedded, brownish-gray to grayish-brown oil shales with organic matter primarily derived from algae, while Unit I exhibits superior quality to Unit III and represents the most favorable source rock in the study area. Unit II consists of gray mudstone, thin silty-fine sandstone, and carbonaceous mudstone, which are classified as good to excellent source rocks originated dominantly from terrigenous higher plants.
The development model of the Wen 2 Member in the Northern Shunde Subsag is governed by the synergistic interplay of rapid subsidence during intense rifting, limited sediment supply, warm humid climate, volcanic activity, and deep-water reducing conditions, leading to vertical heterogeneity in source rock distribution. During Unit I depositional period, the warm humid climatic conditions promoted blooming algals (predominantly Granodiscus), high primary productivity, and the deepest paleo-lake water column under anoxic reducing environments, which favored organic matter preservation. During Unit II depositional period, a shift to semi-humid to semi-arid climate, shallower water depths, increased terrigenous clastic input, and reduced lake productivity resulted in weakly reducing to weakly oxidizing conditions, exacerbating organic matter dilution and oxidative degradation, thus leaving poor preservation conditions. During Unit III depositional period (lake expansion phase), water depths increased again, accompanied by a transition to cool humid climate, proliferation of Pediastrum and Botryococcus algae, and reducing to weakly reducing environments, improving organic matter preservation.
This source rock development model for the Northern Shunde Subsag established depending on paleoclimate and plaeoenvironment provides a scientific basis for deciphering the spatial distribution patterns of excellent source rocks and quantitatively evaluating resource potential in this area, but also offers critical insights for predicting source rocks and guiding hydrocarbon exploration in marginal sags with similar geological settings.