

Introduction
In recent years, significant oil and gas discoveries have been made in Shunbei-Fuman area at the east of the strike-slip fault F5 in the northern Tarim Basin. The Tarim Basin boasts of substantial petroleum reserves in the marine strata below 8 000 m as the only cratonic basin in the world [1]. Ultra-deep marine hydrocarbon (deeper than 8 000 m) are mainly occurred in the Middle-Lower Ordovician carbonate reservoirs beneath the Middle-Upper Ordovician source rocks chronologically and vertically, so it is inferred that the ultra-deep marine hydrocarbon is from the source rocks at the bottom of the underlying Cambrian System [2]. However, there is controversy regarding the characteristics of kerogen Lower of Cambrian source rocks in different structural and sedimentary facies zones [3], so that the resource potential is unclear in the ultra-deep strata at the west of the strike-slip fault F5. Large-scale hydrocarbon discoveries have long been absent in the Cambrian ultra-deep strata adjacent to these source rocks.
Cambrian as the first system of the Phanerozoic represents a significant turning point in the history of the Earth biosphere. The Cambrian is characterized by the first appearance of complex and diverse organisms that exhibited explosive evolution on the Earth, and signifies a revolutionary transition of the Earth life system from microbiological dominance to an animal ecosystem [4]. This period is also crucial for the global phosphogenic event. Following the end of the glacial period, the temperature rose, rapidly enhancing the oxidation of the atmosphere and ocean, and major unconformity events [5] hindered wide deposition of hydrocarbon source rocks at the bottom of the Cambrian System. It is believed that the Cambrian source rocks deposited all over the world at the peak of a global first-order rise and fall of the sea level during the Middle-Late Cambrian period, mainly distributed in the tropical-subtropical semi-restricted seas among Baltica (Alum Shale), Gondwana (Arthur Creek Shale) and Laurentia. However, the responses to significant evolution transitions of the Earth surface system and deep lithosphere vary remarkably in different landmasses [6-7]. In China, the Middle-Upper Cambrian strata in marine cratonic basins provide a record of the deposits of semi-open-open platform facies, and the source rocks were developed intensively during the Lower Cambrian, supporting the formation of large-scale oil and gas resources in the Sichuan Basin and the Tarim Basin. It is different sharply from the oil and gas systems in the South Oman Salt Basin and eastern Siberia where the hydrocarbon from bottom Cambrian was primarily originated from the Precambrian source rocks [8-9], forming the globally unique Early Cambrian oil and gas systems. Among them, the effective Cambrian source rocks in the Tarim Basin were developed earliest, such as the Yurtusi Formation (—C1y) and the Xishanbulake Formation (—C1xs) source rocks broadly distributed in the northern depressions, which correspond to the Terreneuvian epoch of the early Cambrian Period [10]. The biological contribution to hydrocarbon generation in different sedimentary environments and lithofacies zones in the Tarim Basin during the Early Cambrian period has not been described, and limits exploration expansion for ultra-deep oil and gas.
Many exploratory wells targeting the Cambrian dolomite were drilled in the Tazhong, Tabei and Bachu uplifts in the Tarim Basin, but industrial oil and gas flows were only obtained from wells ZS-1, KT-1, and LT-1. Specifically, condensate oil and gas and volatile oil reservoirs were discovered in the Lower Cambrian Xiaorublak Formation (—C1x) and the Middle Cambrian Awatag Formation gypsum-salt rocks in Well ZS-1. Unfortunately, the well was shut in after rapid decline of production capacity. Natural gas and light oil were obtained from the Wusongger Formation adjacent to the Middle Cambrian gypsum-salt rocks in Well KT-1 and LT-1, respectively. Notably, in 2023, Well XT-1 drilled in the Kalayuergun structural belt at the western margin of the Tabei uplift encountered large-scale condensate gas reservoirs in the dolomite weathering crust in the Lower Qiulitag Formation of the Upper Cambrian, with an oil-gas column as high as 180 m, condensate oil density of 0.81 g/cm, and gas-to-oil ratio of 710-920 m3/m3. This discovery provides a direct target for revealing effective source and accumulation of ultra-deep oil and gas in the area at the west of the strike-slip fault F5. For clarifying the exploration prospects of ultra-deep oil and gas in the west of Tabei to the periphery of Awati sag, it is of great basic research value and guiding significance in exploration practice to compare and analyze the differences in biomarkers from hydrocarbon source rocks of various sedimentary facies in the Cambrian Terreneuvian series in the Tarim Basin, and conduct an in-depth analysis of the biogenic origins of the newly discovered Cambrian crude oil in Well XT-1 at the west of the strike-slip fault F5.
1. Geologic setting
The ultra-deep Cambrian reservoirs identified in the Tarim Basin mainly include the Awatag Formation, Wusongger Formation, and Xiaoerbulak Formation of the Lower-Middle Cambrian. The recent discovery of condensate gas reservoir in Well XT-1 marks the beginning of ultra-deep exploration in the western Tabei area (Fig. 1a ). Based on the spatial distribution of the identified ultra-deep reservoirs in the structural setting of the modern basin area, the Lower Ordovician reservoirs in the Shunbei, Fuyuan and Manshen areas of the slope zone of the ancient uplift are located at the western edge of the Manjar sag. Existing industrial oil and gas wells targeted the Cambrian reservoirs, such as wells ZS-1 and LT-1, are also located in the Manjar sag, suggesting that hydrocarbons inside are mainly generated from the Manjar sag. The Cambrian reservoirs in Well KT-1 are in the hanging wall of the Shajingzi fault in the western margin of the Awati sag. It is generally considered that the Awati sag serves as a major hydrocarbon generation center. Well XT-1 was drilled in the transition zone between the Awati sag and the Manjar sag. It is crucial to determine whether the oil and gas in Well XT-1 are primarily from the Awati sag or the Manjar sag for clarifying the hydrocarbon source at the west of F5.
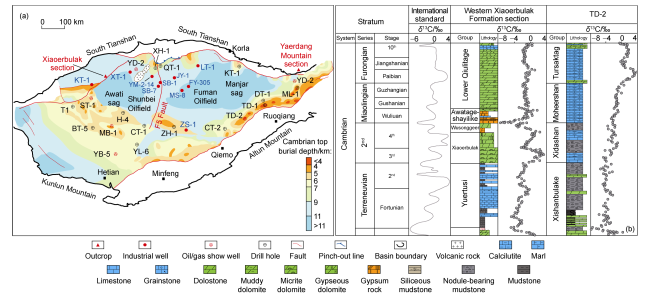
Fig. 1. Top burial depth of the Cambrian (a) and lithology and carbon isotope composition of the Cambrian samples from different well blocks (b) in the Tarim Basin (modified from Ref. [11]). |
The modern basin structure and the Lower Paleozoic sag center do not reflect the ancient landform of the Lower Cambrian source rock deposition period. The Lower Cambrian source rocks revealed by drilling and outcrop data mainly include —C1xs-—C1xd in the Manjar sag in the Tadong area, and —C1y in the central-western Tabei uplift. By comparing the carbon isotope curves of different lithofacies zones in the Tarim Basin with the international standard curve, the —C1xs and —C1y source rocks are roughly isochronous deposits of the Terreneuvian series (Fig. 1b ). In the western Tarim Basin, the —C1y source rocks, particularly in Well XH-1 and Xiaoerbulak section, are composed of layered siliceous rock, siliceous rock interbedded with mudstone, siliceous dolomite, and fine dolomitic sandstone from bottom to top. Among them, black shale, only a few meters thick, has TOC up to 14%, and oil-containing [12] barite nodules were observed. In the central Tarim Basin, the —C1y source rocks drilled in wells LT-1 and QT-1 dominantly consist of calcareous mudstone and mudstone, up to 45 m thick. In the Tadong area, the —C1xs source rocks, representatively in wells TD-1, TD-2 and YD-2 drilled in the Tadong low-uplift, locally contain phosphorus, and are primarily composed of siliceous rock and mudstone, with some volcanic interbeds. They show a significantly lower dolomite content than that of —C1y in the west, and are often interbedded with gray-black radiolarian siliceous rocks. The cumulative thickness of effective source rocks with TOC higher than 0.5% exceeds 100 m. The rock assemblage, thickness, and organic matter abundance of the Terreneuvian source rocks exhibit remarkable variation in different sedimentary zones within the Tarim Basin.
2. Samples and methods
The samples were collected from the Cambrian Terreneuvian series in different structural locations in the Tarim Basin, including the —C1y source rocks in the Xiaorublak section and Well QT-1 in the western basin, the representative —C1xs source rocks in Well TD-2, the Ordovician hydrocarbon from wells YM-2-14 and YD-2 located at the west of F5 (Fig. 1 ), and the Cambrian crude oil in Well XT-1. The fundamental geochemical data of the representative Cambrian Terreneuvian source rocks and related reservoirs are listed in Tables 1 and 2 .
Table 1. Geochemical data of Cambrian source samples from different lithofacies zones in the Tarim Basin |
| Outcrop/Well | Formation | Depth/m | TOC/% | Hydrogen index/ (mg·g−1) | Maximum pyrolysis temperature/°C | Ro/% |
|---|---|---|---|---|---|---|
| Xiaoerbulak section | Yuertusi | 0.18-14.80 | 79.5 | 495 | 1.52 | |
| QT-1 | Yuertusi | 5 990 | 0.35-9.50 | 214.3 | 443 | 0.89 |
| LT-1 | Yuertusi | 8 680 | 0.23-8.20 | 124.2 | 483 | 1.58 |
| TD-2 | Xishanbulake | 4 977 | 0.13-7.80 | 33.5 | 597 | 3.21 |
Table 2. Oil properties of representative reservoir samples from the west of F5 in the Tarim Basin |
| Well | Formation | Depth/m | Density of crude oil/(g·cm−3) | Wax content/% | Sulfur content/% | GOR |
|---|---|---|---|---|---|---|
| YM-2-14 | Yijianfang | 5 858-5 889 | 0.88 | 9.2 | 0.99 | 210 |
| YD-2 | Yingshan | 4 939-4 983 | 0.91 | 5.8 | 2.20 | |
| XT-1 | Lower Qiulitage | 6 593-6 800 | 0.81 | 7.3 | 2.50 | 714 |
Gas chromatography-mass spectrometry (GC-MS) analysis was conducted to measure the content and distribution of biomarkers extracted from the soluble organic matters and crude oil in source rocks, with 5α-Androstane and anthracene-D10 serving as the standard compounds for quantitatively analyzing saturated and aromatic hydrocarbon fractions, on the TRACE GC ULTRA/DSQII equipped with a HP-5MS silica gel column (length of 60 m, diameter of 0.25 mm, film thickness of 0.25 µm) of Thermo Scientific. Helium was used as carrier gas. Furthermore, by combining gas chromatography (GC) with tandem mass spectrometry (MS/MS), the interference induced by azeotropic effect was eliminated from the identification and distribution of biomarkers. The test was performed on the TSQTM8000 Triple Quadrupole GC-MS/MS equipped with the same type and specification of the column as used in the GC-MS analysis of Thermo Scientific.
3. Biogenic origins of Cambrian Terreneuvian source rocks of different lithofacies in the Tarim Basin
Terreneuvian source rocks discovered show distinct lithologic characteristics in different zones. Specifically, the —C1y source rocks in the Xiaoerbulak section in the northwestern basin are composed of thin layers of high-TOC shale in siliceous rocks, and those in the central Tabei area consist of calcareous mudstone with medium thickness and TOC, and the —C1xs source rocks in the Tadong area are thick siliceous shale with medium TOC. It is concluded that the three source rocks of different lithofacies deposited in different sedimentary environments, and may have different hydrocarbon-generating parent materials.
3.1. Trimethyl aryl isoprenoids (TMAIs) indicate favorable depositional environments for hydrocarbon source rocks
The analysis of trimethyl aryl-isoprenoids (TMAIs) in the hydrocarbon source rocks suggests that the Cambrian Terreneuvian source rocks in the Tarim Basin developed in three sedimentary water environments. In wells Lun-1 and Qifan-1 in the Tabei area, the hydrocarbon source rocks are composed of organic-rich mudstone and carbonate rocks, and abundant TMAIs were detected (Fig. 2 ), indicating anoxia and photic zones as the depositional environment, and suggesting that the sulfidic water is more conducive to forming relatively thick and high-TOC hydrocarbon source rocks. The —C1y in the Xiaorublak section in the northwest of the basin consists of thin interbeds of siliceous rock and mudstone, with only a minimal amount of TMAIs (Fig. 2 ), and numerous barite nodules and multiple metallic minerals such as Ni and Mo [13]. This reveals that the depositional environments of —C1y source rocks and the molecular characteristics of their sources in the Awati sag and deep wells in the Tabei area are different. Moreover, the Terreneuvian source rocks depositing in the Tadong area consist of thick siliceous mudstone known as the Xishanbulake Formation in the deep-water basin, where entire 2,3,6-TMAIs were not detected, which were sourced from carotenoids synthesised by cyanobacteria and green sulfur bacteria (GSB) [14]. Unlike the ubiquitous cyanobacteria, GSB typically inhabit in photic and anoxic water, generally 10-30 m below the oxidation-reduction transition zone.
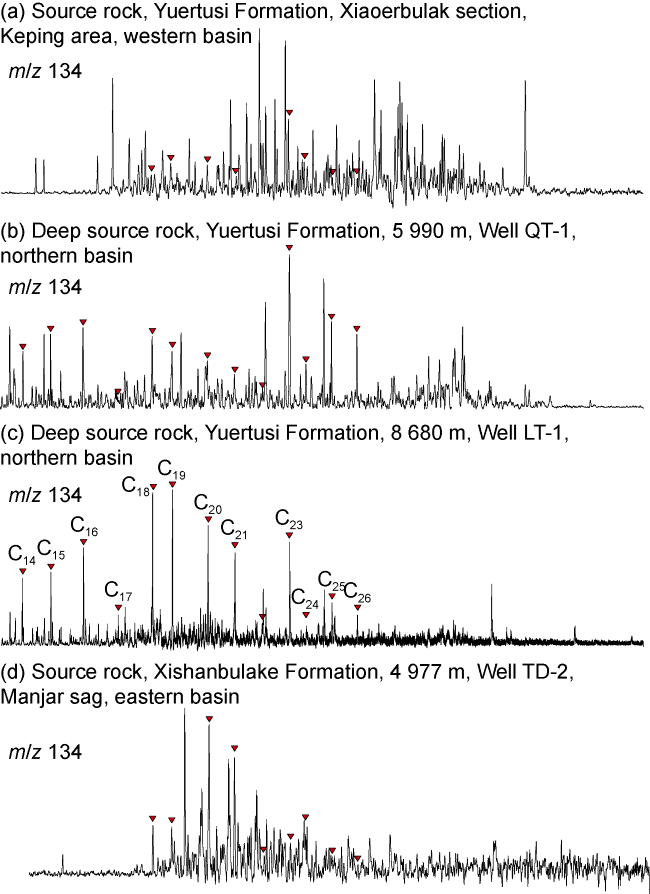
Fig. 2. Distribution patterns of TMAIs in the Cambrian Terreneuvian source rocks deposited in different lithofacies zones in the Tarim Basin. |
Based on the metabolic process of chemolithoautotrophic bacteria, the δ13C of the GSB-derived organic matter may be up to 15‰ [15]. This allows for the determination of the source of 2,3,6-TMAIs. However, the current content of 2,3,6-TMAIs in the Cambrian Terreneuvian source rocks discovered in the Tarim Basin does not reach the detection limit for isotopic composition of individual hydrocarbons. Thus, the source rocks with higher contents of 2,3,6-TMAIs are needed to be discovered for further confirmation of their exact biogenic source. Additionally, no 2,3,4-TMAIs have been reported in the Cambrian source rocks and crude oil in the Tarim Basin. These compounds may be the isomerized products of 2,3,6-TMAIs, but they are more broadly recognized as the degradation products of C40 aromatic carotenoids, indicating a biological input of purple sulfur bacteria (PSB) [16-17]. Compared to GBS, PSB inhabit at 12-15 m below water where they require stronger light for oxygen generation and exhibit greater tolerance to oxygen. Therefore, the absence of 2,3,4-TMAIs in the Cambrian source rocks and crude oil in the Tarim Basin suggests that the moderate sulfidic and photic zone is probably a favorable depositional environment for the Cambrian Terreneuvian source rocks of the Manxi hydrocarbon-generating center (Manxi area for short).
3.2. Triaromatic steroids indicate biogenic source difference of Terreneuvian source rocks in different facies zones
Triaromatic steroid is one of the few aromatic hydrocarbon compounds in geologic bodies that have clear indication of biogenic origin [18]. Their thermal stability is also significantly higher than that of saturated hydrocarbons, terpanes and alkanes, allowing them to be used as potential indicators of the origin of ultra-deep, high- maturity oil and gas. Since live organisms cannot synthesize the detectable quantity of aromatic steranes, it was previously recognized that monoaromatic steranes are products of the aromatization of sterols and sterones within biological organisms. Ring-A and Ring-B monoaromatic steranes are commonly found in geological bodies formed in the early diagenetic stage, where microbial- mediated aromatization at low temperature may produce complete aromatic steranes [19-20]. As the degree of thermal maturation increases, monoaromatic steranes form Ring-C monoaromatic steranes and triaromatic steroids through aromatization during the late diagenetic stage [21-22]. Thermal maturation and biologically mediated aromatization are dominant mechanisms for forming aromatic steranes. C26-C28 triaromatic steroids are typically from the aromatization of C27-C29 steranes. Biological mediation at low temperature results in variable aromatization degrees of different triaromatic steroid homologues, so that the relative abundance of C26-C28 triaromatic steroids does not completely align with the molecular configuration distribution of steranes, consequently a relatively independent molecular indicator for identifying the source of oil and gas. The —C1y source rocks in Well LT-1 and Xiaorublak section are similar in maturity, and the vitrinite reflectance (Ro) of organic matter is over 1.5%. However, significant differences in the composition of triaromatic steroids are observed (Fig. 3 ), illustrating that triaromatic steroids can be utilized as the tracer of oil and gas source at high maturity.
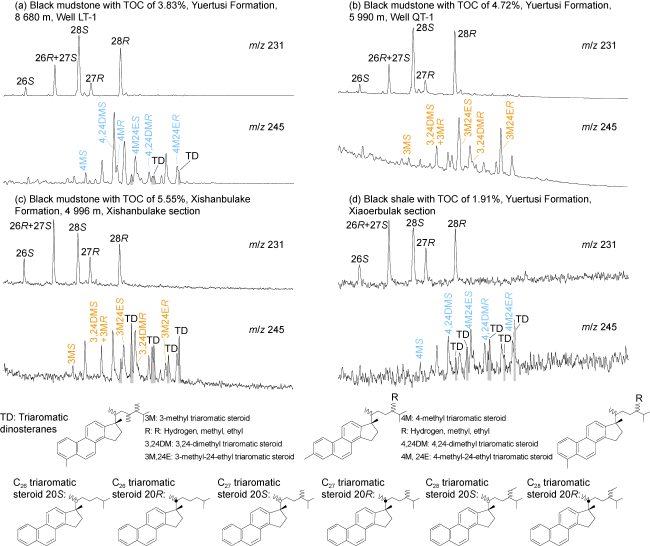
Fig. 3. Triaromatic steroids in representative hydrocarbon source rocks in the Cambrian Terreneuvian Series, Tarim Basin. |
Among methyl-substituted triaromatic steroids, 3-methyl triaromatic steroids are typically derived from the biocatalysis of prokaryotic bacteria, going through the similar biosynthetic process as C35 bacterio-hopanetetrol [23]. They may be an indicator of bacterial cell membranes, and effectively differentiate the biogenic sources of organic matter. Abundant triaromatic dinosteranes (TAS) were first detected in the Cambrian System in Well TD-2 drilled in the southern margin of the Manjar sag in the eastern Tarim Basin, revealing a correlation between the Pre-Triassic TAS and the diversity of ancient acritarchs[24-25]. The TAS is utilized to identify the oil and gas sources from Cambrian and the Ordovician [24,26]. As exploring the ultra-deep Cambrian strata in the platform-basin area of the Tarim Basin further expanded, no TAS have been identified in the —C1y source rocks in Wells QT-1 and LT-1 drilled in the central Tabei area (Fig. 3 ). Biomarkers such as C30 4-methyl triaromatic steroids and 24-norcholestanes are absent, the content of corresponding 4-methyl triaromatic steroids is significantly lower, but C29 3-methyl triaromatic steroids are predominant.
This suggests the absence of ancient dinoflagellates, diatoms and other hydrocarbon-producing microorganisms that are able to synthesize TAS in the Yuertusi Formation in the central basin. It is likely due to the relatively late flourishing of these microorganisms, along with certain selectivity regarding the depositional water environments where are suitable for these ancient oil-producing algae to inhabit. The lack of dinoflagellates and diatoms often occurs in oceanic centers far from continents, where nutrient components are deficient due to no upwelling currents [27]. The differences in the composition of triaromatic steroids in the source rocks from various facies zones can be used effectively to identify the sources of the Cambrian Terreneuvian oil and gas in different sedimentary environments in the Tarim Basin.
3.3. Compositions of steranes and terpanes of different lithofacies in Cambrian Terreneuvian source rocks
Steranes in organic matter is typically believed from eukaryotic algae [28], while hopanes from prokaryotic bacteria [29]. However, due to the widespread presence of bacteria in sediments, hopanes are found in almost all crude oil. It is not a very effective way to identify the source of crude oil by making use of the relative abundance of terpanes [17,30]. In the hopane series, gammacerane is a kind of C30 tricyclic terpane that frequently appears in high-salinity marine and non-marine sediments, and it is also abundant in some marine oil from carbonate or evaporite rocks [31]. Strong biological degradation often results in the loss of steranes, hopanes, pregnanes and homopregnanes in crude oil, but gammaceranes exhibits strong resistance to biodegradation and can be preserved well after this process [32]. In the Tarim Basin, the Cambrian Terreneuvian source rocks in different structural-sedimentary environments all show an increasing gammacerane index (Gar/C31 hopane) with maturity (Fig. 4 ). Therefore, the relative peak of gammacerane is not an effective indicator for identifying their biogenic origins.
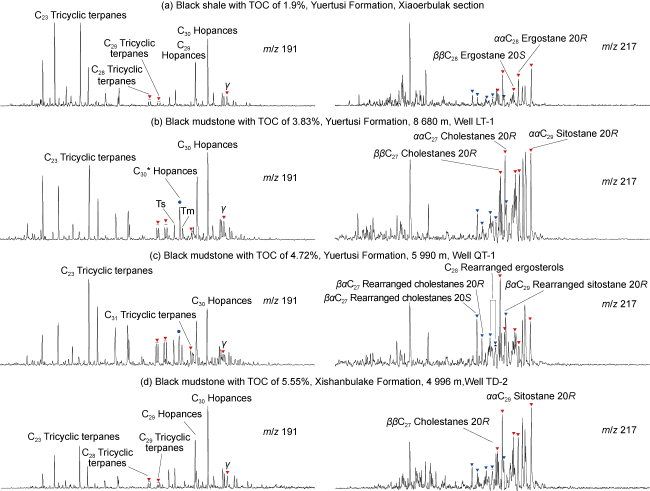
Fig. 4. Steroid and terpene compositions in main source rocks of the Cambrian Terreneuvian Series in the Tarim Basin. |
Tricyclic terpanes were initially thought to be from regular C30 isoprenoid hydrocarbons [33]. However, with extensive detection of tricyclic terpanes in Tasmanites, vascular plants and saline lake basins, ambiguity appears in the interpretation of oil-source correlation. In the Cambrian Terreneuvian source rocks depositing in different sedimentary environments within the Tarim Basin, the Yuertusi Formation in Well QT-1 has been identified as the source rock with the lowest maturity observed to date, where the highest relative abundance of long-chain tricyclic terpenes has been detected (Fig. 4 ). The long-chain tricyclic terpenes reflect the original distribution pattern and content of tricyclic terpanes in the Cambrian source rocks, and show significant difference in relative abundance compared to those in the western basin and the Tadong area. Thus, they may serve as a biomarker for determining the source of the Cambrian oil and gas.
Due to the lack of sustainable sterol biosynthesis capability in bacteria, steranes are often used as the biomarker of ancient eukaryotic algae. Typically, C27 steranes are thought to be from lower aquatic organisms and benthic red algae, and C28 steranes primarily from brown algae. C29 steranes are mainly sourced from algae as well as terrestrial higher plants, and can be also biosynthesized by some algae, such as brown and green algae. Most C28/C29 sterane ratios of the Cambrian source rocks in the Tarim Basin are generally over 0.5, significantly higher than the global average 0.25. This characteristic deviation may be induced by the biological origin of the organic matter and controlled by the thermal maturation process of hydrocarbon source rocks. Sterane distribution patterns observed in the Cambrian source rocks in the Tarim Basin reveal that high-maturity source rocks show significantly increased abundance of αα20R-steranes and decreased peak intensity of rearranged steranes (Fig. 4 ). Additionally, Li et al. [34] also pointed out that the contents of steranes and terpanes in the Tarim Basin decrease with burial depth. Therefore, in the study of the oil and gas sources of ultra-deep hydrocarbon systems, it is essential to take the impact of thermal maturity on the distribution patterns of biomarkers into consideration.
4. Cambrian crude oil in Well XT-1 originated from source rocks depositing in sulfidic sedimentary environment in the Manxi area
4.1. Distribution patterns and origins of trimethyl aryl isoprenoids (TMAIs)
The previous studies have pointed out that the abundance of TMAIs in marine crude oil in the Tarim Basin is related to the —C-O1 depositional environment rather than the Middle-Late Ordovician slope facies at platform edge [34]. Subsequent research found that the Silurian crude oil in Well TZ-62, which is believed to be from the Cambrian source rocks, contain little TMAIs. This led to the speculation that the TMAIs-rich crude oil was likely from the oil generating peak, and the consumption of TMAIs was influenced by parent material input/depositional environment and thermal maturity [35].
The different distribution patterns of TMAIs in the Cambrian Terreneuvian source rocks of variable lithofacies (Fig. 2 ) demonstrate that the high-quality source rocks at the bottom mainly deposited in sulfidic conditions in the Manxi area. In the crude oil from the weathering crust reservoirs in the lower Qiaolitag Formation of the Upper Cambrian in Well XT-1, entire 2,3,6-TMAIs were detected too, which closely resembles the abundant 2,3,6-TMAIs in the —C1y source rocks at 8 680 m in Well LT-1 (Fig. 5 ). This implies that the Upper Cambrian crude oil in Well XT-1 was more likely generated under anoxic and sulfidic conditions. Furthermore, in Well XT-1, alkyl benzenes extracted from the Cambrian crude oil include entire 2,3,6-TMAIs and alkyl benzenes with similar peak height (Fig. 5 ). This is possibly caused by the different locations of their source rocks. Specifically, the Cambrian crude oil found in Well XT-1 is from the —C1y source rocks at the edge of sulfidic environment, while that in Well LT-1 from the —C1y source rocks that are closer to anoxic and sulfidic depositional center.
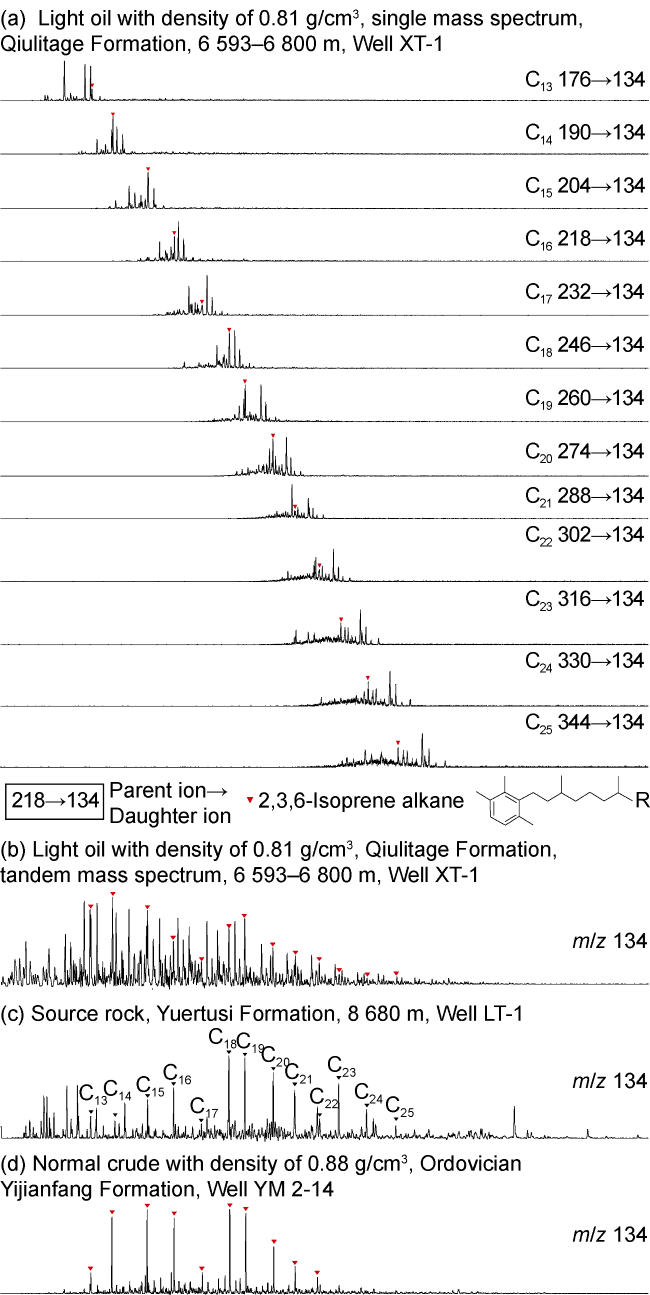
Fig. 5. Single and tandem mass spectra of TMAIs in Cambrian condensate oil from Well XT-1 and single mass spectra of TMAIs in the Ordovician oil from wells LT-1 and YM-2-14. |
4.2. Geochemical characteristics of triaromatic dinosteranes (TAS) and oil-source correlation
At the west of F5, industrial oil and gas flows mainly produced from the Middle-Lower Ordovician source rocks have only been obtained from well block YM-2. Well YD-2, which is located closest to Well XT-1, produced 1.6 m3/d of crude oil from the Lower Ordovician Yingshan Formation. By comparing the biomarkers for the Cambrian light oil from Well XT-1 with the Ordovician oil from wells YM-2-14 and YD-2, it’s found the distribution of the triaromatic steroid series compounds of the two are similar, and they show low contents of C26 triaromatic steroid and 4-methyl triaromatic steroid (Fig. 6 ). Notably, Well YM-2-14 that is closer to the center of the Manxi area display prominently high abundance of TMAIs in the alkyl benzene chromatogram (Fig. 5 ), and show a closer genetic relationship with the —C1y source rocks in Well LT-1, indicating that the Cambrian source rocks in the Manxi area are effective hydrocarbon supplier to the west of F5. Additionally, trace amounts of TAS were detected in the Ordovician oil and gas from Well YD-2 (Fig. 6 ). Given that this area is located within the transition zone between the western edge of Manxi area and the western Awati sag, it is possible that the hydrocarbon products are mixed with a small amount of oil and gas generated from the —C1y source rocks in the siliceous rocks in the western basin.
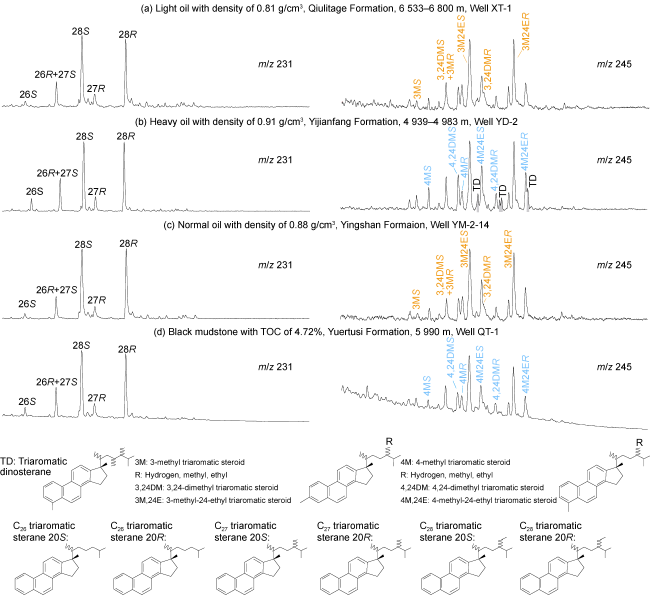
Fig. 6. Biomarkers of triaromatic steroids in crude oil produced from the west of F5 and Cambrian source rocks near well QT-1. |
4.3. Structure and origin of hopane series
In Well XT-1, hopane series (hopanes, abbreviated as HOPs) of Cambrian oil are predominantly composed of regular hopanes and moderately abundant homohopanes, and contain a certain amount of 2α-methyl hopanes and trace gammaceranes. Aside from C29Ts, no other rearranged hopanes were detected (Fig. 7 ). Hopanes are primarily derived from the precursor of bacterial cell membrane known as bacteriohopane tetrol [37], where the ring-D generally form rearranged hopanes through clay catalysis in terrestrial oxidizing environments. The extremely low content of rearranged hopanes demonstrates that the Cambrian crude oil in Well XT-1 is mainly from the source rocks depositing in marine reducing environments. Gammaceranes are almost reduction products of the tetrahymanal from bacteriophagous ciliates. These ciliates typically inhabit the oxidizing-reducing interface. Therefore, gammaceranes often indicate strong reducing potentials and high-salinity stratified water areas. Previous studies on marine oil sources in the Tarim Basin have suggested that the Cambrian crude oil is characterized by a high gammacerane content [36]. There are virtually no gammaceranes detected in the Cambrian crude oil in Well XT-1, which is similar to the low abundance of gammaceranes found in the —C1y source rocks in Well QT-1, but different from the Cambrian source rocks in Well LT-1. This indicates significant variation in the water structure even if the sedimentary environment of the Terreneuvian source rocks is the same. The Cambrian crude oil in Well XT-1 is from the source rocks at the edge of a sulfidic area in the Manxi area.
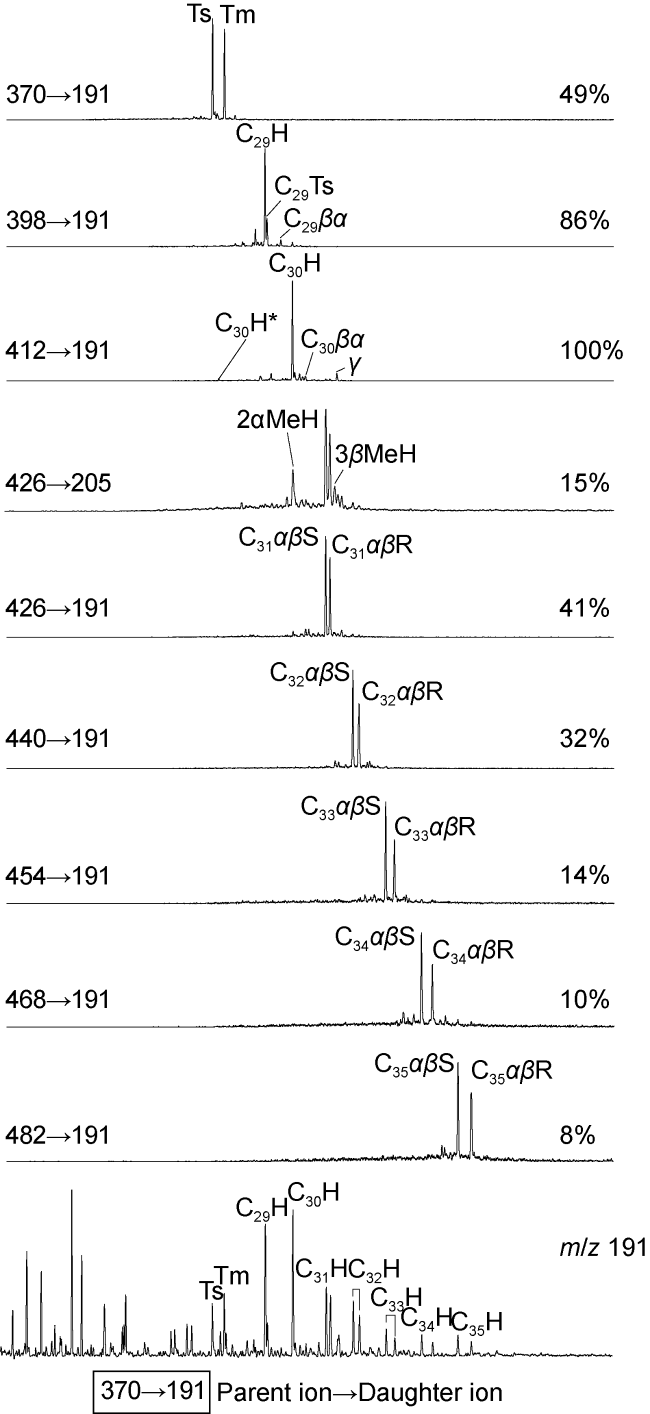
Fig. 7. Biomarkers of hopance series compounds in Lower Qiulitage crude oil from Well XT-1. |
3β-methyl hopanes are primarily produced by methanotrophic bacteria during their steady growth period and typically found associated with archaea and sulfide-oxidizing bacteria, while 2α-methyl hopanes act as the specific biomarker for oxygen-producing cyanobacteria. Summons and Walter [38] first discovered 2α-methyl hopane substituted by methyl on the A/B rings of hopane in some pre-Cambrian crude oil, and detected higher abundance of 2α-methyl hopanes in the crude oil generated from the Proterozoic-Phanerozoic carbonate rocks. In Well XT-1, the 2α-methyl hopane/hopane ratio is only 7%, and the content of 3β-methyl hopanes is even lower, further suggesting that the crude oil is from the marine source rocks depositing in anoxic and sulfidic water where anaerobic conditions have not been ready for active mathanogens.
4.4. Complete tricyclic terpane series and relatively abundant tetracyclic terpanes
The relative abundance distribution of tricyclic terpanes (TT) and C24 tetracyclic terpanes (C24TeT) has been widely used to distinguish terrestrial and marine organic input, identify the genetic relationship between crude oil and source rocks, and decipher the lithology of source rocks [39-41]. Although the biogenetic origin of TTs has not been clarified accurately, the distribution patterns of TTs derived from different types of organic matters exhibit significant differences. Typically, carbonate source rocks have high C22TT/C21TT ratios and low C24TT/C23TT ratios, while marine crude oil generally exhibits higher abundance of C23TT [33]. Therefore, increasing C19TT/C23TT ratios usually reveal terrestrial organic input into coastal marine deltaic shale [42]. The content of C24TeT primarily reflects the difference in the type of organic matter. It is usually rich in terrestrial environments [43] and some carbonate source rocks [44], or may be related to the input of halophilic bacteria [45]. Based on the C19TT/C23TT and C24TeT/C26TT ratios [46] previously reported, two distribution patterns of TTs in marine source rocks are identifiable in the Tarim Basin. Most crude oil displays low abundance of C19TT and C24TeT/C26TT ratio greater than 1.0, indicating that the Ordovician source rocks deposited in marine sedimentary environments. Conversely, some light oil and condensate oil show high abundance of C19TT and C24TeT/C26TT ratio less than 1.0, suggesting possible contribution from high-maturity Cambrian source rocks. The content of C24TeT in the Cambrian crude oil from Well XT-1 is significantly higher than that of C26TT in the Cambrian source rocks in wells QT-1 and LT-1 (Figs. 4 and 8 ). Obviously, it is not an exclusive sign of contribution from the Ordovician source rocks and it is probably related to carbonate source rocks.
Moreover, when studying the distribution patterns of tricyclic terpanes in marine source rocks and crude oil in the Tarim Basin [47], some scholars found that the Ordovician crude oil from wells TZ-52 and TZ-162 reflects a new type of oil source. Particularly, the abnormally high abundance of C24 tetracyclic terpanes suggests the existence of an unknown source rocks with distinctly different characteristics from traditional Cambrian-Ordovician ones. In addition, some other studies found that the distribution patterns of tricyclic and tetracyclic terpanes in the Cambrian end-member oil and the oil of unknown origin may have experienced thermal alteration [46], making them incapable to serve as effective indicators for oil-source correlation. In fact, the carbon number of tricyclic terpanes ranges from C19 to C54 [40,33,48]. Since the tricyclic terpanes with higher carbon numbers have higher thermal stability, they may be used for oil-source correlation in highly mature to overmature stages.
In Well XT-1, complete long-chain tricyclic terpane series (C28-C39TT) of high abundance were detected in the Cambrian crude oil (Fig. 8 ), which is very similar to the —C1y source rocks in Well QT-1 and the Wusongger Formation light oil in Well LT-1 [49], but significantly different from the Ordovician source rocks such as the Lianglitage and the Heituao formations. It further confirmed that the ultra-deep oil and gas in the Tarim Basin are primarily derived from the Cambrian source rocks. The rock with rich Tasmanian algae and salt-lake and marine carbonate rocks at high latitudes show high abundance of tricyclic terpanes, suggesting they may be originated from precursors of algae or organisms living in high-salinity marine carbonate environments [50]. Therefore, long-chain tricyclic terpanes indeed have the function for differentiating the sedimentary environments that hydrocarbon- forming organisms live in. Moreover, studies have found that tricyclic terpanes exhibit higher thermal stability than other terpanes [17,30], resulting in a generally higher content in overmature crude oil. For instance, in Well LT-1, few hopanes were detected in the Cambrian crude oil, but significant distribution of long-chain tricyclic terpanes was observed. In Well XT-1, the Cambrian crude oil is featured by Ts/Tm ratio less than 1.1 (where Ts and Tm represent 18α(H), 17α(H)-22, 29, 30-trisnorhopanes, respectively) and C23TT/C30Hop ratio less than 0.9 (Fig. 8 ), indicating it’s moderately mature, and believed to be originated from marine carbonate source rocks.
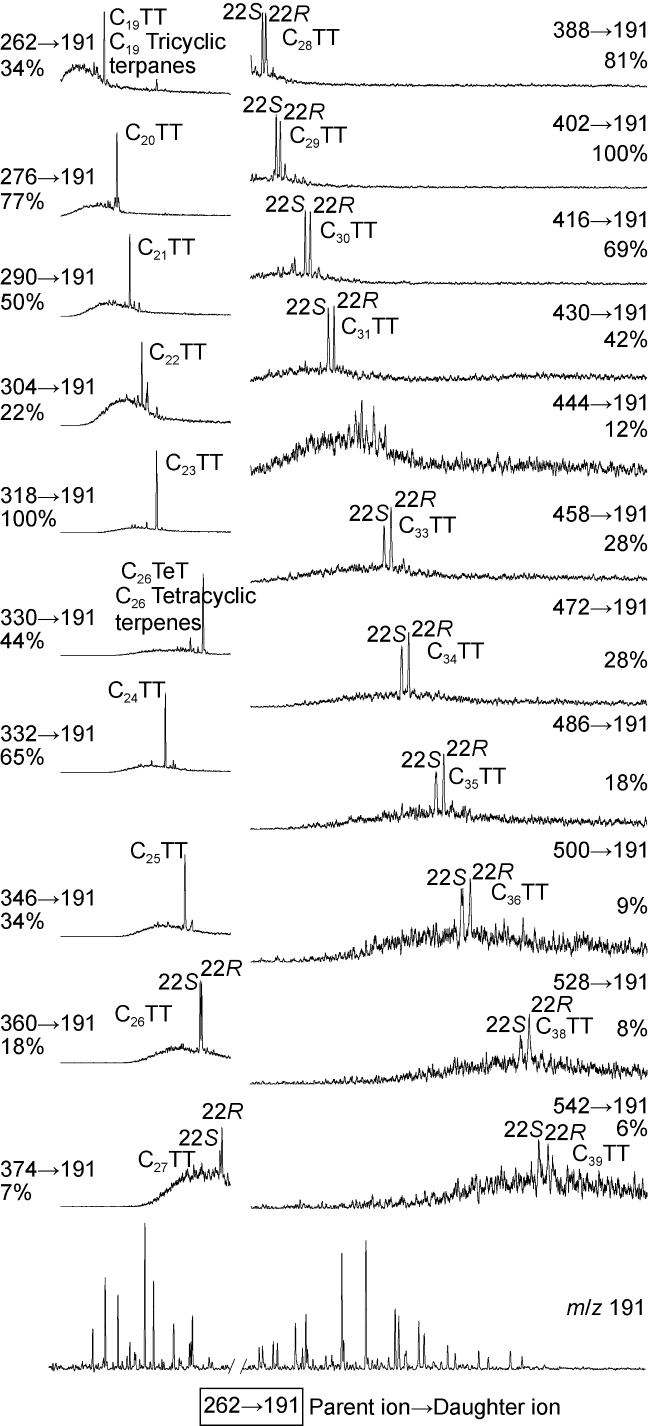
Fig. 8. Biomarkers of tricyclic terpane series compounds in Lower Qiulitage crude oil from Well XT-1. |
4.5. Implications of distribution pattern of steranes for indicating specific biogenic sources
A wide variety of sterols exist in eukaryotes, and their primary function is to maintain the eukaryotes’ internal functional balance and cell signaling. Sedimentary burial and diagenetic processes have largely reduced the diversity of residual sterols, and C27, C28 and C29 steranes are primarily preserved, including cholestanes, ergostanes and stigmastanes, whose differences are reflected by variable side-chain alkyl groups at C-24. Based on the diversity of the three sterane series and the content distribution of molecular fossils, it is possible to recovery the diverse eukaryotes in ancient formations. The biosynthetic process of steranes begins with the epoxidation of squalene [51], followed by enzymatic cyclization into two possible C30 protosterols: lanosterol or cycloartenol. Cycloartenol, in particular, forms C27-C29 sterols through different reaction pathways, which are different from lanosterol, indicating that the biosynthesis of cycloartenol facilitates the appearance of C29 sterols. For C27 cholestane and C28 ergostane, the appearance of C29 sterols in “raft-like” cell membranes can significantly reduce the dependence of the dynamics of cell membrane on temperature. Utilization of 24-ethyl C29 sterol in cell membranes is an evolutionary response to drastic temperature changes.
In Well XT-1, the Cambrian crude oil exhibits a relatively high content of C29 steranes in C27-C29 sterane compounds (Fig. 9 ). It is likely the result of selective evolution that hydrocarbon-generating organisms responded to dramatic environmental changes from the Neoproterozoic to the Cambrian after the Snowball Earth event. The postglacial biosynthetic process of 24-ethyl C29 sterol was first observed only in the Sinian System in the Oman Salt Basin (approximately 600-635 Ma), and then spread globally at around 560-600 Ma, showing a temporal gradient variation. The eukaryotic algae with a stronger adaptive regulation function and producing 24-ethyl C29 sterol may be an important food supply for biological structure evolution in complex environments. The Snowball Earth Event in the Tarim plate did not cease until the late Neoproterozoic. It also contributed to the Early Cambrian paleoclimate that allowed the predominance of C29 steranes to occur.
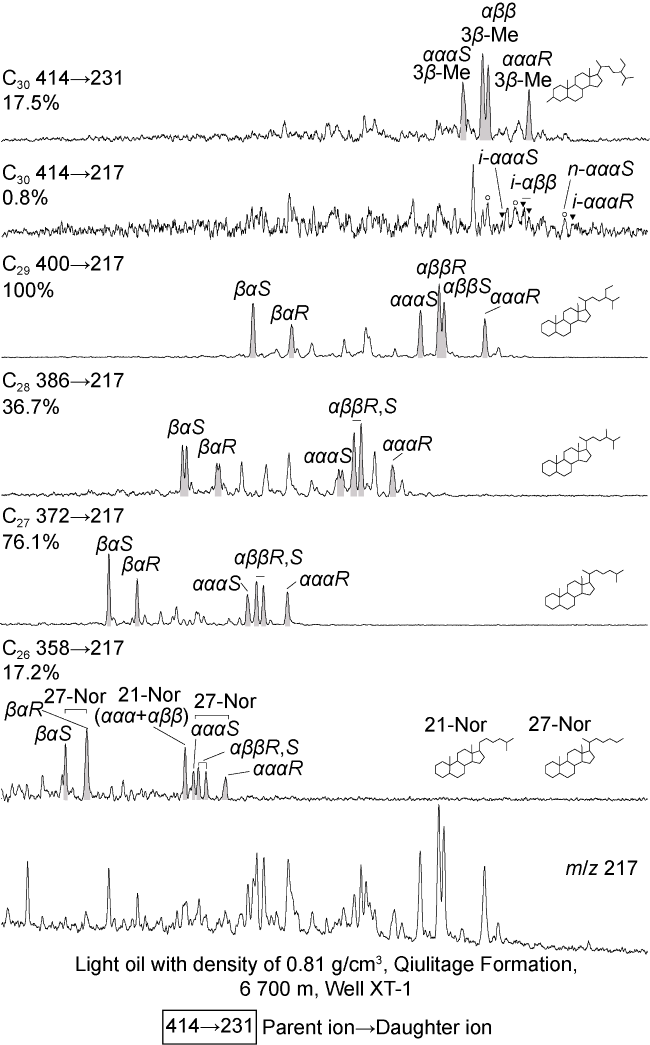
Fig. 9. Biomarkers of sterane series compounds in Lower Qiulitage crude oil from Well XT-1. |
Previous studies suggested that the distribution of C27-C28 regular steranes in the crude oil from the Ordovician source rocks in the Tarim Basin follows the characteristics of “V-shape”, and crude oil from the Cambrian source rocks shows a higher content of C27αααR cholestane than C28 and C29αααR steranes, with C28/C29 generally exceeding 25% [52]. However, the distribution of steranes in the crude oil from Well XT-1 is more consistent with the traditional biomarkers in the Ordovician source rocks. Additionally, according to the research reports on hydropyrolysis simulation experiments, the distribution patterns of steranes in the crude oil from high-maturity source rocks exhibit more distinct predominance of ααα20R than the early crude oil, resulting in an exceptionally higher content of C28ααα20R [53]. Therefore, in the study of ultra-deep marine oil and gas sources, it is essential to take the influence of maturity on the distribution patterns of biomarker compounds into consideration, and pay special attention to use C27-C28 regular steranes as indicators of oil and gas sources.
5. Oil and gas sources and exploration potential of the ultra-deep reservoirs at the west of strike-slip fault F5
5.1. Ultra-deep hydrocarbon source rocks at the west of F5 and accumulation model of Cambrian hydrocarbon in Well XT-1
According to the seismic data constrained by well data and normalized TOC of the source rocks [54], the Manxi hydrocarbon-generating center in the central basin has the highest TOC and the widest distribution of the Cambrian Terreneuvian source rocks. In Well LT-1 located at the northeastern edge of the Manxi area and relatively close to the depositional center of source rocks, the characteristic abundant aryl isoprenoids indicates a sulfidic and anoxic sedimentary environment. In Well QT-1 located at the northern edge of the Manxi area, a less sulfidic and anoxic sedimentary environment was determined. As shown in the thickness and distribution map of the Cambrian Terreneuvian source rocks in the Tarim Basin (Fig. 10 ), some source rocks, the products of anoxic and sulfidic conditions, are distributed in the west of the strike-slip fault F5.
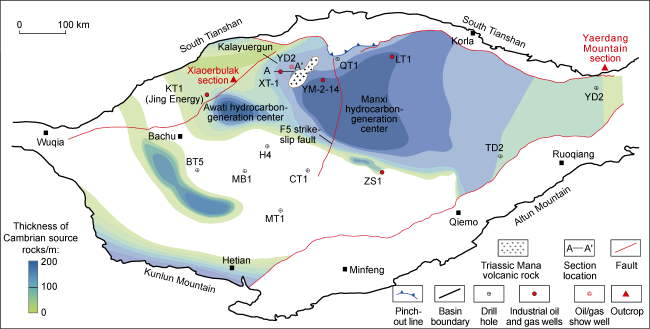
Fig. 10. Thickness and distribution of the Cambrian Terreneuvian source rocks in the Tarim Basin. |
Well XT-1 located at the western edge of the Tabei uplift is bordered by the Karayulgun fault to the west and adjacent to the Yudong block and Mana volcanic rocks to the east. The Karayulgun fault formed a thrust anticline trap during the Late Caledonian period, resulting in the uplift and erosion of the Lower Qiulitage Formation dolomite of the Upper Cambrian and the formation of buried-hill weathering-crust reservoirs. Compression and thrusting continued to intensify during the Late Hercynian period, allowing the Middle-Lower Ordovician to thrust over the Lower Silurian Tataaiertage Formation (S1t). Combined with further enhanced weathering and karst processes, high-quality karst vuggy carbonate reservoirs were ultimately formed (Fig. 11 ).
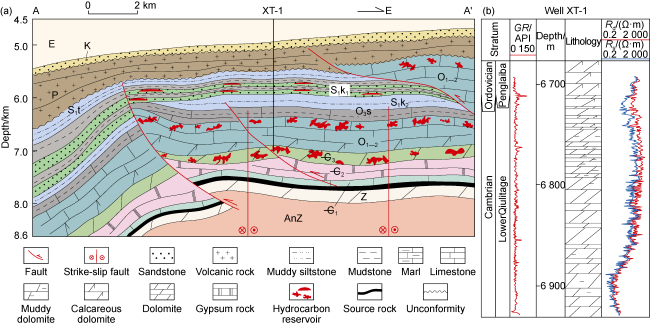
Fig. 11. Geologic section of hydrocarbon accumulation model (a) and stratigraphic column (b) of Lower Quritage Formation of Upper Cambrian in Well XT-1 (section location shown in |
Moreover, in Well XT-1, the Cambrian thrust structure provides an effective channel to allow oil and gas generated by the —C1y source rocks to migrate into the Upper Cambrian weathering karst reservoirs, together with the en echelon strike-slip faults that obliquely intersect with the Karayulgun fault. Compared to the footwall of the thrust fault, hydrocarbon from the —C1y source rocks in the hanging wall migrates a shorter distance upward. The effective hydrocarbon migration pathway ensures high oil production at 249 t/d and high natural gas production at 177 899 m3 from Well XT1 (Fig. 12 ).
Fig. 12. Top burial depth of present Cambrian and relative content distribution of TMAIs in marine reservoirs in the Tarim Basin. |
5.2. Hydrocarbon exploration potential in the west of F5 in the central-western Tabei area
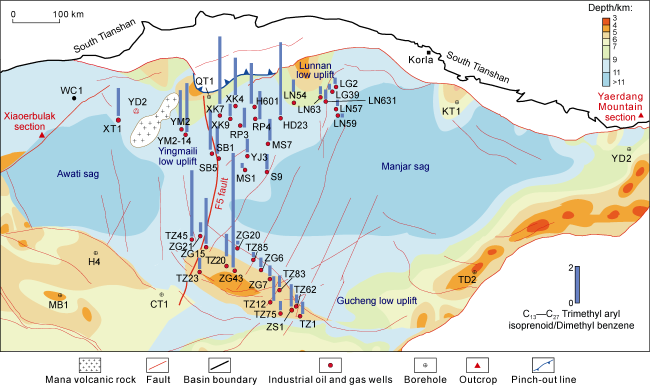
In recent years, continuous discoveries of large-scale oil and gas reservoirs in ultra-deep layers have been achieved during exploring marine oil and gas in the Fuyuan, Shunbei, Manshen, Yuke and Fudong areas in the Tarim Basin [1,2,55]. The ultra-deep reservoirs are primarily distributed in the Manxi area in the east of F5, and oil and gas are enriched in the Middle-Lower Ordovician fractured-porous carbonate reservoirs controlled by the northeast-trending fault-karst system. According to the thickness distribution of the Cambrian Terreneuvian source rocks in the Tarim Basin, the ultra-deep marine reservoirs discovered are located above the thick source rocks with high TOC in the Manxi area, and abundant TMAIs are generally detectable in the crude oil (Fig. 12 ), indicating effective vertical hydrocarbon migration from the deep Terreneuvian source rocks.
Future exploration of ultra-deep marine oil and gas will shift to the east and west of the Manxi area. In the east of the Manxi area, in addition to the reservoirs caused by active strike-slip faults, the Cambrian-Ordovician platform margin zone [56] is favorable for sedimentation-controlled high-energy beach facies reservoirs. The reservoir physical properties show that the gas-to-oil ratio in the Yuke and Fudong areas in the east is generally higher than 2 000 m3/m3, indicating that the over-mature marine hydrocarbon kitchens in the eastern Manjiar sag have the capacity to supply a large amount of gas [57-58]. Therefore, a consensus was reached on the exploration potential of the eastern Manxi area. Well SDTK-1, the first scientific exploration well to penetrate 10 000 m-deep formation deployed by PetroChina in 2023, is precisely designed to explore the oil and gas potential of ultra-deep Cambrian reservoirs in the eastern platform margin. However, marine oil and gas exploration in the west of F5 has not provided economical production capacity. Except for the Ordovician oil and gas reservoirs discovered in wells YM-2 and YD-2, the formation conditions and exploration potential of marine Cambrian reservoirs remain unclear. By analyzing the biomarker compounds of the Upper Cambrian weathering-crust high-yield reservoirs in Well XT-1, the western edge of the Tabei uplift may receive effective hydrocarbon supply from the ultra-deep Cambrian Terreneuvian source rocks in the Manxi area. Furthermore, based on the distribution patterns of TMAIs in the discovered marine reservoirs in the Tarim Basin (Fig. 12 ), reservoirs with high abundance of TMAIs are primarily distributed in the central-western Manxi area, revealing that the hydrocarbon supply from the ultra-deep Cambrian source rocks in the platform-basin area can fully cover the western edge of the Manxi area. Thus, it’s inferred that the west of strike-slip fault F5 has a potential oil source for ultra-deep exploration.
6. Conclusions
The Cambrian Yuertusi Formation (—C1y) in the Shaerbulak section in the northwestern Tarim Basin consists of thin shale layers with high TOC in siliceous rocks, where no trimethyl aryl isoprenoids (TMAIs) but entire triaromatic dinosterane (TAS) series compounds were detected. The —C1y source rocks in the Manxi area, representatively in wells LT-1 and QT-1, are medium-thick calcilutites with abundant TMAIs and moderate TOC, indicating a sedimentary sulfide slope environment. In the Tadong area, medium-TOC, relatively thick siliceous shale source rocks of the Xishanbulak Formation (—C1xs) deposited, where TMAIs are absent, but abundant TASs are detectable. Based on variable biomarkers and lithofacies, the source rocks of Cambrian Terreneuvian Series in the Tarim Basin are deposited in three different sedimentary environments with various types of hydrocarbon-generating parent materials with distinct characteristics.
The compositions of TMAIs and TAS revealed that the biomarkers in the crude oil in Well XT-1 are consistent with the —C1y source rocks in Well Qitan 1, but different markedly from the —C1xs source rocks in the Tadong area. The Cambrian Terreneuvian source rocks of the sulfide slope facies in the Manxi area may be the major contributor to the ultra-deep marine oil and gas in the platform-basin area. Further analysis revealed that the crude oil in Well XT-1 presents the predominance of C29 steranes in C27-C29 sterane series and high abundance of long- chain tricyclic terpanes (up to C39). Thus, C27-C29 steranes can be used to identify Cambrian oil and gas sources and serve as effective indicators to distinguish source rocks such as mudstone and carbonate rock.
According to the analysis of the transport system formed by thrusting and strike-slip faults in the western Tabei area, oil and gas from the sulfide slope source rocks in the Manxi area have favorable geological conditions for migration and accumulation towards the western edge of Tabei uplift. Well XT-1 has unveiled a new exploration zone for the Cambrian buried-hill marine reservoirs in the west of the Tabei uplift, and expanded the exploration of Cambrian marine oil and gas.