

Introduction
Organic matter pores are a crucial component of pore systems in shale reservoirs, and their development degree substantially determines shale petrophysical properties and gas-bearing capacity [1-3]. The thermal evolution of organic matter and hydrocarbon generation-expulsion processes are considered the primary controlling factors in the formation and evolution of pores in organic-rich shales. In numerous high-over mature shales worldwide, solid bitumen formed from the cracking of liquid petroleum commonly develops abundant pores, which are considered as primary carriers of organic matter pore and provide essential storage space for shale gas [2,4 -5]. It is worth noting that the relationship between organic matter maturity and porosity is not a simple linear correlation [6-7]. The formation and evolution of pores during the thermal evolution of different types of organic matter vary significantly. Additionally, the content organic matter and its spatial configuration with mineral framework also influence the development and preservation of organic matter pores, where brittle mineral frameworks can provide favorable support conditions for organic matter pore development [8-9].
Dispersed organic matter comprises multiple maceral components with distinct hydrocarbon generation and pore evolution pathways in shales. The key to understanding organic matter pore evolution lies in precisely characterizing chemical composition and structure variations of different macerals during evolution and their coupling relationships with pore formation, which fundamentally involves the response relationship between organic matter pore development and functional groups. Over the past few decades, significant progress has been made in the analysis of organic matter molecular structures through techniques such as elemental analysis, nuclear magnetic resonance (NMR), Fourier transform infrared microscopy (FTIR), X-ray photoelectron spectroscopy (XPS), thermal degradation, and chemical degradation methods [10-17]. These methods have provided valuable insights into the overall molecular structure of organic matter. With continuous advancements in technology, emerging analytical techniques, especially in-situ spectroscopy, have enabled higher spatial resolution for analyzing the molecular functional groups and structures of dispersed organic matter, offering new perspectives for characterizing its heterogeneity at the microscopic scale[3,18 -27]. The development of nanoscale infrared spectroscopy methods, particularly atomic force microscopy-based infrared spectroscopy (AFM-IR), has broken the optical diffraction limit to achieve spatial resolutions up to ~10 nm, enabling unprecedented characterization of molecular functional groups in organic and inorganic materials [3,19 -21,26 -29]. The sub-micron resolution of AFM-IR allows detection of functional group variations in dispersed organic matter during thermal evolution [3,19]. For example, Yang et al. [3] applied this method to analyze the chemical and mechanical heterogeneity of different organic matter types at the micro- to nanoscale in the Devonian-Lower Mississippian New Albany Shale of the Illinois Basin. Their study advanced the understanding of dispersed organic matter heterogeneity in shale and established the foundations for investigating the relationship between organic matter functional groups and pore development.
The Upper Ordovician Wufeng Formation to Lower Silurian Longmaxi Formation in the Sichuan Basin and its periphery serve as the primary shale gas production layers [30-31], yielding over 250×108 m3 in 2024, with organic pores providing the main storage space [32]. To clarify the response of organic matter pore development to functional groups in overmature marine shale, this study focuses on Longmaxi Formation shales in the Sichuan Basin using AFM-IR technology for submicron-scale molecular functional group analysis of organic matter with different types and maturity levels, integrating with pore development characteristics to explore their interrelationships. The findings provide molecular-level theoretical insights for understanding organic matter evolution pathways and organic pore development mechanisms.
1. Experimental samples and methods
The four representative shale samples were collected from three Longmaxi Formation coring wells (W1, Y1, and N1) located in the Weiyuan, Changning, and Luzhou areas of the Sichuan Basin. The total organic carbon (TOC) content was measured using a LECO CS 744 analyzer. For pore characterization, shale samples were cut into rectangular blocks (1.0 cm × 1.0 cm × 0.5 cm), and the cross-sections perpendicular to the bedding planes were polished using argon ion milling. Pore types and morphology were analyzed using a Zeiss Crossbeam 550 focused ion beam-scanning electron microscope (FIB-SEM) at 5 nm resolution in secondary electron detection mode. For organic petrography, samples were embedded in cold-cured epoxy resin within a 2 cm × 2 cm × 2 cm mold. Bedding-perpendicular surfaces were ground and polished using a Buehler EcoMet/AutoMet 250 automated grinder-polisher with alumina suspension. Organic petrology analysis was conducted on whole-rock thin sections and SEM samples after argon ion polishing using a Leica DM4500P polarizing microscope equipped with a 50× oil-immersion objective and MSP200 photometer. The random reflectance of maceral components was measured.
The selected typical organic matter regions identified through petrographic analysis were subjected to nanoscale infrared spectroscopy using a NanoIR2 system (Bruker) integrating atomic force microscopy (AFM) and infrared spectroscopy. The AFM-IR technique integrates a pulsed tunable infrared (IR) source with atomic force microscopy (AFM). IR laser pulses irradiate the sample surface, where absorbed radiation induces localized thermal expansion. This thermal expansion excites oscillations in the AFM probe, and the infrared absorption intensity is derived by monitoring the oscillation amplitude. The IR source produced by a tunable optical parametric oscillator laser system (EKSPLA), with ~10 ns pulse length at a repetition rate of 1 kHz, and covers a broad mid-infrared spectral range. Using a probe (Model: PR-EX-NIR2, Analysis Instruments) with a resonant frequency of (13±4) kHz and spring constant of 0.07-0.40 N/m to measure the photothermally induced resonance of the AFM cantilever. A bandpass filter centered at 180 kHz with a 50 kHz window width was applied to cantilever oscillation mode. Images were acquired at a scan rate of 0.2 Hz with 8-pulse averaging in contact mode, achieving a spatial resolution of 100 nm × 100 nm.
The precise localization of target organic matter was achieved by correlating AFM-derived surface topography images with corresponding SEM images of the same regions. After identifying the target measurement positions, the infrared (IR) system was connected using a probe equipped with an integrated IR sensor. Prior to data collection, the IR laser beam was optimized at 1 450, 1 600 and 1 720 cm-1. Localized IR spectra were collected and analyzed using Analysis Studio and Origin software. IR spectra were acquired across the 1 000-1 900 cm-1 range with an interval of 4 cm-1 and averaging each data point over 256 pulses. Spectral processing was first conducted in Analysis Studio for smoothing, followed by linear baseline correction and normalization in Origin software. The absorption bands in the infrared spectra ranging from 1 400 cm-1 to 1 800 cm-1 were deconvoluted using Gaussian-Lorentzian functions. Spectral parameters were determined by fitting the parameters to the experimental envelope through an iterative least-squares optimization process. During the fitting, all parameters, including peak center, amplitude, half peak breadth, and relative fraction of Lorentzian character, were allowed to deviate from initial estimated values.
2. Results
2.1. Total organic carbon, maturity, and dispersed organic matter type
Based on organic petrographic observations and maturity estimation of the four siliceous shale samples, the dispersed organic matter in the Longmaxi Formation shales can be classified into two primary types: pyrobitumen and graptolite periderms, with pyrobitumen being the predominant type. The TOC content, bitumen reflectance (BRo), and graptolite reflectance (GRo) values are summarized in Table 1 .
Table 1. Organic petrographic characteristics of overmature shale samples from the Longmaxi Formation, Sichuan Basin |
| Well | Depth/ m | Sample ID | TOC/ % | BRo/ % | GRo/ % |
|---|---|---|---|---|---|
| W1 | 3 742.00 | W1-1 | 1.83 | 2.42 | 2.68 |
| W1 | 3 743.26 | W1-2 | 5.03 | 2.45 | 2.62 |
| Y1 | 4 145.55 | Y1 | 4.31 | 3.42 | 3.22 |
| N1 | 3 591.84 | N1 | 3.16 | 3.69 | 3.69 |
Graptolite periderms are commonly observed in the Longmaxi Formation shales. Luo et al. [33] further classified these periderms into granular and non-granular types based on morphological characteristics. The Longmaxi shales are predominantly composed of non-granular periderms, which occur as fragmented or lenticular particles dispersed within the mineral matrix, exhibiting distinct segmentation features (Figs. 1 -3 ). Framboidal pyrite commonly infills graptolite periderms (Fig. 2b ). In addition, SEM reveals well-preserved fusellar structures in fragmented graptolite periderms (Fig. 3b ).
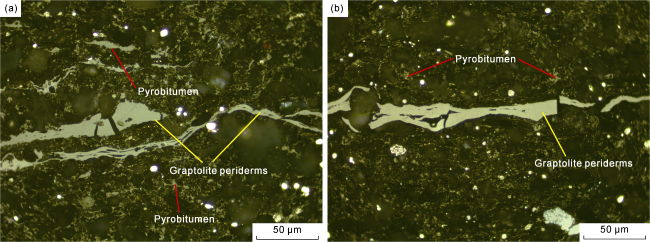
Fig. 1. Characteristics of graptolite periderms and pyrobitumen under oil-immersion microscopy in the Longmaxi Formation shales, Sichuan Basin. (a) Well W1, Sample W1-1, 3 742.00 m; (b) Well Y1, Sample Y1, 4 145.55 m. |
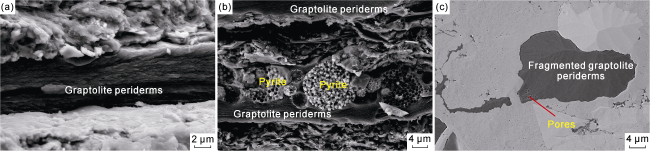
Fig. 2. SEM images of graptolite periderms in Longmaxi shales, Sichuan Basin (Well W1, Sample W1-1, 3 742.00 m). (a) Graptolite periderms distributed along bedding planes, fresh rock cross-section; (b) Framboidal pyrite infilling within non-granular graptolite periderms, fresh rock cross-section; (c) Fragmented graptolite periderms with local pores, polished surface. |
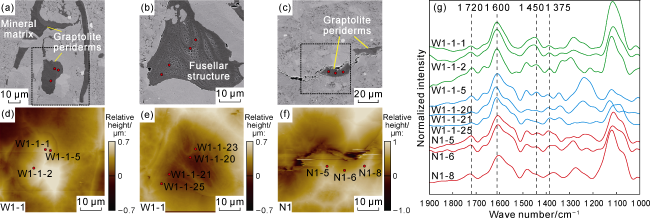
Fig. 3. SEM images, surface morphology, and AFM-IR spectra of graptolite periderms in the Longmaxi Formation shales, Sichuan Basin (red dots indicate AFM-IR single-point test locations). (a) SEM image of fragmented graptolite periderms, Sample W1-1, Well W1, 3 742.00 m; (b) SEM image of fragmented graptolite periderms showing fusellar structure, with alternating layers of pore-rich and pore-poor regions, Sample W1-1, Well W1, 3 742.00 m; (c) SEM image of graptolite periderms, Sample N1, Well N1, 3 591.84 m; (d) Morphology of the area marked by the dashed box in |
Pyrobitumen classified as a secondary maceral originates from the thermal maturation of oil-prone organic matter [6]. The identification of pyrobitumen in the Longmaxi Formation shales is based on optical characteristics combined with the vitrinite reflectance (Ro=1.5%) proposed by Mastalerz et al. [7] to distinguish it from solid bitumen (a distinction often challenging under conventional analytical conditions [34-36]). Under oil-immersion reflected light, pyrobitumen typically displays light gray hues and primarily occupies interparticle or intraparticle positions (Fig. 1 ). SEM analysis further identifies two primary pore-filling forms of pyrobitumen in the Longmaxi shales: homogeneous and clay mineral-composite types (Figs. 4 , 5 ). Homogeneous pyrobitumen exhibits minimal mineral incorporation, while pyrobitumen-clay composites host diverse clay minerals dominated by illite with distinct morphologies.
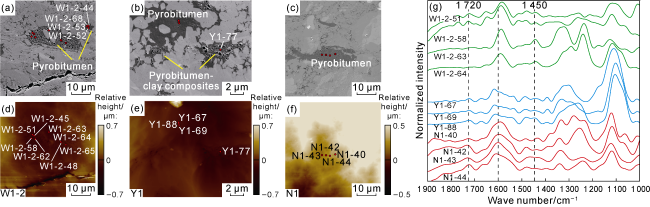
Fig. 4. SEM images, surface morphology, and AFM-IR spectra of homogeneous pyrobitumen in the Longmaxi Formation shales, Sichuan Basin (red dots indicate AFM-IR single-point test locations). (a) Extremely porous region, Sample W1-2, Well W1, 3 743.26 m, SEM; (b) Coexistence of homogeneous pyrobitumen and pyrobitumen-clay composites, with poorly developed pores in homogeneous pyrobitumen, Sample Y1, Well Y1, 4 145.55 m, SEM; (c) Poorly developed pores, Sample N1, Well N1, 3 591.84 m, SEM; (d) Surface morphology of the corresponding area in |
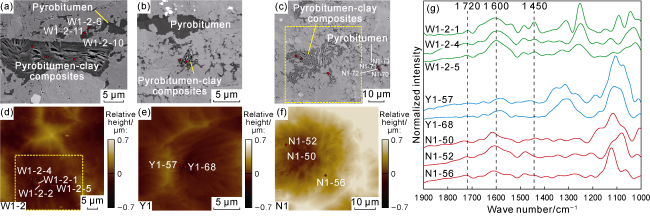
Fig. 5. SEM images, surface morphology, and AFM-IR spectra of pyrobitumen-clay composites in the Longmaxi Formation shales, Sichuan Basin (red dots indicate AFM-IR single-point test locations). (a) Fracture-shaped pores developed along the edges of flake-shaped clay minerals, Sample W1-2, Well W1, 3 743.26 m, SEM; (b) Pyrobitumen-clay composites with highly developed pores, Sample Y1, Well Y1, 4 145.55 m, SEM; (c) Highly porous region, Sample N1, Well N1, 3 591.84 m, SEM; (d) Surface morphology of the sample, Sample W1-2, with the dashed box corresponding to |
2.2. Molecular functional group characterization of dispersed organic matter via AFM-IR spectroscopy
AFM-IR spectroscopy was employed to acquire spatially resolved single-point infrared spectra from individual graptolite periderms and pyrobitumen particles across the 1 000-1 900 cm-1 frequency range, which covers the mid-infrared region with specific information on molecular vibrational modes (Figs. 3-5). In conventional infrared and Fourier transform infrared microspectroscopy (μ-FTIR), the absorption at 1 375 cm-1 primarily corresponds to symmetric C-H bending vibrations of methyl (CH3) groups, while the 1 450 cm-1 is attributed to asymmetric C-H bending vibrations of methylene (CH2) groups. Peaks within the 1 500-1 800 cm-1 range originate from non-resonant carbonyl (C=O) groups, including phenolic hydroxyl and aromatic aldehyde moieties, as well as aromatic C=C stretching vibrations at 1 600 cm-1. Similarly, AFM-IR absorption bands exhibit analogous correlations with specific molecular functional groups. In this study, asymmetric C-H bending of CH2 (~1 450 cm-1), aromatic C=C stretching (~1 600 cm-1), and C=O stretching of carboxyl/carbonyl groups (~1 720 cm-1) were identified (Figs. 3g, 4g and 5g).
The AFM-IR spectra of graptolite periderms and pyrobitumen in the Longmaxi Formation shales exhibit stronger absorption peaks within 1 000-1 200 cm-1 (Fig. 3g ), which is also observed in previous in situ infrared spectroscopic studies of organic matter [18,20,26 -27]. Abarghani et al. [18] identified absorption peaks in the the range of 950-1 200 cm-1 during AFM-IR analysis of bituminized Tasmanites algae, structured algae, and solid bitumen from low-mature and mature source rock samples of the Bakken Formation in the Williston Basin, North America. These peaks were interpreted as S=O stretching vibrations of sulfur oxides and C-O stretching vibrations of alcohols and aliphatic ethers, based on traditional infrared spectral band assignments by Painter et al. [16] and Chen et al. [11]. Phan et al. [26] attributed the absorption peaks at 1 040 cm-1 and 1 050 cm-1 to Si-O stretching vibrations of silicate minerals and sulfide mineral signals, respectively, based on AFM-IR analysis of molecular structures in mature (Ro=1.16%) and overmature (Ro=2.80%) coals from Pennsylvania, USA. They further validated these assignments by analyzing pure silicate minerals, identifying absorption peaks for kaolinite at 1 095 cm-1 and 1 040 cm-1, illite at 1 030 cm-1, and quartz at 1 060 cm-1 (broad peak). In general, clay minerals (illite and kaolinite) exhibit absorption peaks in 1 000-1 150 cm-1 and ~900 cm-1, carbonate minerals show peaks at 1 430-1 440 cm-1 and ~880 cm-1, quartz displays peaks at 1 050-1 100 cm-1 and 780-800 cm-1, and pyrite exhibits peaks in 1 000-1 150 cm-1 [10-11].
The Longmaxi Formation shales are a mixture of silicate minerals, carbonate minerals, pyrite, and organic matter. In three-dimensional space, there is a possibility of various minerals existing beneath the organic matter detection points, which may introduce mineral-related signals. Consequently, the absorption peaks in 1 000-1 200 cm-1 of the AFM-IR spectra are primarily attributed to mineral-related vibrations. In practice, the infrared spectra in 1 000-1 400 cm-1 exhibit multiple broad and overlapping absorption bands [37-38]. Only the methyl bending vibration at 1 375 cm-1 displays a clear and distinct feature, while the others are highly mixed and coupled vibrations. This absorption band belongs to ether compounds in some studies. However, for organic matter samples, spectral assignments in this region are complex and often cannot be attributed to specific functional groups. Vibrations in this band include C-O stretching, C-C stretching, O-H bending, and C-H bending vibrations, as well as mineral-related Si-O vibrations [16]. Neighboring vibrational energy levels with the same symmetry properties can mix, causing each mode to exhibit characteristics of other modes, and mechanical coupling is also possible [16]. Therefore, this spectral region cannot be described by simple motions of specific functional groups or chemical bonds.
The AFM-IR spectra of graptolite periderms in the Longmaxi Formation shales are dominated by aromatic C=C stretching vibrations at ~1 600 cm-1, a stable absorption peak observed across all samples with minimal variation within individual periderm particles (Fig. 3g ). Weak peaks near 1 720 cm-1, 1 375 cm-1, and 1 450 cm-1, corresponding to carbonyl/carboxyl and aliphatic functional groups, are also present (Fig. 3g ), indicating that graptolite periderms are primarily composed of aromatic groups with minor aliphatic and carbonyl/carboxyl components. Additionally, a faint absorption peak at ~1 490 cm-1 is observed, which in traditional infrared spectra of coal represents aromatic ring stretching vibrations [16]. The AFM-IR spectral characteristics of graptolite periderms in the Longmaxi shales are consistent with the molecular chemical composition of graptolite periderms in Silurian Baltic shales from the Baltic Basin, as studied by Morga and Kamińska [39] using micro-FTIR spectroscopy.
Pyrobitumen in the Longmaxi Formation shales also consistently exhibits an absorption peak at ~1 600 cm-1, corresponding to the stretching vibrations of conjugated double bonds in aromatic compounds. The absorption peaks at ~1 720 cm-1 (carboxyl/carbonyl groups) show some variations among samples but are generally weak in intensity. Similarly, the methylene absorption peak at ~1 450 cm-1 is present but exhibits weak and variable intensity across samples (Figs. 4g, 5g). These observations indicate that pyrobitumen is primarily composed of aromatic groups with minor aliphatic and carbonyl/carboxyl components. Compared to AFM-IR spectra of solid bitumen from the Middle Devonian-Lower Mississippian New Albany Shale in the Illinois Basin (BRo=0.25%-1.17%) and the Eagle Ford Shale in South Texas (BRo=0.40%-2.10%), pyrobitumen in the overmature Longmaxi shales shows significantly lower intensities for the methylene peak at 1 450 cm-1 and the carboxyl/carbonyl peak at ~1 720 cm-1, primarily due to the higher thermal maturity[3,20].
2.3. Organic matter pores
Graptolite periderms rarely develop pores (Fig. 2 ), but locally exhibit well-developed biogenic tissue pores in the Longmaxi Formation shales (Fig. 3b ). These pores typically exhibit a honeycomb-like or dispersed distribution, with diameters ranging from 20 nm to 160 nm. Layers with poorly developed pores alternate with those exhibiting high porosity (Fig. 3b ), corresponding to loose granular structures and relatively dense fibrous structures within the fusellar tissue. This structural arrangement can be observed as fusellar structures under fluorescence microscopy [40].
Pyrobitumen serves as the primary host for organic matter pore development, with variations in pore size and morphology observed among different types and thermal maturity levels of pyrobitumen (Figs. 6 -8 ). In the shale samples from Well W1, homogeneous pyrobitumen predominantly exhibits pores with diameters below 20 nm (Fig. 6c ), with particle areal porosity ranging from 9.6% to 28.2% (Table 2 ). The incorporation of clay minerals alters pore morphology, leading to the formation of fracture-like pores along the edges of sheet-like clay minerals (Fig. 7a ). Similarly, homogeneous pyrobitumen in the shale samples from Well Y1 are dominated by pores smaller than 20 nm (Fig. 6f ), with particle areal porosity ranging from 4.2% to 10.1% (Table 2 ). The pore size characteristics of homogeneous pyrobitumen in the shale samples from Well N1 are comparable to those in Well Y1 (Fig. 6g-6i ). Pyrobitumen-clay composites exhibit significantly higher pore development than homogeneous pyrobitumen, with areal porosity ranging from 16.0% to 17.6% (Table 2 ) and larger pore sizes. Clay minerals further modify pore morphology, with fracture-type pores in the shale samples from Well N1 reaching micrometer-scale lengths, resulting in pores larger than 100 nm dominating the pore system (Fig. 7g-7i ).
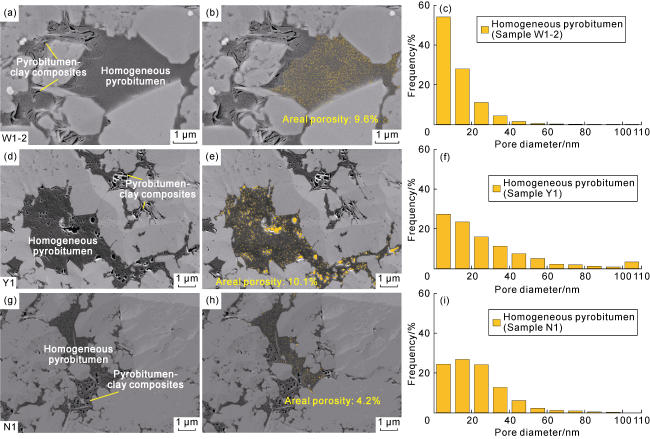
Fig. 6. Pore and pore size development characteristics of typical homogeneous pyrobitumen in the Longmaxi Formation shales, Sichuan Basin (the yellow zones are pores). (a) Homogeneous pyrobitumen and pyrobitumen-clay composites with moderately developed pores, Sample W1-2, Well W1, 3 743.26 m, SEM; (b) Extracted image of pores within homogeneous pyrobitumen particles in |
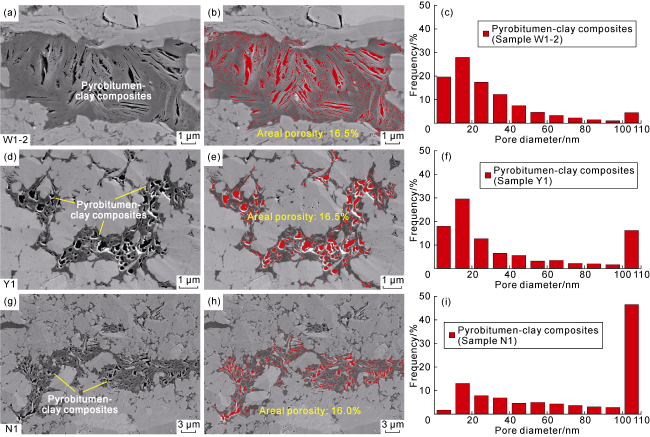
Fig. 7. Pore and pore size development characteristics of typical Pyrobitumen-clay composites in the Longmaxi Formation shales, Sichuan Basin (the red zones are pores). (a) Pyrobitumen-clay composites with fracture-like pores along clay edges, SEM, Sample W1-2, Well W1, 3 743.26 m; (b) Extracted image of pores within pyrobitumen-clay composite particles in |
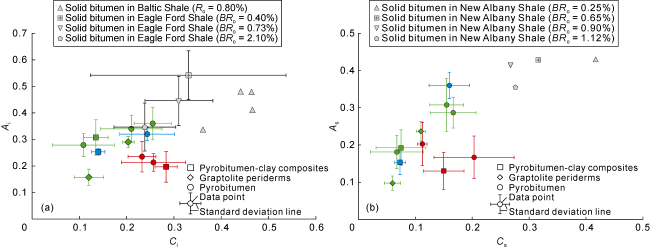
Fig. 8. Distribution characteristics of A-factor and C-factor for different organic matter types in the Longmaxi Shale, Sichuan Basin (Green: Well W1; Blue: Well Y1; Red: Well N1; Solid bitumen data of Baltic and Eagle Ford Shales are from Reference [27]; those of New Albany Shales are from Reference [3]). |
Table 2. AFM-IR spectral parameters and pore development characteristics of typical organic matter in the Longmaxi Formation shales |
| Well | Depth/m | Test point ID | Maceral | Ai-factor | Ci-factor | As-factor | Cs-factor | Pore development characteristics |
|---|---|---|---|---|---|---|---|---|
| W1 | 3 742.00 | W1-1-1 | Graptolite periderms | 0.31 | 0.22 | 0.26 | 0.12 | Fewer pores, |
| W1-1-2 | 0.30 | 0.19 | 0.25 | 0.10 | ||||
| W1-1-5 | 0.26 | 0.20 | 0.20 | 0.11 | ||||
| W1-1-20 | Graptolite periderms | 0.20 | 0.14 | 0.12 | 0.06 | More pores with an areal porosity of 8.5%, | ||
| W1-1-21 | 0.14 | 0.12 | 0.07 | 0.06 | ||||
| W1-1-23 | 0.17 | 0.15 | 0.09 | 0.08 | ||||
| W1-1-25 | 0.12 | 0.07 | 0.11 | 0.04 | ||||
| W1 | 3 743.26 | W1-2-45 | Homogeneous pyrobitumen | 0.34 | 0.18 | 0.23 | 0.12 | Extremely developed pores with lager pore diameter and an areal porosity of 28.2%, |
| W1-2-48 | 0.31 | 0.12 | 0.21 | 0.09 | ||||
| W1-2-51 | 0.25 | 0.20 | 0.19 | 0.14 | ||||
| W1-2-58 | 0.19 | 0.18 | 0.11 | 0.09 | ||||
| W1-2-62 | 0.27 | 0.03 | 0.15 | 0.01 | ||||
| W1-2-63 | 0.30 | 0.05 | 0.15 | 0.02 | ||||
| W1-2-64 | 0.31 | 0.06 | 0.25 | 0.02 | ||||
| W1-2-65 | 0.26 | 0.05 | 0.16 | 0.05 | ||||
| W1-2-44 | Homogeneous pyrobitumen | 0.45 | 0.32 | 0.31 | 0.15 | More pores with small pore diameter and an areal porosity of 9.5%, | ||
| W1-2-52 | 0.37 | 0.25 | 0.40 | 0.19 | ||||
| W1-2-53 | 0.28 | 0.22 | 0.20 | 0.11 | ||||
| W1-2-68 | 0.34 | 0.23 | 0.32 | 0.17 | ||||
| W1-2-6 | Homogeneous pyrobitumen | 0.27 | 0.18 | 0.28 | 0.20 | More pores with small pore diameter and an areal porosity of 9.6%, | ||
| W1-2-10 | 0.36 | 0.30 | 0.34 | 0.19 | ||||
| W1-2-11 | 0.39 | 0.15 | 0.24 | 0.11 | ||||
| W1-2-1 | Pyrobitumen-clay composites | 0.42 | 0.16 | 0.25 | 0.06 | Highly developed pores with small pore diameter and micro-fractures associated with clay minerals, an areal porosity of 16.05%, | ||
| W1-2-2 | 0.27 | 0.16 | 0.23 | 0.15 | ||||
| W1-2-4 | 0.29 | 0.12 | 0.15 | 0.05 | ||||
| W1-2-5 | 0.25 | 0.10 | 0.14 | 0.04 | ||||
| Y1-67 | Homogeneous pyrobitumen | 0.29 | 0.23 | 0.38 | 0.19 | Poorly developed pores with non-uniform pore diameter and an areal porosity of 4.2%, | ||
| Y1-69 | 0.32 | 0.32 | 0.39 | 0.18 | ||||
| Y1-88 | 0.35 | 0.18 | 0.31 | 0.11 | ||||
| Y1 | 4 145.55 | Y1-68 | Pyrobitumen-clay composites | 0.25 | 0.15 | 0.13 | 0.08 | Highly developed pores with large pore diameter and areal porosity of 16.3% and17.6%, Figs. 4b, 5b |
| Y1-57 | 0.24 | 0.15 | 0.13 | 0.08 | ||||
| Y1-77 | 0.27 | 0.12 | 0.20 | 0.06 | ||||
| N1-40 | Homogeneous pyrobitumen | 0.25 | 0.23 | 0.24 | 0.28 | Poorly developed pores with small pore diameter and an areal porosity of 4.8%, | ||
| N1-42 | 0.17 | 0.35 | 0.10 | 0.22 | ||||
| N1-43 | 0.22 | 0.19 | 0.16 | 0.11 | ||||
| N1 | 3 591.84 | N1-70 | Homogeneous pyrobitumen | 0.23 | 0.22 | 0.18 | 0.11 | More pores with large pore diameter and an areal porosity of 13.4%, |
| N1-71 | 0.20 | 0.20 | 0.21 | 0.10 | ||||
| N1-72 | 0.18 | 0.23 | 0.13 | 0.12 | ||||
| N1-73 | 0.33 | 0.28 | 0.29 | 0.12 | ||||
| N1-50 | Pyrobitumen-clay composites | 0.13 | 0.30 | 0.09 | 0.12 | Highly developed pores with large pore diameter and an areal porosity of 16.2%, | ||
| N1-52 | 0.19 | 0.25 | 0.10 | 0.13 | ||||
| N1-56 | 0.27 | 0.30 | 0.20 | 0.20 |
3. Discussion
3.1. Relationship between organic molecular functional groups and organic pore development
Ganz and Kalkreuth [41] defined the A-factor and C-factor based on infrared absorption peaks at 2 860 cm-1 and 2 930 cm-1 (representing aliphatic CH2 and CH3 groups), 1 710 cm-1 (representing carboxyl/carbonyl groups), and 1 630 cm-1 (representing aromatic C=C bonds). The A-factor is the ratio of the sum of peak intensities at 2 860 cm-1 and 2 930 cm-1 to the sum of peak intensities at 1 630, 2 860 and 2 930 cm-1, while the C-factor is the ratio of the peak intensity at 1 710 cm-1 to the sum of peak intensities at 1 630 cm-1 and 1 710 cm-1. These factors quantitatively assess the abundance of aliphatic and carboxyl/carbonyl groups, serving as alternative indicators to the hydrogen-to-carbon (H/C) and oxygen-to- carbon (O/C) ratios in traditional Van Krevelen diagrams for interpreting kerogen types and maturation trends [15]. Due to limited infrared frequency range, spectra at 2 800-4 000 cm-1 were unavailable. Thus, A and C factors were calculated using Eqs. (1)-(4), based on peak intensity and fitted peak area ratios [3,20,26 -27].
$ A_{\mathrm{i}}=\frac{I_{1450}}{I_{1450}+I_{1600}}$
$ C_{\mathrm{i}}=\frac{I_{1720}}{I_{1720}+I_{1600}}$
$ A_{\mathrm{s}}=\frac{S_{1450}}{S_{1450}+S_{1600}}$
$ C_{\mathrm{s}}=\frac{S_{1720}}{S_{1720}+S_{1600}}$
Organic matter maturity is the most critical factor controlling organic pore development, but even at the same maturity level, the degree of organic pore development varies primarily due to differences in organic matter type, which should be reflected in molecular structures. Studies reveal that within the same sample from Well W1, graptolite periderms with more pores exhibit lower A-factor and C-factor compared to those with fewer pores (Table 2 ). Graptolite periderms consist of an inner fusellar layer and an outer cortical layer [42]. The fusellar layer is the primary layer of the graptolite, composed of loose granular and dense fibrous structures [43-44]. The cortical structure, composition and texture of the graptolite periderms resemble collagen, suggesting collagen-like original components [45]. Xi et al. [46] conducted pyrolysis experiments on low-to-medium mature graptolite fragments from Chengkou, Chongqing, showing gaseous hydrocarbon generation, pore expansion, and new pore formation during oil and gas generation stages with high temperature, likely due to the detachment of aliphatic chains and oxygen-containing functional groups, explaining lower A-factor and C-factor in inner pore-rich fusellar layers than the outer cortical layer (Fig. 3b ).
AFM-IR spectral parameters of pyrobitumen in different occurrence states show significant variations, with corresponding differences in pore development responses (Table 2 , Fig. 8 ). In W1-2 shale samples, homogeneous pyrobitumen with highly developed organic pores (areal porosity of 28.2%) exhibits the lowest A-factor and C-factor, with As-factor ranging from 0.11 to 0.25 (avg. 0.18) and Cs-factor ranging from 0.01 to 0.14 (avg. 0.07). In contrast, homogeneous pyrobitumen with moderately developed pores (areal porosity of 9.5%) shows the highest As-factor (0.20-0.40, avg. 0.31) and relatively higher Cs-factor (0.11-0.19, avg. 0.16). Pyrobitumen-clay composites exhibit intermediate areal porosity, A-factor and C-factor. Similar trends are observed in N1 shale samples, where homogeneous pyrobitumen with lower areal porosity has higher A-factor and C-factor compared to pyrobitumen-clay composites with higher areal porosity. Overall, AFM-IR spectral parameters in shale samples of same maturity correlate well with areal porosity: lower A and C factors correspond to better-developed organic matter pores and higher areal porosity, with smaller standard deviations in As-factor and Cs-factor for measurements at different locations within same organic matter particle (Fig. 8 ). Additionally, overlapping of multiple peaks in infrared spectra means that a peak at a specific wave number may result from superposition of nearby peaks. Therefore, A-factor and C-factor calculated using peak areas are more representative.
Solid bitumen serves as the primary host for organic pore development and can be further classified into pre-oil bitumen (low maturity to early oil generation stage), post-oil bitumen (peak hydrocarbon generation to late oil generation stage), and pyrobitumen (high maturity stage) [35,47 -48]. Pyrobitumen forms through secondary cracking of residual hydrocarbons and solid bitumen[49-50], with its molecular composition controlled by precursor molecular structures and evolutionary processes. Experimental studies show that solid bitumen (pyrobitumen) formed by secondary cracking of residual hydrocarbons can account for up to 36.4% of the original soluble organic matter [51]. Large molecular groups with long or branched chains, due to their low thermal stability, preferentially undergo chain scission or debranching during thermal cracking, forming smaller molecular groups with higher thermal stability [50,52]. These smaller groups further break down with increasing thermal cracking intensity, generating even smaller molecular groups and eventually forming thermally stable gaseous hydrocarbons. Concurrently, the aromaticity of compounds in crude oil increases, leading to the formation of large polycyclic aromatic hydrocarbons and ultimately pyrobitumen [50,53].
The generation of oil from organic matter is a continuous process, where pre-oil bitumen and post-oil bitumen may coexist, and liquid hydrocarbons formed at different evolutionary stages can also be present simultaneously. This results in variations in the molecular composition and evolutionary processes of precursors forming pyrobitumen. Hydrocarbons generated from solid bitumen primarily originate from the thermal cracking of large molecular components rich in heteroatoms. However, the formation mechanisms and evolutionary processes of solid bitumen remain a challenging research topic. Liquid oil is believed to be released from solid bitumen through the thermal decomposition of its least stable bonds at Ro values below 1.8%, while methane-dominated gaseous hydrocarbons are primarily generated with increasing maturity [54]. At high maturity stages, solid bitumen undergoes secondary cracking, contributing to the development of nanopores in shales [1,35]. Based on the hydrocarbon generation and pore development processes of solid bitumen, the high pore development in pyrobitumen with low A-factor and C-factor in this study may be related to the detachment of more aliphatic chains and oxygen-containing functional groups during the thermal evolution of its precursors. Additionally, these shale samples have not yet reached the thermal evolution stage where molecular structures become ordered and stable (e.g., graphite formation), leading to the collapse and filling of organic pores and a reduction in porosity. Hackley et al. [55] suggest that the physical properties (reflectance, structure) and chemical properties (aromaticity) of solid bitumen in reservoirs are influenced by the relative content of connate water or mineral-bound water during thermal maturation. The availability of water in microenvironments determines the evolutionary path of solid bitumen. In the presence of water, organic matter pyrolysis favors a group disproportionation mechanism, promoting the aromatization of newly formed solid bitumen and the expulsion of saturated hydrocarbons [55]. During hydrocarbon generation, some homogeneous pyrobitumen retains more low-aromatic groups, indicating limited availability of connate or mineral-bound water as hydrogen donors, corresponding to poorer pore development.
Pyrobitumen-clay composites generally exhibit highly developed pores, with fracture-like pores along sheet-like clay minerals and larger internal organic pores compared to homogeneous pyrobitumen, along with relatively low A-factor and C-factor (Table 2 , Fig. 8 ). It is suggested that organic pore formation is influenced by two factors: (1) the detachment of more aliphatic chains and oxygen-containing functional groups due to clay mineral dehydration during hydrocarbon generation [55], and (2) the control of hydrocarbon expulsion rates on pore morphology. Clay minerals catalyze the hydrocarbon generation of organic matter [56-58], particularly smectite, which reduces the activation energy of hydrocarbon generation and accelerates reaction rates [59-61]. Additionally, the transformation of smectite to illite increases the layer charge and induces structural changes in clay minerals, thereby enhancing their catalytic activity [62]. Organic-clay composites provide larger contact areas between organic compounds and charged clay mineral surfaces, facilitating hydrocarbon generation [63]. At high to overmature stages, hydrocarbon generation within organic-clay composites may induce volumetric expansion, leading to hydrocarbon explosion and release. The associated higher hydrocarbon expulsion rates promote the formation of larger pores and fracture-shaped pores along the flake-shaped clay minerals.
3.2. Infrared spectral parameters as indicators of maturity
For the Lower Paleozoic shales lacking vitrinite, determining organic matter maturity is challenging. Currently, maturity evaluation is typically conducted using the reflectance of solid bitumen or bioclasts, or by converting Raman spectral parameters into equivalent vitrinite reflectance [64-70]. The reflectance of solid bitumen generally parallels the maturity of the host rock. However, this relationship is complicated by the coexistence of solid bitumen from multiple sources and different stages within the same rock [35,71]. This has led to numerous studies observing no correlation between BRo and other maturity parameters within a single microscopic field of view for source or reservoir rock samples [19,72]. The differences in molecular composition of pyrobitumen with varying occurrence modes in the Longmaxi Formation shales fully illustrate this point (Table 1 ), posing challenges for using solid bitumen as a proxy for maturity analysis.
FTIR studies assign specific spectral bands to chemical structures within complex kerogen molecules [16], and demonstrate its value in evaluating maturity, kerogen type, and hydrocarbon generation potential [41]. Based on analyses of kerogen samples from the New Albany Shale in the Illinois Basin of the United States and the Exshaw Formation in the Western Canada Sedimentary Basin, as well as thermally simulated kerogen samples from the New Albany Shale, Lis et al. [15] found a strong correlation between FTIR parameters and vitrinite reflectance (Ro). At low maturity, the CH2/CH3 ratio initially decreases and then stabilizes at higher maturity. During hydrous pyrolysis experiments, the CH2/CH3 ratio of kerogen decreases linearly with increasing Ro. The ratio of the C=O absorption peak area at 1 700 cm-1 to the C=C absorption peak area at 1 600 cm-1 in kerogen FTIR spectra first decreases with increasing Ro, then shows slight intermittent increases (observed in hydrous pyrolysis experiments and Exshaw Formation kerogen), and finally decreases again [15]. Similar to FTIR, AFM-IR spectroscopy has also been used to characterize organic matter maturity. Yang et al. [3] used AFM-IR spectral A-factor and C-factor to construct a Van Krevelen-type diagram, illustrating the evolutionary path of solid bitumen during hydrocarbon generation, showing early loss of oxygen-containing functional groups followed by aliphatic group loss at higher pyrolysis temperatures.
Combining previous findings on AFM-IR spectral A-factor and C-factor of solid bitumen in shales of varying maturity, it is observed that aromaticity generally increases with maturity, as indicated by the gradual decrease in A-factor and C-factor (Table 1 , Fig. 8 ). However, this trend is less pronounced in overmature Longmaxi Formation shales, where the C-factor exhibits significant fluctuations. The A-factor shows a stronger correlation with maturity, with the ratio of aliphatic to aromatic functional group absorption decreasing as maturity increases. It is important to note that FTIR and AFM-IR absorption signal intensities do not directly reflect specific functional group abundance because different functional groups have varying absorption potentials and rank- dependent absorption coefficients [15]. Although previous studies have used FTIR parameters to investigate thermal maturity, only a limited number of samples reflect organic matter with similar compositions but varying maturity ranges. Since each signal represents only a portion of the total (i.e., a specific but limited spectral response), these methods are inherently semi-quantitative [15].
4. Conclusions
The AFM-IR technique provides a more accurate and higher spatial resolution means for precise molecular composition and structural analysis of organic matter in shale, also offers new perspectives for characterizing organic matter heterogeneity at the microscale.
In the Longmaxi Shale, dispersed organic matter primarily consists of two types: pyrobitumen and graptolite periderm, with pyrobitumen being the dominant type. The AFM-IR spectra of both graptolite periderms and pyrobitumen are dominated by the stretching vibration absorption of aromatic conjugated C=C bonds at ~1 600 cm-1. AFM-IR spectral parameters show strong correlations with areal porosity in shales of equivalent maturity: lower A-factor and C-factor values correspond to more developed organic pores and higher areal porosity.
The evolutionary pathways of solid bitumen are controlled by water availability in microenvironments. Limited hydrogen donors (e.g., primary or mineral-bound water) result in partially homogeneous pyrobitumen retaining more low-aromatic groups, which correlates with poorly developed pores. In contrast, pyrobitumen-clay composites generally exhibit highly developed pores, likely due to clay mineral dehydration during hydrocarbon generation, facilitating the removal of aliphatic chains and oxygen-containing functional groups. Additionally, hydrocarbon generation within organic-clay composites may induce volumetric expansion, leading to hydrocarbon explosion and release at high to overmature stages. The associated higher hydrocarbon expulsion rates promote the formation of larger pores and fracture-shaped pores along the flake-shaped clay minerals. A-factor demonstrates stronger correlation with thermal maturity, as the absorption ratio of aliphatic to aromatic functional groups progressively decreases with increasing maturity.
Acknowledgments
We are grateful to the PetroChina Southwest Oil & Gasfield Company for providing the shale samples. Special thanks are extended to Dr. Songyou Yao from Sun Yat-sen University for his technical assistance in AFM-IR experimental operations and data processing.
Nomenclature
Ai—A-factor derived from AFM-IR peak intensity;
As—A-factor derived from AFM-IR peak area;
Ci—C-factor derived from AFM-IR peak intensity;
Cs—C-factor derived from AFM-IR peak area;
I1450, I1600, I1720—peak intensities at 1 450, 1 600, and 1 720 cm-1 in AFM-IR spectra;
S1450, S1600, S1720—fitted peak areas at 1 450, 1 600, and 1 720 cm-1 in AFM-IR spectra.