

Introduction
Over the past decade, offshore oil and gas reserves newly discovered have accounted for 60% of global in cremental reserves, of which deepwater and ultra-deepwater reserves contributed 61.99% [1-3]. Deepwater oil and gas exploration and development have gradually become a focal area in hydrocarbon resource exploitation. Deepwater HTHP wells are characterized by water depth exceeding 500 m, bottomhole temperature above 150 °C, and formation pore pressure over 69 MPa [4]. During drilling operations in such environments, uncertainties in wellbore pressure calculation due to difficult access to formation data and unclear multiphase flow dynamics in the wellbore may easily trigger wellbore instability issues such as lost circulation, kick, and even blowout [5-9]. Accurate calculation of wellbore pressure and timely inversion of formation pressure are therefore critical to ensuring the safe and efficient development of deepwater and deep subsurface hydrocarbon resources.
In practical drilling operations, a drilling fluid pit gain exceeding 1 m3 necessitates immediate well shut-in to control kicks, and formation pressure is then estimated using shut-in pressure data, followed by well control measures such as well killing based on the derived formation pressure [10]. Traditional shut-in pressure determination methods assume that bottomhole pressure is equal to formation pressure within 10-15 min after gas influx and shut-in. During the period, standpipe pressure (SPP) or casing pressure (CP) stabilizes or exhibits a near-linear increase. By initiating low-rate circulation until the drill pipe float valve opens and applying the U-tube principle, SPP or CP is measured at the wellhead. Formation pressure is subsequently calculated using the wellhead pressure and hydrostatic column pressure [11]. Thus, accurately determining the time required for bottomhole pressure to equilibrate with formation pressure is essential for reliable shut-in pressure evaluation. Numerous studies have investigated wellbore pressure calculations post-shut-in. Liu et al. [12] developed a kick and shut-in pressure model accounting for wellbore afterflow effects. Leblanc et al. [13] incorporated afterflow and gas slippage effects in their shut-in pressure model. Zheng et al. [14] compared nine temperature-pressure coupling algorithms, established a transient thermo-pressure coupling model under shut-in conditions, and analyzed factors such as gas-water ratio and heat transfer coefficient. Zhu et al. [15] proposed gas invasion rate and migration models during shut-in based on multiphase flow theory, and considering formation permeability, bottomhole pressure differential and drilling fluid rheology. Zhang et al. [16] introduced a wellbore pressure calculation method incorporating suspended gas effects during shut-in. Xu et al. [17] coupled temperature and pressure fields to develop a thermo-pressure model for deviated HTHP wells. Ren et al. [18] integrated seepage and multiphase flow theories to formulate a post-gas- invasion shut-in pressure model and proposed a method for reading standpipe pressure. Tian et al. [19] considered well test interpretation theory to establish a method for determining shut-in pressure measurement duration in low-permeability reservoirs. Maki [20] derived a bottomhole pressure calculation method from shut-in wellhead pressure by considering hydrostatic pressure loss. The studies mentioned above focus on solving shut-in wellbore pressure by considering afterflow, gas migration and expansion, gas distribution in the wellbore, and wellbore temperature field, but they simply assume static permeability and fixed formation pressure, so they are difficult to reflect the dynamic changes in complex formations, and therefore exhibit certain limitations. Furthermore, although progress has been made in pressure calculation and pressure build-up analysis for specific cases such as instantaneous shut-in [21], abnormal pressure recovery [22], and water well shut-in [23], complex formation conditions remains insufficiently addressed. Particularly in HTHP wells drilling in deepwater fractured formations, gas flow within fractures exhibits non-Darcy behaviors, and fractures undergo deformation due to stress sensitivity, significantly impacting pressure recovery and fluid flow dynamics during the shut-in afterflow phase [24]. Additionally, the high-temperature, high-pressure formation conditions alter the physical properties of fluids in the shut-in wellbore. The coupled interactions among the temperature, pressure, and seepage fields create complex interdependencies that existing models fail to accurately capture, leading to unreliable shut-in wellbore pressure calculations. Relying on conventional pressure buildup analysis methods under such conditions may result in secondary operational risks.
To address these gaps, this study enhances existing shut-in pressure models by incorporating the effects of deepwater HTHP on drilling fluid density and fracture deformation on afterflow behavior. A THM (thermos-hydro- mechanical) coupled shut-in pressure calculation model was developed for HTHP wells in fractured formations. The influences of geothermal gradient, bottomhole pressure differential, drilling fluid pit gain, and kick index on wellbore pressure are analyzed. Furthermore, a shut-in pressure build-up chart is constructed based on the coupled model, establishing a methodology for shut-in pressure build-up methodology in deepwater fractured HTHP wells. This work provides theoretical support for ensuring well control safety in such challenging environments.
1. Shut-in wellbore pressure calculation model considering THM coupling
During shut-in operations in deepwater fractured HTHP wells, gas within fractures invades the wellbore under the effect of bottomhole pressure differential, resulting in a decrease in fracture pore pressure, an increase in effective stress, and subsequent fracture compression and closure. Then gas in the fractures is compressed and causing a partial recovery of pore pressure, which in turn drives gas to keep flowing into the wellbore. Concurrently, the significant temperature gradient between deepwater (at low temperature) and formation (at high temperature) accelerates gas migration and expansion as well as thermal expansion of drilling fluid. These jointing effects progressively elevate the wellbore pressure. As wellbore pressure increases, the pressure differential between the wellbore and formation gradually diminishes, thereby suppressing further gas invasion. In a word, in a shut deepwater fractured HTHP well, changes of the wellbore pressure are very different from a conventional well, under the jointing effects of heat transfer (thermal field), gas migration (seepage field), and fracture deformation (stress field).
1.1. THM coupling between wellbore and formation
1.1.1. Fracture deformation model
Due to the stress sensitivity of fractured formations, the degree of fracture closure dynamically varies with gas invasion [25], which in turn affects gas invasion rate and wellbore pressure under shut-in afterflow conditions. The stress state of fractures controls their closing behavior. For two-dimensional (2D) fractures, their closure is primarily influenced by external forces in vertical and horizontal directions and internal pore pressure. The equilibrium between these external forces and internal forces maintains fracture stability [26]. To simplify the model, this study assumes a single radial 2D fracture. Under formation equilibrium conditions, the fracture satisfies the effective stress theorem. The effective stress of the fracture, accounting for its inclination angle, is expressed as:
As gas invades the wellbore from the fracture, the pressure in the fracture decreases, disrupting the stress equilibrium and inducing the fracture to close. This results in a gradual reduction in the spacing between the fracture’s upper and lower surfaces. According to the Hertzian contact theory [27], the relationship between effective stress and fracture closure is expressed as:
According to the Greenwood-Williamson (G&W) model, the height distribution of asperities on fracture surfaces follows normal distribution [28]:
Substituting the above equation into Eq. (2), we get
1.1.2. Gas flow model considering fracture deformation
Drilling operation activates fractures and induces the fluid in the fractures to flow into the wellbore at initial well shut-in. Previous studies thought fluid flow within fractures following the Darcy’s law, but in fact, it is different from the real flow behavior [29]. This study assumes non-Darcy flow, single-phase fluid (only natural gas), and the outer boundary of fracture contacts gas reservoir.
Based on the law of mass conservation, the continuity equation for gas flow is expressed as:
The momentum equation derived from the Forchheimer equation is expressed as [30]:
where the Forchheimer coefficient is determined using an empirical formula [31]:
By coupling the fracture deformation model (Eq. (3)) with the fracture gas flow model (Eqs. (4)-(5)), a coupled system is solved. At the initial moment, the pressure within the fracture is uniform and equal, and the inner and outer boundaries of the fracture correspond to wellbore and gas reservoir, respectively, the initial boundary conditions are defined as follows:
The rate of gas invasion into the wellbore from the formation is calculated using the derived gas flow rate [32]:
1.1.3. Temperature field model
After shut-in, the fluid in the wellbore remains static. Although there is no frictional heat caused by fluid flow, heat transfer continues between the wellbore fluid and surrounding seawater and formation [33]. The initial temperature field is assumed to be a steady-state temperature profile after stable drilling circulation. The drill pipe temperature equals to the annular temperature. Heat loss through the cement sheath and the casing string are neglected, but that through the wellbore wall is taken into account. The wellbore temperature field model (choke line section) follows Eq. (8), the annular temperature field model (formation section) is Eq. (9), and the ambient temperature model is Eq. (10), where the seawater temperature follows Reference [34].
According to the Hasan & Kabir formula, the dimensionless parameter is derived as:
where
where
1.1.4. Calculation model of drilling fluid density under different temperature and pressure
In a deepwater HTHP well, the density of drilling fluid in the wellbore directly affects the accurate calculation of hydrostatic column pressure [35]. Generally, comprehensive (mechanistic) models and empirical (data-driven) models are used to simulate the variation of drilling fluid density under different temperature and pressure conditions. Comprehensive models consider the temperature- and pressure-dependent characteristics of the components of drilling fluid, require precise acquisition of their physical properties, and solve multi-variable coupled equations, so they are suitable for the development of new drilling fluid. Empirical models directly establish the mapping relationship between temperature/pressure and density by fitting experimental data measured under various conditions, with no need to analyze component physical properties or solve complex equations while maintaining acceptable accuracy [36-39]. Water-based drilling fluid is commonly used in deepwater drilling operation, so we select an empirical model to calculate drilling fluid density under different temperature and pressure conditions [40]:
1.2. Wellbore pressure calculation model
After a well is shut in due to negative pressure differential and gas invasion, the wellbore pressure changes under the jointing action of afterflow, gas migration/expansion and drilling fluid loss [41]. However, since formation fractures tend to close under stress variation, the loss of drilling fluid is minor and neglected in this study. By comprehensively considering the influence of ambient temperature and pressure on drilling fluid density and the impact of fracture deformation on gas influx, a wellbore pressure calculation model for deepwater HTHP fractured wells during shut-in is established.
1.2.1. Afterflow mechanism
At the beginning of shut-in, the bottomhole pressure is lower than the formation pressure, allowing gas to flow into the wellbore under the pressure differential. This process compresses the original fluids in the wellbore, induces volumetric expansion of the wellbore, and increases the wellbore pressure. In a HTHP well, variation in drilling fluid density with temperature and pressure also affects the hydrostatic column pressure within the wellbore. As the bottomhole pressure approaches to the formation pressure, gas invasion ceases. Considering the volumetric expansion of the wellbore, the compressibility and expansibility of the wellbore fluids, the volume of gas influx into the wellbore can be derived from the mass conservation law as:
where $\begin{aligned} V_{\mathrm{gs}} & =\int_{0}^{t} Q(t) \mathrm{d} t \\ V_{1} & =V_{0}-V_{\mathrm{g}} \end{aligned}$
As shown in Fig. 1 , under the influence of afterflow, the gas content within the wellbore increases and gradually develops into a gas column. Based on the gas-liquid distribution in the wellbore, it can be divided into a gas-liquid mixture zone and a liquid-dominated zone. The gas tail pressure is:
The gas front pressure is:
The pressure at specific depth within the liquid-dominated zone is:
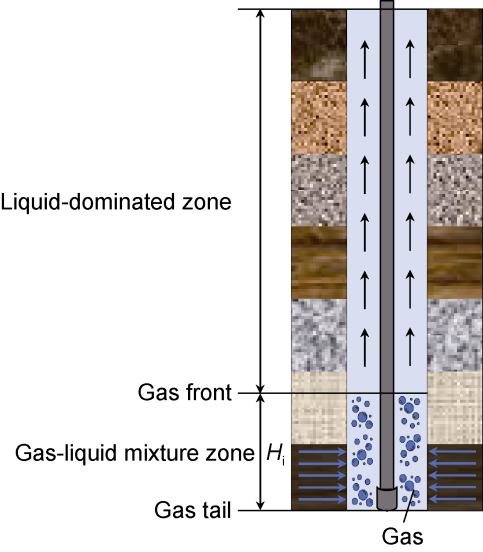
Fig. 1. Schematic diagram of shut-in afterflow mechanism: gas influx from formation into wellbore (blue arrows); gas migration within wellbore (black arrows). |
1.2.2. Gas migration and expansion
Because the density of the gas flowing into the wellbore is lower than that of the drilling fluid, it slips away and migrates upward through gravity segregation, and expands with temperature and pressure, making the wellbore pressure increase. After considering the volumetric expansion of the wellbore, and the compressibility and expansibility of the wellbore fluids, the incremental gas volume is derived from the mass conservation law:
where
As shown in Fig. 2 , as gas migrates, its distribution within the wellbore evolves. Based on the variation in gas position per unit time, it can be determined that:
Based on the gas distribution within the wellbore, the wellbore pressure at corresponding locations can be calculated. The gas tail pressure is:
The gas front pressure is:
The pressure at specific depth within the liquid-dominated zone is:
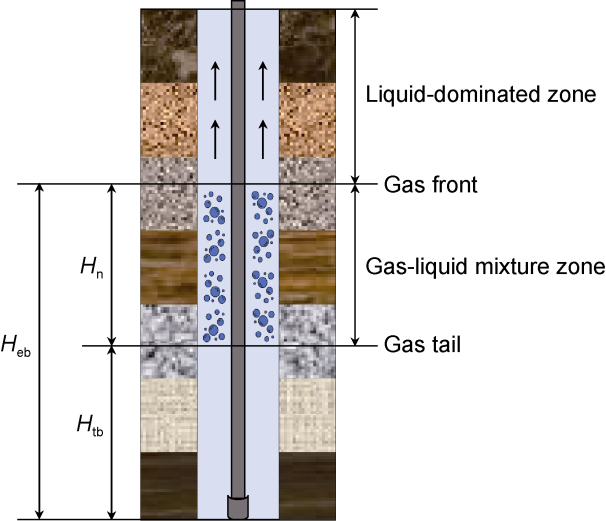
Fig. 2. Schematic diagram of post-shut-in gas migration and expansion. |
2. Solution of the wellbore pressure calculation model considering THM coupling
2.1. Solution methodology
The shut-in wellbore pressure calculation model established in this study exhibits high nonlinearity and is solved iteratively using numerical methods [42-44]. The initial parameters include pre-shut-in fracture pressure, drilling fluid density, wellbore temperature and pressure. The computational procedures are as follows:
(1) Calculate the effective fracture stress σf based on the fracture pressure pf, then determine the fracture closure volume. Use the gas flow model in fractures to derive the gas flow velocity vg, and compute the gas influx Vgs,ts per unit time step;
(2) Estimate the bottomhole pressure pw1. Calculate the compressed gas volume, compressed liquid volume, and wellbore expansion volume. Sum these to obtain the total volumetric change ΔV1,ts;
(3) Check whether |ΔV1,ts-Vgs,ts| is less than 1×10⁻⁶ m3. If yes, go to Step (4), or return to Step (2);
(4) Check whether |pw1-pf| is less than 1×10⁻⁵ MPa. If yes, terminate the afterflow phase and go to Step (5), or return to Step (1) to compute gas influx for the next time step;
(5) Initialize the gas migration-expansion phase using the terminal values from the afterflow phase (bottomhole pressure and gas influx volume). Calculate the height of gas-liquid mixture zone (Hi) at the end of afterflow;
(6) Calculate the rising height of the gas tail (Htb), the height of the gas front (Heb), and the gas-liquid mixture zone (Hn) based on the gas ascending velocity subsequently;
(7) Estimate the updated bottomhole pressure pw2. Use the gas equation of state to compute the gas volume during migration and expansion. Calculate the gas expansion volume ΔVg,ts per unit time step based on the previous phase’s gas volume. Sum the compression and thermal expansion of drilling fluid, and wellbore expansion to obtain total volumetric change ΔV2,ts;
(8) Check whether |ΔV2,ts-ΔVg,ts| is less than 1×10⁻⁶ m3. If yes, go to Step (8), or return to Step (6);
(9) Check if the height of the gas front Heb has reached the total well depth. If yes, go to Step (9), or return to Step (6) for calculation at next time step;
(10) Derive the full wellbore pressure profile from pw2.
2.2. Model validation and calculation
Well X-1 is a deepwater ultra-deep well in the Baiyun Sag, Pearl River Mouth Basin, South China Sea. This area features high geothermal gradients, elevated fracture pore pressure, and extensive deep-seated fractures. Field data from Well X-1 are used to validate the proposed shut-in wellbore pressure model. Key parameters are listed in Table 1 .
Table 1. Basic parameters from Well X-1 |
| Parameter | Value | Parameter | Value |
|---|---|---|---|
| Water depth | 1 000 m | Drilling fluid density | 1 350 kg/m3 |
| Well depth | 7 800 m | Formation pressure | 113 MPa |
| Openhole radius | 0.153 m | Wellhead temperature | 20 °C |
| Drilling fluid viscosity | 20 mPa·s | Geothermal gradient | 3.5 °C/100 m |
2.2.1. Model validation
As shown in Fig. 3 , the bottomhole pressure increases over time and eventually recovers to the formation pressure. When considering THM coupling, the bottomhole pressure curve recovers the fastest, indicating that the coupling effects of temperature, fluid flow and fracture deformation significantly accelerate pressure restoration. In contrast, when only considering fracture deformation, the bottomhole pressure rises sharply at the initial shut-in phase due to gradual fracture closure and slow rise in later stages as fractures reach equilibrium. When only considering temperature and pressure, the overall pressure increase becomes more gradual.
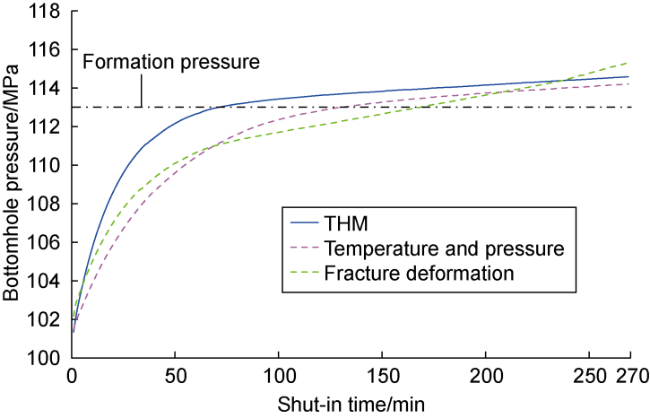
Fig. 3. Variation of bottomhole pressure with shut-in time under different conditions. |
As shown in Fig. 4 , the variation of casing pressure at the wellhead aligns closely with the bottomhole pressure. The curve exhibits a smooth upward trend without obvious inflections. The pressure calculated using the THM model coincides with the measured by over 95%, demonstrating high consistency.
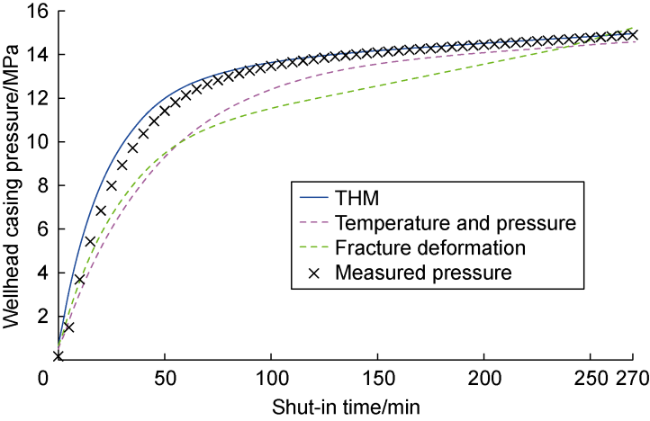
Fig. 4. Variation of wellhead casing pressure with shut-in time. |
2.2.2. Analysis of calculation results
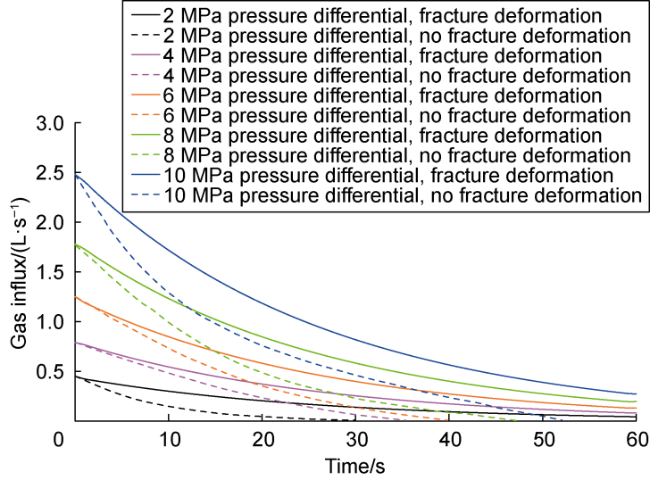
Fig. 5. Variation of gas influx rate with time under different initial bottomhole pressure differentials. |
After gas invades the wellbore, it undergoes slip migration within the wellbore. Fig. 6 shows the variation curves of gas holdup in the free gas phase under different shut-in times. During the initial shut-in phase (0-40 min), the gas holdup curve exhibits a distinct peak near the wellbore bottom. This phenomenon results from continuous gas influx from the formation into the wellbore under the bottomhole pressure differential, leading to progressive gas accumulation at the wellbore bottom. As shut-in time increases, the free gas phase ascends continuously within the wellbore, causing a gradual decrease in gas holdup near the bottom.
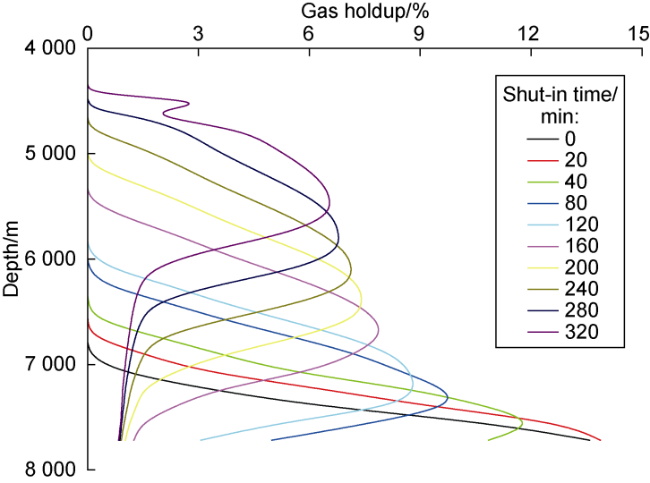
Fig. 6. Distribution of free gas holdup after different shut-in time. |
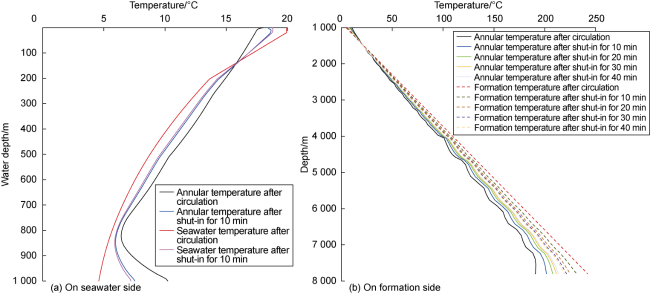
Fig. 7. Annular and ambient temperature profiles after different shut-in time. |
Using the density of drilling fluid at normal temperature and pressure in Table 1 as the initial density, the density of drilling fluid at different temperatures (4-220 °C) and pressures (10-120 MPa) was calculated (Fig. 8 ). At the same temperature, the density of drilling fluid increases when the pressure increases, reflecting its compressibility. At the same pressure, the density of drilling fluid decreases when the temperature increases, reflecting its thermal expansibility. The compressibility and thermal expansibility of drilling fluid change under the influence of temperature and pressure [45]. With the increase of pressure, the compressibility of drilling fluid and the thermal expansibility changes little. When the temperature increases, the compressibility of drilling fluid changes little, and the thermal expansibility increases. Therefore, with the simultaneous increase of temperature and pressure, especially when the temperature range is large, the thermal expansion effect of drilling fluid is more significant than the compression effect. Therefore, the thermal expansion of drilling fluid has a greater influence on wellbore pressure when a deepwater HTHP well is shut in.
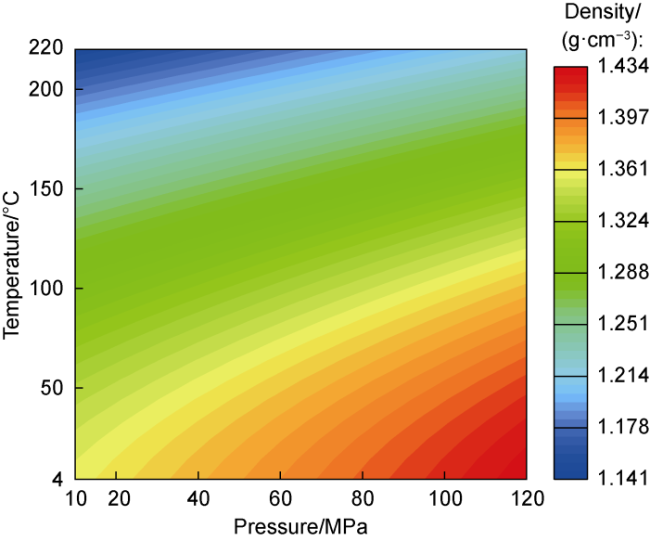
Fig. 8. Drilling fluid density at different temperatures and pressures. |
In the actual drilling process, wellhead casing pressure is regarded as an important index of wellhead safety. Therefore, this paper calculates the wellhead casing pressure under different geothermal gradient, bottom hole pressure differential, drilling fluid pit gain and kick index, and analyzes its variation law. At constant bottomhole pressure differential (6 MPa), drilling fluid pit gain (1.6 m3) and kick index (2 000 m3/(d·MPa)), the larger the geothermal gradient, the higher the wellhead casing pressure after the same shut-in time (Fig. 9 ). This is because the higher the formation temperature and the higher the wellbore temperature, the more obvious the thermal expansion of drilling fluid and gas expansion, resulting in higher wellhead casing pressure.
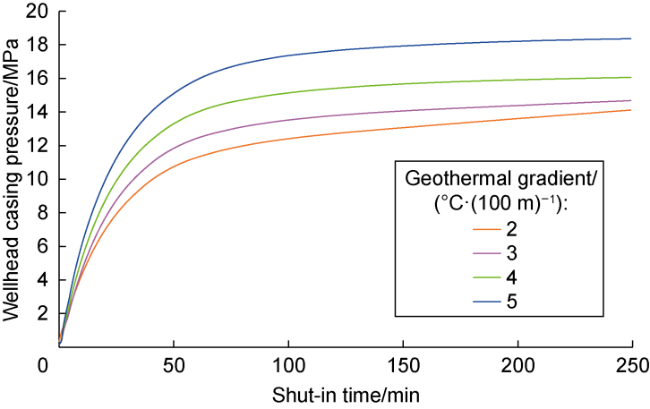
Fig. 9. Variation of wellhead casing pressure under different geothermal gradients. |
At constant geothermal gradient (3 °C/100 m), drilling fluid pit gain (1.6 m3) and kick index (2 000 m3/(d·MPa), the larger the bottomhole pressure differential, the higher the wellhead casing pressure (Fig. 10 ) after the same shut-in time. The larger the bottomhole pressure differential, the faster and more the formation gas invades the wellbore, the more obvious the gas expansion, and the higher the wellhead casing pressure.
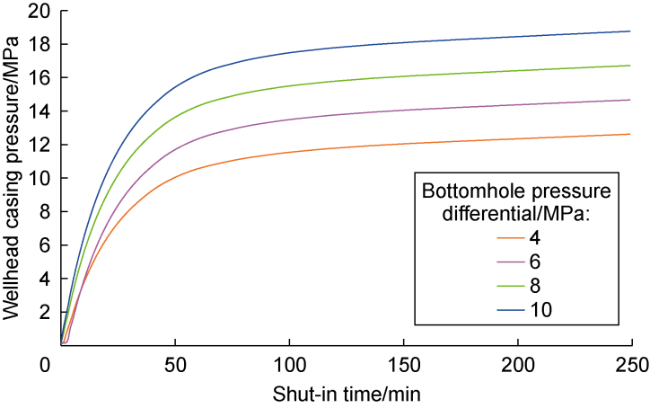
Fig. 10. Variation of wellhead casing pressure under different bottomhole pressure differentials. |
At constant geothermal gradient (3 °C/100 m), bottomhole pressure differential (6 MPa) and kick index (2 000 m3/(d·MPa)), the larger the drilling fluid pit gain after the same shut-in time, the higher the wellhead casing pressure (Fig. 11 ). The gain of drilling fluid pit is caused by formation gas invasion. The larger the gain, the more the gas invasion, the more obvious the gas expansion, and the higher the wellhead casing pressure.
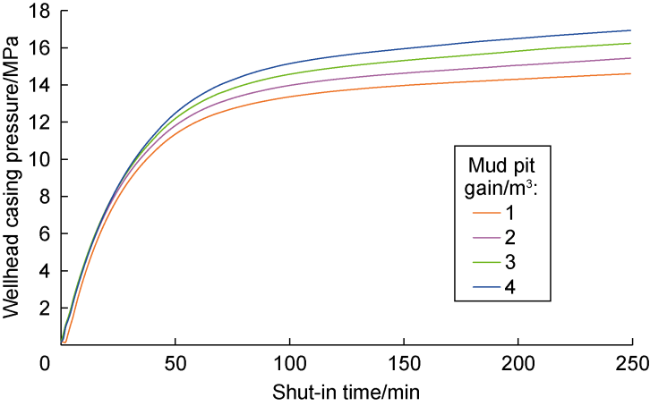
Fig. 11. Variation of casing pressure at the wellhead under different drilling fluid pit gains. |
This study employs the kick index to characterize gas influx per unit pressure and time during drilling operations. The kick index can be obtained from offset well data or calculated based on drilling fluid pit gain, drilled formation permeability, reservoir thickness, and other parameters. When geothermal gradient, bottomhole pressure differential, and drilling fluid pit gain are held constant, a higher kick index leads to faster casing pressure rise at the wellhead within the same shut-in time (Fig. 12 ). This is attributed to the fact that a higher kick index corresponds to a faster gas influx rate from the formation. Since the total gas influx volume remains identical under different kick index (due to fixed drilling fluid pit gain in calculations), the resulting peak casing pressures are nearly equivalent.
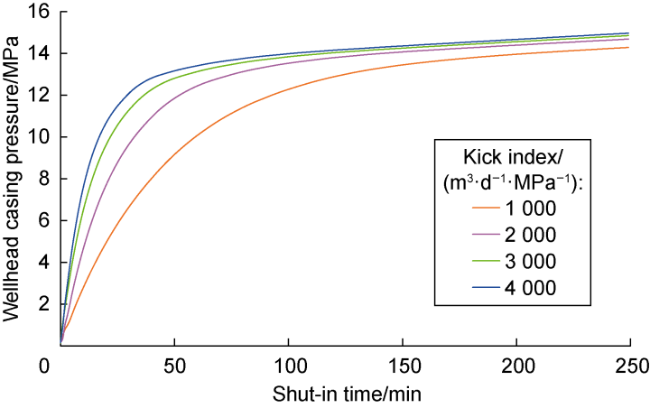
Fig. 12. Variation of wellhead casing pressure under different kick indices. |
3. Shut-in pressure build-up method for HTHP wells considering THM coupling
3.1. Shut-in pressure build-up charts
3.1.1. Parameter definitions
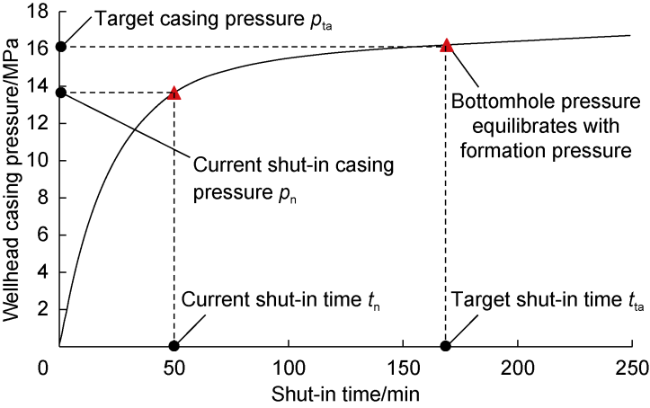
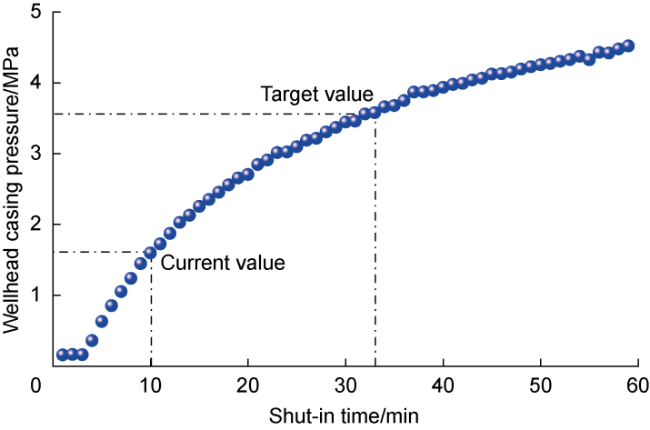
Based on the calculation model incorporating THM interaction, wellhead casing pressure and shut-in time with varying parameters can be predicted. By defining casing pressure build-up rate (Eq. (21)) and shut-in time build-up rate (Eq. (22)), the target casing pressure (i.e., the wellhead casing pressure when the bottomhole pressure equilibrates with the formation pressure) and the corresponding target shut-in time can be inversely derived from the current casing pressure and shut-in time, as illustrated in Fig. 13.
3.1.2. Factor correlation analysis
Under the condition of a fixed shut-in time (10 min), the casing pressure build-up rate and the shut-in time build-up rate were calculated for varying geothermal gradients, bottomhole pressure differentials, drilling fluid pit gains, and kick index, using the formation pressure data from Well X-1 (Fig. 14 ).
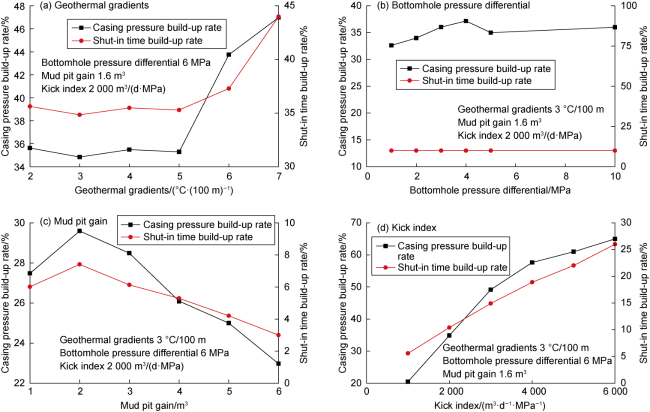
Fig. 14. Impacts of different parameters on casing pressure build-up rate and shut-in time build-up rate. |
As shown in Fig. 14 , the impacts of different parameters on casing pressure build-up rate and shut-in time build-up rate are different. (1) Geothermal gradient primarily influences gas migration/expansion and thermal expansion of drilling fluid in wellbore. When exceeding the critical threshold (5°C/100 m), their jointing effects become intense abruptly, causing rapid pressure rise in the wellbore, and significant increases in casing pressure and shut-in time build-up rates. (2) Although bottomhole pressure differential directly affects gas influx rate and volume, the increases in target casing pressure and shut-in time result in negligible changes of casing pressure and shut-in time build-up rates. (3) A larger drilling fluid pit gain reflects more gas influx into the wellbore before shut-in, and easy formation of a gas column which may attenuate the propagation of pressure waves in the wellbore, slow casing pressure rise, and consequently, both casing pressure and shut-in time build-up rates decrease. (4) A higher kick index corresponds to a faster gas influx rate, a larger influx volume, and stronger gas migration/expansion, which accelerates casing pressure rise, and increases both casing pressure and shut-in time build-up rates. In summary, at the same shut-in time, drilling fluid pit gain, geothermal gradient and kick index exert significant impacts on casing pressure and shut-in time build-up rates, but bottomhole pressure differential has a little.
3.1.3. Shut-in pressure build-up chart
Based on the factor correlation analysis above, three parameters—drilling fluid pit gain, geothermal gradient, and kick index—are selected to construct a shut-in pressure build-up chart. By keeping one parameter constant, we analyze how the other variables affect casing pressure and shut-in time build-up rates. For example, keeping geothermal gradient 3°C/100 m, when the same drilling fluid pit gain and shut-in time is 10 min, a higher kick index leads to higher casing pressure and shut-in time build-up rates (Figs. 15 and 16 ) because a higher kick index reflects faster and more gas influx, and faster wellbore pressure rise at the same time. Therefore, with known kick index and drilling fluid pit gain, the corresponding casing pressure and shut-in time build-up rates can be determined from the charts. For instance, when kick index is 4 000 m3/(d·MPa) and drilling fluid pit gain is 1 m3, the corresponding casing pressure and shut-in time build-up rates are 72% and 43%, respectively, and the target casing pressure and shut-in time can be estimated. Field technicians can shut in the well until the target shut-in time reaches, then open the drill pipe float valve by activating the pump at a low flow rate and read the standpipe pressure. The formation pressure is the sum of the standpipe pressure and the hydrostatic pressure. To prevent secondary accidents due to prolonged shut-in and the minimal difference between casing pressure and standpipe pressure caused by U-tube effect, the target casing pressure can replace standpipe pressure to estimate the formation pressure.
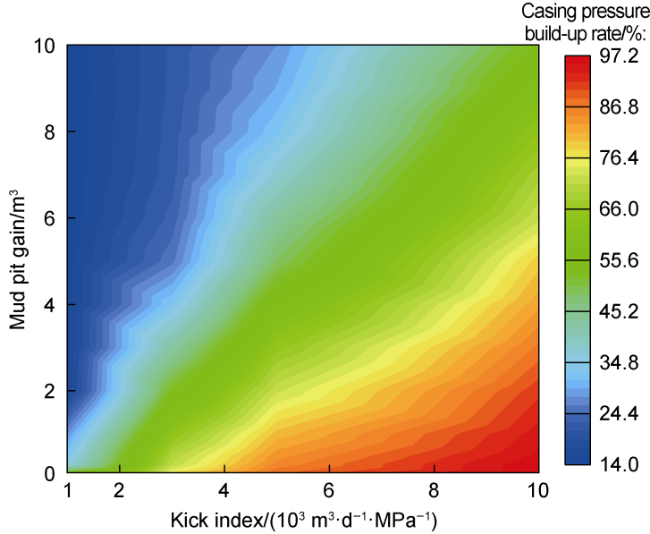
Fig. 15. Casing pressure build-up rate at different kick indices and drilling fluid pit gains. |
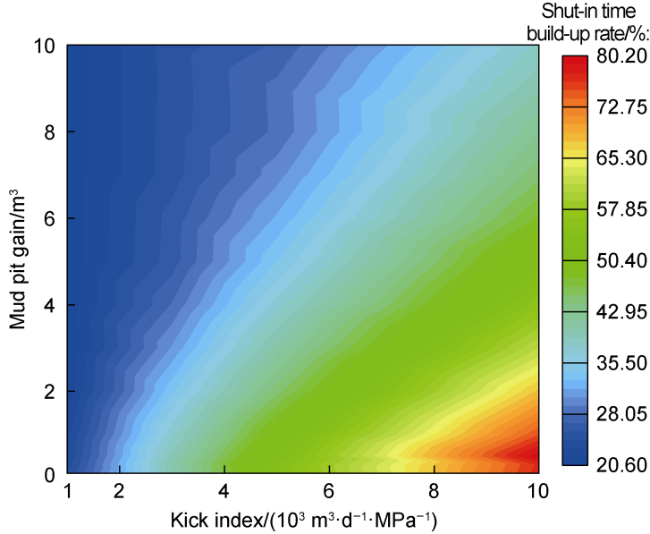
Fig. 16. Shut-in time build-up rate at different kick indices and drilling fluid pit gains. |
Using the model proposed in this paper and considering casing pressure and shut-in time build-up rates, pressure build-up charts can be built for different shut-in times, parameter combinations and ranges.
3.2. Case study
Well X-2 located in the Baiyun Sag of the Pearl River Mouth Basin in the South China Sea suffered a kick when drilled to 4 383 m, and was shut immediately. Next, we validate the pressure build-up chart using the real wellhead casing pressure from Well X-2. The basic parameters are listed in Table 2 .
Table 2. Basic parameters of Well X-2 |
| Parameter | Value | Parameter | Value |
|---|---|---|---|
| Water depth | 814.8 m | Current shut-in time | 10 min |
| Designed well depth | 5 129 m | Current casing pressure | 1.59 MPa |
| Kick index | 2 000 m3·d−1·MPa−1 | Drilling fluid pit gain | 1 m3 |
| Geothermal gradient | 3 °C·100 m−1 | Formation pressure | 55 MPa |
As shown in Fig. 17 , the wellhead casing pressure increased after shut-in. Measured data found that the bottomhole pressure equilibrated with the formation pressure, and the corresponding casing pressure was 3.58 MPa at 33 min after shut-in. However, due to the jointing effects of thermal expansion of drilling fluid and gas migration/expansion, the wellbore pressure continued rising. As gas gradually migrated toward the wellhead, the temperature field in the wellbore became stable, resulting in a gradual reduction in the pressure rising rate. The casing pressure curve showed no distinct inflections throughout the shut-in period, making traditional shut-in pressure build-up methods inapplicable. When the kick index is 2 000 m3/(d·MPa) and drilling fluid pit gain is 1 m3, the casing pressure build-up rate is 45.2%, and the shut-in time build-up rate is 29.5% according to the pressure build-up chart developed in this paper. After shut-in for 10 min, the current casing pressure is 1.59 MPa, so the target casing pressure is 3.52 MPa, and the target shut-in time is 33.9 min.
Fig. 17. Measured wellhead casing pressure during Well X-2 shut-in. |
Compared with the measured data, the target casing pressure predicted by the chart established in this paper is as accurate as 97.2%, and the target shut-in time 98.3%. Their errors are acceptable. The results have proven the chart reliable for well control safety in HTHP wells.
4. Conclusions
A calculation model for shut-in wellbore pressure in deepwater fractured HTHP wells was established by comprehensively considering non-Darcy gas flow within fractures, fracture deformation, and thermal expansion of drilling fluid. By defining casing pressure build-up rate and shut-in time build-up rate, a shut-in pressure build-up chart was constructed.
The results of the shut-in wellbore pressure calculation model achieved an accuracy rate of over 95% compared to the measured wellhead casing pressure data during shut-in in Well X-1. At the beginning of shutting a deepwater HTHP well, fracture deformation significantly promotes gas influx from the formation, resulting in a fast gas influx rate and a larger influx volume. Then the fluid temperature in the choke line gradually decreases while the annular temperature in the formation gradually increases. With the increase of pressure, the change of compressibility of drilling fluid and thermal expansion is small. With the increase of temperature, the compressibility of drilling fluid changes less, but the thermal expansion enhances. This reflects that the thermal expansion effect of drilling fluid is more significant under the conditions of high temperature and high pressure and large temperature range, thus affecting the wellbore pressure. An increase in geothermal gradient intensifies thermal expansion of drilling fluid and gas expansion, leading to higher wellhead casing pressure. An increase in bottomhole pressure differential accelerates gas influx, causing casing pressure to rise. Drilling fluid pit gain directly reflects total gas influx volume and exhibits a positive correlation with casing pressure. A higher kick index results in faster pressure escalation, but the maximum casing pressure remains stable due to the constraint from total influx volume.
Validation using measured wellhead casing pressure data during shut-in in Well X-2 demonstrated that the prediction accuracy for wellhead casing pressure is 97.2%, and the prediction accuracy for shut-in time is 98.3%, with both errors within acceptable limits. The shut-in pressure build-up method proposed in this paper enables accurate determination of formation pressure after shutting a HTHP well, which provides a basis for subsequent well control measures and ensures safe and efficient development of deepwater oil and gas resources.
Nomenclature
ad—asperity density, mm−2;
bh(t)—equivalent hydraulic fracture aperture at time t, m;
b0—initial fracture aperture, mm;
cl, cs—specific heat capacities of drilling fluid, gas and formation rock, respectively, J/(kg•K);
Cg, Cl, Co—compressibility coefficients of gas, drilling fluid and wellbore, respectively, MPa−1;
E—elastic modulus of rock, Pa;
Eg—gas holdup in gas-liquid mixed section, dimensionless;
g—gravitational acceleration, m/s2;
h—depth, m;
hso—heat transfer coefficient between seawater and the outer surface of choke line, W/(m2•K);
hwa—heat transfer coefficient between wellbore wall and annulus, W/(m2•K);
Heb—height of gas front above bottomhole, m;
Hi—height of gas-liquid mixed section during afterflow, m;
Hn—height of gas-liquid mixed section during gas migration, m;
Htb—height of gas tail above bottomhole, m;
kl—thermal conductivity of choke line, W/(m•K);
ks—thermal conductivity of formation, W/(m•K);
K—equivalent fracture permeability, m2;
L—radial fracture length, m;
Lm—maximum radial fracture length, m;
m—asperity height on fracture surface, mm;
n—total time steps, dimensionless;
p—pressure, Pa;
pe—gas front pressure, Pa;
pf—fluid pressure within fracture, Pa;
pn—current shut-in casing pressure, Pa;
po—liquid column pressure, Pa;
pr—reservoir pressure, Pa;
pt—gas tail pressure, Pa;
pta—target shut-in casing pressure, Pa;
pw—bottomhole pressure, Pa;
Q(t)—gas influx rate, m3/s;
rri—inner radius of choke line, m;
r—radial distance to well wall, m;
rp—outer radius of drill pipe, m;
rro—outer radius of choke line, m;
rw—wellbore radius, m;
R—expected asperity radius, mm;
Rp—casing pressure build-up rate, %;
Rt—shut-in time build-up rate, %;
Δt—per unit of time step, s;
t—shut-in time, s;
tn—current shut-in time, min;
tta—target shut-in time, min;
T—temperature, °C;
Ta—annular temperature, K;
Ts—formation temperature, K;
vg—gas flow velocity in fracture, m/s;
v0(t)—gas velocity at wellbore wall at time t, m/s;
v1—rising velocity of gas tail, m/s;
v2—rising velocity of gas front, m/s;
Vg—gas volume into wellbore before shut-in, m3;
ΔVg—additional gas volume due to expansion, m3;
Vgs—gas volume into wellbore after shut-in, m3;
Vl—drilling fluid in wellbore, m3;
ΔVl—additional drilling fluid due to thermal expansion, m3;
Vo—wellbore volume, m3;
z—well depth, m;
αs—thermal diffusivity of formation, m2/s;
β—forchheimer coefficient, m−1;
δ—fracture closure displacement, mm;
η—expected asperity height, mm;
θ—fracture dip angle, (°);
μ—gas viscosity, Pa•s;
υ—Poisson’s ratio of rock, dimensionless;
ξ—standard deviation of asperity height distribution, mm;
ρg—gas density, kg/m3;
ρl—drilling fluid density, kg/m3;
ρlb—drilling fluid density before shut-in, kg/m3;
ρli—drilling fluid density at ambient conditions, kg/m3;
ρov—overburden rock density, kg/m3;
ρs—formation rock density, kg/m3;
ϕ(m)—asperity height distribution function on fracture surface, mm-1;
σf—effective stress on fracture, Pa;
ψ—shear stress correction factor, dimensionless.