

Introduction
China, as the largest energy consumer, the largest energy importer, and the largest greenhouse gas emitter in the world, faces significant challenges in ensuring energy security and supply, addressing climate change, and achieving the goal of carbon neutrality [1]. Innovation is the lifeblood of new quality productive forces, energy security is the fundamental guarantee for China to build a great modern socialist country and achieve the great rejuvenation of the Chinese nation, realizing the "energy independence" and building an "energy powerhouse".
The global energy landscape has witnessed two major revolutions: the black shale oil and gas revolution and the green new energy revolution. The first "dark horse" in the history of global energy was the U.S. black shale oil and gas revolution. In 2019, the U.S. energy consumption reached 22.2×10⁸ tons of oil equivalent (toe), while production reached 22.6×10⁸ toe [2], marking the first time since 1957 that energy production exceeded consumption, allowing the U.S. to achieve "energy independence" through the shale oil and gas revolution. The second "dark horse" in global energy history is China’s green new energy revolution driven by wind, solar, hydrogen and energy storage. By the end of 2023, China’s installed capacity of hydropower, wind power, and solar power accounted for 50.4% of total power generation capacity, surpassing the 47.6% share of thermal power for the first time [3]. This milestone signifies a new stage for China’s new energy development and accelerates the global green energy transition.
An essential strategy for China in building an "energy powerhouse" is to support the timely achievement of its "dual carbon" goals. China has planned a total investment of RMB 268.2×10¹² for the period from 2024 to 2060[4], targeting key areas such as green and low-carbon energy transition, carbon peaking in the industrial sector, carbon peaking in urban and rural construction, green and low-carbon transportation, ecosystem restoration and carbon sink enhancement, green and low-carbon technological innovation, energy efficiency improvement initiatives, and the circular economy to fulfill its "dual carbon" commitments. During the critical carbon peaking period from 2024 to 2030, the total funding requirement is approximately RMB 25.2×10¹², with an annual average of RMB 3.6×10¹² [4], focusing on laying the foundation for carbon neutrality through energy transition, industrial energy efficiency, and green technology research and development. From 2031 to 2060, in the carbon neutrality advancement phase, the annual funding demand will increase to RMB 8.1×10¹², totaling RMB 243.0×10¹² [4], with an emphasis on the transformation and systemic optimization of high-carbon- emission industries.
The energy resource endowment of China is characterized by "abundant coal, limited oil and gas, and vast wind and solar resources" [5], determining that the construction of an "energy powerhouse" and the green transition toward carbon neutrality should accelerate the "clean development of fossil fuels", "scaling up of new energy", "coordinated centralized and distributed deployment", and "intelligent multi-energy management" (referred to as the "four-pronged development") [6]. The focus should be on four key scientific and technological innovation projects: clean coal engineering, oil output stabilization and gas production increase, accelerated new energy deployment, and energy efficiency and intelligent engineering. Energy development should also advance three integrated developments: the coordinated integration of fossil fuels and new energy, the integration of energy with carbon capture, utilization and storage (CCUS)/carbon capture and storage (CCS), and the integration of energy with artificial intelligence (AI). Although China is a major energy country, it is not yet an "energy powerhouse". To ensure energy security and address climate change, China must lead an energy technology revolution and build an "energy powerhouse".
This paper begins with an analysis of the global energy structure and transition trends, based on global climate change and carbon neutrality goals, incorporating China's energy resource endowment and the historical trajectory from an energy-deficient nation to a major energy country. It introduces the strategic proposition of China's "energy powerhouse" construction, explores the potential for the green transition of China's energy production and consumption structure under the carbon neutrality goal, and analyzes the historical opportunities and pathways for building an "energy powerhouse". From the perspectives of six major systems—the whole oil and gas system, whole coal and rock system, new energy system, multi-energy system, carbon cycle system, and carbon neutrality super energy system—this paper examines the complementary and integrated green development of fossil fuels and new energy, ensuring stable energy supply, carbon emissions control, and carbon removal within the framework of a carbon neutrality "whole-energy system". It proposes that China's "energy powerhouse" construction should adhere to the pathways of stable and orderly low-carbon development of fossil fuels, scaled and secure development of new energy, and integrated development of the carbon neutrality "whole-energy system", while exploring shared development of the "Belt and Road" energy corridor to achieve "energy independence" and contribute to national rejuvenation through energy development. A "three-phase" strategic pathway for achieving carbon neutrality and building an "energy powerhouse" has been formulated. By relying on "clean coal utilization, stable oil production, increased natural gas supply, and accelerated new energy development", China aims to reach the carbon peaking target in primary energy consumption and carbon emissions by 2030. Through "in-situ shale oil conversion revolution, in-situ coal heating conversion revolution, hydrogen-based industrial systems, multi-energy integrated whole-energy systems, and commercialized controlled nuclear fusion energy", China aims to achieve the strategic goal of "energy independence" by 2050. By leveraging a "new energy system, commercialized controlled nuclear fusion, improved intelligence levels, large-scale CCUS/CCS industrial systems, and shared development of the Belt and Road energy corridor", energy will become a pillar industry and growth engine of the national economy, completing the blueprint of an "energy powerhouse" by 2060 and fulfilling the "energy for national rejuvenation" vision, ensuring the timely achievement of the "carbon neutrality" strategic goal.
1. The historical context of "energy powerhouse" strategy of China
The "energy powerhouse" strategy aims to address global energy transformations, achieve carbon neutrality goals, and leverage the energy resource endowment of China to drive energy structure transition, attain energy independence, and advance toward a new phase of high-quality energy development.
1.1. Global energy structure and development trends
In 2023, global primary energy consumption reached 148.00×10⁸ toe, with coal accounting for 26.47%, oil 31.70%, natural gas 23.30%, and new energy (throughout this paper, "new energy" refers to nuclear, hydropower, and renewables) 18.53%. Meanwhile, global primary energy production totaled 150.27×10⁸ toe, with coal contributing 28.49%, oil 30.04%, natural gas 23.22%, and new energy 18.25% [2]. This marks the formation of a four-sector global energy structure dominated by coal, oil, gas and new energy [6]. Based on an analysis of the growth in global primary energy consumption from 1965 to 2023 [2], alongside current global fossil fuel reserves-to-production ratios, major countries’ progress in green energy transitions, and carbon neutrality commitments, projections for global primary energy consumption and structure over the next century are provided. The forecasts indicate that the coal development is entering a "transition period", oil development has reached a "stability period", natural gas development is in its "peak period", and new energy development has stepped into a "golden era" (Fig. 1 ).
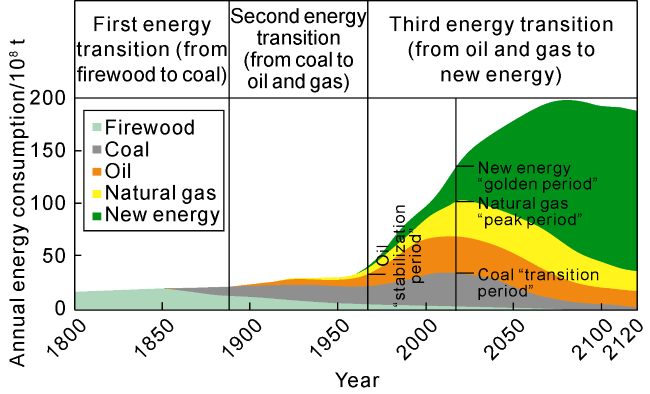
Fig. 1. Global energy development history and trends (data before 2023 based on Reference [2], projections thereafter based on comprehensive forecasts). |
The history of energy development exhibits four key characteristics: historical contribution, phased continuity, non-renewability and renewability. (1) Historical contribution. Energy has continuously driven human societal progress [7]. Human utilization of energy resources spans approximately 1×10⁴ years, with firewood as the dominant energy source for about 1×10⁴ years, coal as the primary energy source for about 80 years, oil as the dominant energy source for about 60 years to date. New energy has been utilized for approximately 5 000 years, where before the 17th century, wind, solar, hydropower, and geothermal resources were in primitive use. From the 18th to 20th centuries, it entered a technological exploration phase for these resources. Since the 21st century, they have progressed to the stage of large-scale power generation and utilization. (2) Phased continuity. The evolution of global energy follows five major systems: the primitive energy system, which supported human survival and basic development; the ancient energy system, which fueled the advancement of agricultural civilization; the modern energy system, which powered the industrial revolution and modern civilization; and the carbon-neutral green energy system, facilitating ecological civilization. (3) Non-renewability. Fossil fuels mainly including coal, oil and natural gas, etc. are finite and non-renewable. (4) Renewability. New energy sources—solar, wind, hydropower, biomass, nuclear, and tidal energy—are renewable.
Currently, the world is undergoing three major transition periods: the shift from the 5th to the 6th scientific and technological revolution, the transition from the 3rd to the 4th industrial revolution, and the transformation from fossil fuel dominance to new energy dominance. The synergistic effect of the "6th scientific and technological revolution + 4th industrial revolution + 3rd energy revolution" is accelerating the pace of the global green energy transition. A comparison of global new energy consumption and its share in total energy from 1981 to 2023 shows that in 1981, new energy consumption was 4.38×10⁸ toe, accounting for 6.6% of total energy. By 2023, new energy consumption had increased to 27.42×10⁸ toe, accounting for 18.5% [2]. This trend exhibits a fluctuating but overall increasing trajectory (Fig. 2 ).
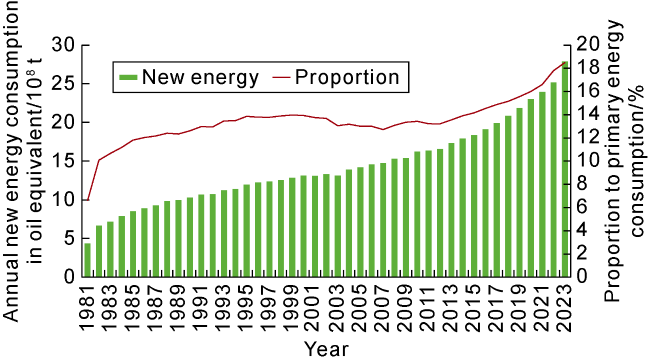
Fig. 2. Global new energy consumption and its share in total primary energy consumption [2]. |
Global clean energy consumption and production are further improved. By 2023, global consumption and production of natural gas + new energy reached 61.90×10⁸ and 62.32×10⁸ toe [2], with respective shares of 41.83% and 41.47%. This reflects the simultaneous acceleration of low-carbon development of fossil fuels, scaling up of new energy deployment, and intelligent energy management. The global energy system is rapidly evolving from the oil and gas era to the new energy era. The energy transition is long-term, complex, and inevitable.
1.2. Global climate change and carbon neutrality goals
The increasing concentration of greenhouse gases in the atmosphere has led to a long-term rise in global temperatures. According to the Global Climate report from the World Meteorological Organization [8], the global average temperature from 2014 to 2023 was 1.20±0.12 °C higher than the pre-industrial average (1850 to 1900). Observations indicate that the concentrations of CO2, CH4, and N2O—the three major greenhouse gases—reached record levels in 2023, with CO2 levels exceeding pre-industrial levels by 50%. These greenhouse gases trap heat in the atmosphere, and the global temperatures will continue to rise for many years to come due to the atmospheric lifetime of CO2.
To address global climate change, an increasing number of countries have committed to carbon neutrality goals [9]. According to statistics from the UK-based Energy and Climate Intelligence Unit, as of March 2025, 142 countries worldwide had pledged to achieve carbon neutrality [10]. Most developed countries have set their carbon neutrality targets for 2040, 2045 and 2050. China is the first developing country to pledge a carbon neutrality goal [11], aiming to peak carbon emissions before 2030 and achieve carbon neutrality before 2060.
In 2023, global greenhouse gas emissions totaled 404.18×10⁸ t of CO2 equivalent [2], with China contributing over 30% of global emissions. China is the largest greenhouse gas emitter in the world, with a diverse range of emission sources, including energy activities, industrial production, agricultural activities, waste management, land use, land-use change and forestry (LULUCF) [4]. Excluding LULUCF, China's total greenhouse gas emissions in 2005 amounted to 83.55×10⁸ t of CO2 equivalent, surpassing the United States for the first time to become the world's largest greenhouse gas emitter (Table 1 ). By 2021, the total greenhouse gas emissions (excluding LULUCF) of China had risen to 143.14×10⁸ t of CO2 equivalent [4], with energy activities accounting for 110.07×10⁸ t (76.9% of total emissions), industrial activities contributing 21.36× 10⁸ t (14.9%), agricultural activities emitting 9.31×10⁸ t (6.5%), and waste management producing 2.43×10⁸ t (1.7%). In 2021, China’s LULUCF sector absorbed 13.15×10⁸ t of CO2 equivalent, offsetting approximately 10% of total emissions, playing a crucial role in reducing net emissions.
Table 1. Composition of the greenhouse gas emissions by category in China [4] |
| Green- house gas | 2005 | 2021 | ||||||
|---|---|---|---|---|---|---|---|---|
| Including LULUCF | Excluding LULUCF | Including LULUCF | Excluding LULUCF | |||||
| CO2 equivalent/ 108 t | Proportion/ % | CO2 equivalent/ 108 t | Proportion/ % | CO2 equivalent/ 108 t | Proportion/ % | CO2 equivalent/ 108 t | Proportion/ % | |
| CO2 | 58.04 | 75.93 | 65.33 | 78.19 | 102.82 | 79.10 | 116.28 | 81.23 |
| CH4 | 13.29 | 17.39 | 13.11 | 15.69 | 16.98 | 13.06 | 16.67 | 11.65 |
| N2O | 3.82 | 5.00 | 3.82 | 4.57 | 5.57 | 4.29 | 5.57 | 3.89 |
| HFCs | 1.17 | 1.53 | 1.17 | 1.40 | 3.36 | 2.58 | 3.36 | 2.35 |
| PFCs | 0.05 | 0.06 | 0.05 | 0.06 | 0.23 | 0.18 | 0.23 | 0.16 |
| SF6 | 0.07 | 0.09 | 0.07 | 0.09 | 1.03 | 0.79 | 1.03 | 0.72 |
| Total | 76.44 | 100 | 83.55 | 100 | 129.99 | 100 | 143.14 | 100 |
1.3. Energy resource endowment of China
Based on the 2023 global primary energy production and consumption statistics [2], China ranks as the world’s largest energy consumer, largest energy producer, and largest energy importer, as well as the largest coal producer, the seventh-largest oil producer, and the fourth- largest natural gas producer. By the end of 2023, China's remaining recoverable reserves of coal, oil, and natural gas (Table 2 ) accounted for 12.39%, 1.27%, and 4.39% of global remaining recoverable reserves, respectively. The reserve-to-production (R/P) ratios for coal, oil, and natural gas stand at 36.7, 18.2 and 43.3 in China, are all significantly lower than the global R/P ratios of 139.0 for coal, 53.5 for oil, and 48.8 for natural gas [6]. China's technically exploitable wind power potential exceeds 100×108 kW, while photovoltaic power potential exceeds 450×108 kW [12], with the combined annual technically feasible electricity generation from solar and wind energy reaching 87.5×10⁸ kW·h. Developing just one-fourth of this potential could meet the peak energy demand of China, highlighting the strategic role of wind and solar resources in supporting the energy independence of China.
Table 2. Remaining recoverable reserves and reserve-to-production ratios of the World and China in 2023 [6] |
| Region | Remaining recoverable coal reserves/108 t | Coal R/P ratio | Remaining recoverable oil reserves/108 t | Oil R/P ratio | Remaining recoverable natural gas reserves/1012 m3 | Natural gas R/P ratio |
|---|---|---|---|---|---|---|
| World | 10 480.22 | 139.0 | 2 312.45 | 53.5 | 175.92 | 48.8 |
| China | 1 298.03 | 36.7 | 29.29 | 18.2 | 7.73 | 43.3 |
Given these insights, China’s energy resource endowment can be redefined by the characteristics of abundant coal, limited oil and gas, and vast wind and solar resources. This is reflected in the limited, carbon-intensive, and strategic reserve of coal resources, the scarcity, non-renewability, and irreplaceability of oil and gas resources, and the local availability, unlimited potential, and green nature of zero-carbon new energy sources.
1.4. The development of China as a major energy country
In 1949, at the founding of the People’s Republic of China, the country’s total primary energy production was only 0.2×10⁸ toe (Table 3 ), with raw coal at 0.3×10⁸ t, crude oil at 12×104 t, natural gas at 0.1×10⁸ m3, and electricity generation at 43×108 kW·h. Energy production was severely insufficient. By 2024, the total primary energy production of China reached 49.8×10⁸ toe (Table 3 ), representing a 4.6% increase from the previous year [13]. Specifically, raw coal production was 47.8×10⁸ t, crude oil 2.13×10⁸ t, natural gas 2 464.5×10⁸ m3, and electricity generation 10.09×10¹² kW·h, with year-on-year increases of 1.2%, 1.8%, 6.0%, and 6.7%, respectively. In 2024, China imported 0.54×10⁸ of raw coal, 55×108 t of crude oil, and 1 652.7×10⁸ m3 of natural gas, with external dependency rates of 10.2% for coal, 72.2% for oil, and 40.1% for natural gas [13]. Total primary energy consumption for the year was 59.6×10⁸ toe, resulting in an overall energy import dependency of 16.4%. Over the past 75 years, the energy production of China has increased by hundreds to thousands of times.
Table 3. Comparison of the primary energy production in 1949 and 2024 of China [13] |
| Production | Raw coal/ 108 t | Crude oil/ 108 t | Natural gas/ 108 m3 | Electricity generation/(108 kW•h) | Total primary energy production (standard coal)/108 t |
|---|---|---|---|---|---|
| 1949 | 0.3 | 0.001 2 | 0.07 | 43 | 0.24 |
| 2024 | 47.8 | 2.128 9 | 2 464.5 | 100 869 | 49.8 |
| Growth factor | 149 | 1 774 | 35 207 | 2 346 | 208 |
A comparison of the primary energy production from 1981 to 2023 between China and the world reveals the following trends: (1) In 1981, the primary energy production of China was 4.38×10⁸ toe, accounting for only 6.62% of the global total of 66.20×10⁸ toe. (2) By 2001, the production of China surpassed 10×108 toe, making it a major energy producer, contributing 10.76% of global production (93.77×10⁸ toe) and entering a phase of rapid growth (Fig. 3 ). (3) In 2005, the energy production of China reached 15.71×10⁸ toe, surpassing U.S. production (15.58× 10⁸ toe) for the first time. (4) By 2023, the primary energy production of China reached 34.03×1089 toe, accounting for 22.70% of the global total of 149.93×10⁸ toe. The rise of China from a small energy producer to a major energy country has been primarily driven by carbon-based fossil fuels.
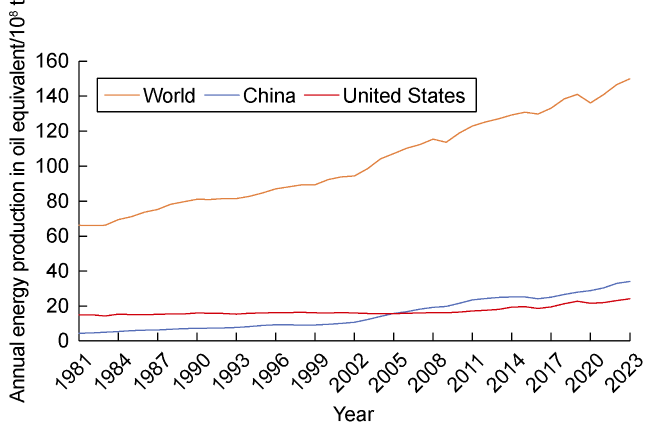
Fig. 3. The primary energy production (toe) from 1981 to 2023 [2]. |
1.5. Outlook on the energy transition of China
The energy transition of China is a long-term and arduous societal project, facing challenges such as a highly energy-intensive industrial structure, a coal-dominated energy mix, and insufficient market-driven incentives for energy transformation. China must achieve both carbon peaking and carbon neutrality within less than 40 years, amid increasingly complex international political and economic situations, recurring geopolitical conflicts, climate-related trade barriers, and difficulties in low-carbon and zero-carbon technology research and industrial collaboration. Given these uncertainties, energy transition and energy security are equally important, making China’s path to energy transformation both critical and challenging.
A comparison of the primary energy consumption of China and the world from 1965 to 2023 shows that the primary energy consumption of China surpassed 10×108 toe in 2000, followed by a rapid growth trend (Fig. 4 ). By 2023, the total primary energy consumption of China reached 40.78×10⁸ toe, equivalent to the global primary energy consumption level in 1967 (40.77×10⁸ toe).
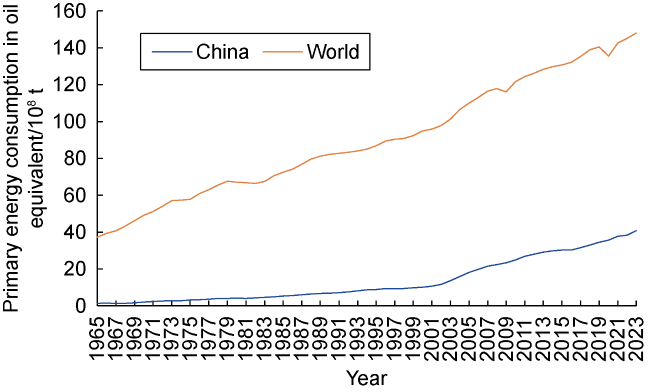
Fig. 4. The primary energy consumption of China and the world from 1965 to 2023 [2]. |
The energy consumption structure of China differs significantly from the global energy consumption structure. A comparison of the primary energy consumption structures between China and the world from 1965 to 2023 (Fig. 5 ) highlights that the energy of China mix is characterized by a high proportion of coal consumption, a lower share of oil and natural gas, and a rapidly increasing share of new energy consumption.
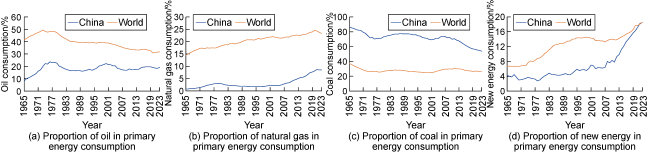
Fig. 5. Comparison of the energy consumption structure between China and the world (1965-2023) [2]. |
Green carbon neutrality is a strategic priority in China's energy transition, with a key focus on seven major sectors: energy, industry, transportation, building, ecology, technology and policy mechanisms [4]. (1) Carbon emissions of energy activities account for nearly 80% of total emissions, making them the core source of carbon emissions. The transition strategy focuses on increasing the share of new energy, technological innovation and promoting electrification. (2) The industrial sector, as the pillar of the economy of China and the second-largest source of carbon emissions, must undergo a comprehensive green transformation through technological upgrades and development of the circular economy. (3) Carbon emissions from transportation account for approximately 10%, requiring a transition through the promotion of new energy vehicles, improvement of transportation infrastructure, and the development of a green logistics system. (4) The building sector holds significant emission reduction potential, with efforts concentrated on energy-efficient retrofitting, the promotion of new sustainable buildings, and the application of clean heating technologies. (5) Ecological carbon sinks serve as an important complementary pathway toward carbon neutrality by enhancing the carbon sequestration capacity of forests, wetlands, and grasslands, achieving a balance between nature and economic development. (6) Technological innovation is a key driver for achieving carbon neutrality, emphasizing the research, application, and industrialization of green technologies. (7) Policy and market mechanisms are critical enablers of the transition, providing strong support through tax incentives, market-based instruments, and regulatory frameworks.
Looking ahead to 2060, when China successfully achieves carbon neutrality, the revolutionary green energy transformation will be characterized by the following core elements [14]: Non-fossil energy will account for over 80% of total primary energy consumption. The narrow definition of electrification rate will rise to 59%-62%, while the generalized electrification rate will increase to 79%-84%. Total electricity consumption will reach (20.0- 22.2)×1012 kW·h, with the share of electricity in terminal energy consumption reaching 68%-72%. Electricity used for hydrogen production and synthetic fuels will total (4.1-5.4)×1012 kW·h, accounting for about 21% of total electricity consumption. Total installed power generation capacity will reach (105.3-118.2)×108 kW, with installed capacity of wind and solar power totaling approximately 100×108 kW. Wind power installed capacity will be (2.95-3.46)×108 kW, and solar PV installed capacity will be (6.37-7.24)×108 kW, with distributed PV accounting for 70%. Renewable energy will account for approximately 96% of total installed power generation capacity, and 93%-94% of total electricity generation. Nuclear power and pumped storage installed capacity will reach 1.8×10⁸ kW and 3.8×10⁸ kW, respectively, while biomass power plants with CCS equipment will exceed 1.3×10⁸ kW. Green hydrogen production will reach (3.4-4.2)×108 toe, with hydrogen accounting for 12%-14% of terminal energy demand, making it China’s second-largest energy carrier. Electrochemical energy storage capacity will reach (2.4-2.8)×108 kW, and the total number of electric vehicles (EVs) will reach (480-540)×108, with a vehicle-to-grid interaction capacity of (8.1-9.0)×108 kW.
1.6. Basic standards and connotation of China as an "energy powerhouse"
Based on the global primary energy production of 150.27×10⁸ toe in 2023 [2] and the energy production levels of major countries, a benchmark value of 10×108 toe has been established by considering its proportion in global energy production and the scale threshold. A country can be classified as a major energy country if its annual primary energy production exceeds 10×108 toe. Furthermore, a country can be considered an energy powerhouse if its primary energy production exceeds 10×108 toe and surpasses its primary energy consumption. In 2023, only three countries had primary energy production exceeding 10×108 toe: China, the United States and Russia, with productions of 33.86×10⁸, 24.37×10⁸ and 13.60×10⁸ toe, respectively (Table 4 ). Their primary energy consumptions were 40.78×10⁸, 22.52×10⁸ and 7.47×10⁸ toe, respectively, resulting in production-consumption differentials of −6.92×10⁸, 1.85×10⁸ and 6.13×10⁸ toe. According to this classification, the United States and Russia qualify as both major energy countries and energy powerhouses, while China is a major energy country but not yet an energy powerhouse.
Table 4. Primary energy consumption and production of major energy countries in 2023 [2] |
| Energy category | World | China | ||||||
|---|---|---|---|---|---|---|---|---|
| Consumption/ 108 t | Share of total consumption/% | Production/ 108 t | Share of total production/% | Consumption/ 108 t | Share of total consumption/% | Production/ 108 t | Share of total production/% | |
| Oil | 46.92 | 31.70 | 45.14 | 30.04 | 7.82 | 19.17 | 2.09 | 6.17 |
| Natural Gas | 34.48 | 23.30 | 34.9 | 23.23 | 3.48 | 8.54 | 2.01 | 5.94 |
| Coal | 39.18 | 26.47 | 42.81 | 28.49 | 21.96 | 53.85 | 22.24 | 65.68 |
| Nuclear power | 5.87 | 3.97 | 5.87 | 3.90 | 0.93 | 2.28 | 0.93 | 2.75 |
| Hydropower | 9.47 | 6.40 | 9.47 | 6.30 | 2.74 | 6.71 | 2.74 | 8.09 |
| Renewables | 12.08 | 8.16 | 12.08 | 8.04 | 3.85 | 9.45 | 3.85 | 11.37 |
| Total | 148.00 | 100 | 150.27 | 100 | 40.78 | 100 | 33.86 | 100 |
| Energy Category | USA | Russia | ||||||
| Consumption/ 108 t | Share of total consumption/% | Production/ 108 t | Share of total production/% | Consumption/ 108 t | Share of total consumption/% | Production/ 108 t | Share of total production/% | |
| Oil | 8.56 | 38.01 | 8.27 | 33.92 | 1.72 | 22.99 | 5.42 | 39.85 |
| Natural Gas | 7.62 | 33.84 | 8.90 | 36.51 | 3.90 | 52.14 | 5.04 | 37.06 |
| Coal | 1.96 | 8.70 | 2.83 | 11.61 | 0.92 | 12.30 | 2.20 | 16.18 |
| Nuclear Power | 1.75 | 7.77 | 1.75 | 7.18 | 0.47 | 6.28 | 0.47 | 3.45 |
| Hydropower | 0.53 | 2.35 | 0.53 | 2.17 | 0.45 | 6.02 | 0.45 | 3.31 |
| Renewables | 2.10 | 9.33 | 2.10 | 8.61 | 0.02 | 0.27 | 0.02 | 0.15 |
| Total | 22.52 | 100 | 24.38 | 100 | 7.48 | 100 | 13.6 | 100 |
Note: Both consumption and production are measured in toe. |
To build an "energy powerhouse", China must possess world-leading capabilities in clean energy production and energy security, fully meeting the energy demands of its citizens and national defense, while supporting the growth of national power and contributing to the global transition toward green, low-carbon energy and carbon neutrality. To achieve this goal, China must develop five core capabilities: (1) strong energy technology innovation capacity; (2) robust domestic energy production capacity; (3) reliable foreign energy import security; (4) comprehensive strategic energy reserves; (5) resilient emergency energy supply security.
1.7. The historical opportunity for building an "energy powerhouse"
The energy development of China faces three major challenges: supply security, emergency security, and environmental security. Building an "energy powerhouse" would significantly enhance the country’s ability to address these energy security challenges. China is the largest energy consumer globally, with primary energy consumption reaching 40.78×10⁸ toe in 2023, while domestic production stood at 33.86×10⁸ toe, resulting in an energy self- sufficiency rate of 83.0%. This highlights significant pressure on supply security. China is also the largest energy importer, with a primary energy supply-demand gap of 6.92×10⁸ toe in 2023, primarily due to oil and natural gas shortages, creating high emergency security risks. Additionally, China is the largest global emitter of black carbon, with CO2 emissions reaching 112×108 t in 2023 [2], accounting for 32% of the global total (351×108 t), placing significant environmental security pressures on the country.
To build an "energy powerhouse", China must reassess three key global energy contexts: (1) Reevaluating the global energy supply-demand landscape, characterized by abundant coal resources, the success of unconventional oil and gas revolution, and the accelerated transition to the new energy era. (2) Reevaluating the energy resource endowment of China, defined by "abundant coal, limited oil and gas, and vast new energy potential". (3) Reevaluating the energy technology revolution, which includes breakthroughs in ultra-deep (10 000 m) oil and gas drilling, underground coal and shale in-situ conversion technologies, green electricity-hydrogen-storage integration, “artificial sun” (fusion energy), and space-based solar power utilization technologies.
By the mid-21st century, China aims to become a prosperous, democratic, culturally advanced, harmonious, and beautiful modern socialist country. To achieve this, the 20th National Congress of the Communist Party of China (CPC) proposed 10 major national development goals [15], and construction of "Healthy China" and "Digital China": (1) Building a strong nation in education, science and technology, talent, culture, sports and health, significantly enhancing national cultural soft power. (2) Accelerating the development of strong manufacturing sector, high-quality economy, aerospace leadership, advanced transportation, robust cyber infrastructure and digital economy, fostering a modernized industrial system. However, the concept of an "energy powerhouse" was not explicitly mentioned in the report. Given the finite nature of non-renewable carbon-based energy and the unlimited potential of renewable zero-carbon energy, China must leverage the new energy revolution to build a powerful energy security system and accelerate its transformation into a "super energy powerhouse". Achieving energy independence by 2050 would provide the energy and power for China's modernization and national rejuvenation, representing a historic opportunity for energy professionals to serve the nation.
Amid global climate change, green energy transition, and rising geopolitical conflicts, building an "energy powerhouse" would enhance China's resilience against risks, strengthen energy security, and provide robust support for national development and economic growth. Accelerating the construction of an "energy powerhouse" is a historic opportunity for China to achieve socialist modernization and national rejuvenation.
2. Carbon-neutral "whole-energy system"
The carbon-neutral "whole-energy system" is a highly integrated energy framework that incorporates fossil fuels, new energy sources, and carbon neutrality technologies through multi-energy complementarity and integration. Guided by the "six-system perspective", this development model aims to achieve green, efficient, and low-carbon energy development, ultimately meeting the carbon neutrality goal.
2.1. Connotation and classification of the "whole-energy system"
The energy systems are mainly divided into single-energy systems, multi-energy systems, and whole-energy systems. The concept of an whole-energy system refers to a system in which all energy sources above and below the ground (primary energy sources such as coal, oil, natural gas, geothermal energy, wind energy, and solar energy, as well as secondary energy sources such as electricity and hydrogen energy) are orderly formed or superimposed and distributed, and can be intelligently developed and utilized in a coordinated and integrated manner.
Single-energy systems focus on the exploration, development, processing, utilization, transformation, and supply of a single energy source (such as oil, natural gas, coal, wind, or solar energy). These systems are structured around a specific energy type, forming a complete industrial chain for its production and utilization, such as the petroleum energy system, coal energy system, or solar energy system. Multi-energy systems integrate multiple energy sources (e.g., oil + natural gas + wind + solar, or coal + wind + solar) to form a coordinated energy exploration and development, processing, utilization, transformation, and supply network. The key to this system lies in integrating and optimizing multiple energy types, dynamically adjusting the co-development and complementary utilization of different energy sources to improve efficiency, reduce costs, and enhance reliability and flexibility. Whole-energy systems aim to achieve deep integration of underground fossil fuel resources (such as coal, oil, natural gas, geothermal energy, and associated minerals) with above-ground renewable energy sources (such as wind and solar power) to create a regional intelligent energy system. These systems leverage CCUS/CCS and carbon sinks to achieve carbon neutrality[16], ensuring that energy production and consumption are carbon-neutral.
2.2. Development model of the "whole-energy system"
The "whole-energy system" integrates underground fossil fuel extraction and utilization, above-ground new energy development, and underground CCUS/CCS carbon storage, achieving a regional balance between energy- related carbon emissions and underground carbon sequestration for carbon neutrality. The development model of the whole-energy system is based on the "six-system perspective": Whole oil & gas system, coordinated development of conventional and unconventional oil and gas resources; Whole coal & rock system, integrated surface and underground clean coal utilization; New energy system, coordinated development of primary and secondary renewable energy sources; Multi-energy system, smart integration of fossil fuels and new energy sources [17]; Carbon cycle system, CO2 generation, utilization and storage; Carbon-neutral super-energy system, green and sustainable development of both fossil fuels and new energy.
3. Pathways and measures for China to become an "energy powerhouse"
3.1. Steady and orderly low-carbon development of fossil energy
In 2023, the coal, oil, and natural gas production of China reached 22.24×10⁸, 2.09×10⁸, and 2.01×10⁸ toe, accounting for 65.66%, 6.17%, and 5.95% of total primary energy production, respectively. Consumption of coal, oil, and natural gas stood at 21.96×10⁸, 7.82×10⁸, and 3.48×10⁸ toe, making up 53.85%, 19.18%, and 8.53% of total primary energy consumption. Fossil fuels accounted for 77.78% of energy production and 81.56% of energy consumption, underscoring their critical role in the current energy structure of China. Over the near term, coal will remain the backbone of energy security, oil will maintain as a stable strategic role, and natural gas will serve as a transitional bridge from fossil fuels to new energy. On the path to building an "energy powerhouse", China must adhere to the "clean coal utilization and carbon reduction, stable oil production and increased gas supply" strategy for a steady and orderly low-carbon transition [18]. This requires enhancing oil and gas exploration and development efforts, strengthening domestic supply security, and expanding unconventional oil and gas resources, which serve as key enablers.
The unconventional oil and gas revolution has led to six key breakthroughs. The industrialized development of shale, coalbed, and tight oil and gas, has overcome the traditional assumption that only conventional source rocks can generate hydrocarbons. Discovery of micro- and nano-scale pore-throat reservoir systems has broken the lower limit of oil and gas migration and accumulation observed in conventional reservoirs. Identification of “continuous-type” sweet spots has challenged the classical model of isolated hydrocarbon traps in conventional reservoirs. Multi-lateral horizontal well stimulation and large-scale fracturing has surpassed traditional technics of natural depletion development in vertical wells. Integrated geoscience and engineering for cost-effective development has shifting away from fragmented, discipline-specific management approaches. "Super basin" concept for total energy resource assessment has expanded beyond traditional oil and gas-focused exploration strategies in the carbon neutrality era.
While fossil fuels are non-renewable, the unconventional oil and gas revolution can extend the life cycle of the petroleum industry, enabling over 100 years of global oil and gas development. Over the past 165 years, the global oil industry has evolved, with revolutionary breakthroughs in unconventional resources over the last decade leading to industrial-scale development. Technological advancements in unconventional oil and gas extraction are driving a structural transformation in the global petroleum industry, establishing an integrated system that merges conventional and unconventional oil and gas development. The strategic significance of this revolution lies in unlocking new energy resources, reshaping the global oil and gas supply-demand landscape, and extending the life cycle of the petroleum industry, thus enabling a more sustainable and integrated multi-energy future.
China has intensified efforts in unconventional oil and gas revolution and increasing oil and gas reserves and production, leading to a breakthrough in 2024, with domestic crude oil output reaching 2.13×10⁸ t and natural gas production hitting 2 464×108 m3. Total oil and gas production exceeded 4×10⁸ toe for the first time [19], marking eight consecutive years of ten-million-ton-level growth. In 2024, China’s unconventional oil and gas production totaled 1.1×10⁸ toe, accounting for 27% of total oil and gas output. Unconventional natural gas production reached 1 077×108 m3, making up 44% of total natural gas production, while unconventional oil production stood at 2 450×108 t, or 12% of total oil output. Specifically, in 2024, China produced 682×108 m3 of tight sandstone gas, 257×108 m3 of shale gas, 138×108 m3 of coal bed (coal rock) gas, 600×104 t of shale oil, 150×104 t of oil shale-derived oil, 1 700×104 t of heavy oil. PetroChina Company Limited (hereinafter referred to as "PetroChina") provides a prime example of this unconventional oil and gas expansion. In 2024, PetroChina’s unconventional oil and gas output reached 7 169×104 toe, accounting for 30.8% of its total oil and gas production (Table 5 ), exceeding the share 27% of global unconventional oil and gas in 2023. Unconventional oil production totaled 1 691×104 t, making up 15.9% of total crude oil output (Table 6 ). Unconventional natural gas production reached 687×108 m3, representing 43.3% of total natural gas output (Table 7 ).
Table 5. Composition of the oil and gas production of PetroChina in 2024 |
| Oil and gas category | Production equivalent/104 t | Percentage of total/% |
|---|---|---|
| Conventional | 16 087 | 69.2 |
| Unconventional | 7 169 | 30.8 |
| Total | 23 256 | 100 |
Table 6. Composition of the PetroChina oil production in 2024 |
| Oil category | Production Equivalent/104 t | Percentage of total/% | |
|---|---|---|---|
| Conventional | 8 924 | 84.10 | |
| Unconventional | Shale oil | 510 | 4.80 |
| Tight oil | 1 181 | 11.10 | |
| Subtotal | 1 691 | 15.90 | |
| Total | 10 615 | 100 | |
Table 7. Composition of the PetroChina natural gas production in 2024 |
| Natural gas category | Production equivalent/104 t | Percentage of total/% | |
|---|---|---|---|
| Conventional | 899 | 56.68 | |
| Unconventional | Tight gas | 474 | 29.89 |
| Shale gas | 153 | 9.65 | |
| Coalbed methane | 37 | 2.33 | |
| Coal rock gas | 23 | 1.45 | |
| Subtotal | 687 | 43.32 | |
| Total | 1 586 | 100 | |
The unconventional oil and gas industry of China is evolving from near-source tight sandstone and limestone oil and gas to in-source shale [20-21] and coal rock oil and gas. A breakthrough in coal rock gas extraction [22] has positioned coal rock gas as a "dark horse" in the unconventional oil and gas sector. PetroChina has established the world's first coal rock gas field in the Ordos Basin, with proven reserves of 3 366×108 m3 and estimated reserves exceeding 1×10¹² m3. In 2023, production reached 10×108 m3, achieving in just two years what shallow coalbed methane took a decade to accomplish.
China is advancing in-situ oil and gas conversion from underground shale and coal rocks, aiming for a dual oil and gas revolution by transforming high-carbon fossil fuels (such as organic matter in coal and shale) and heavy oil into light crude oil and natural gas, facilitating a low-carbon transition for fossil energy. (1) The coal rock oil and gas revolution of China seeks to heat and process underground coal seams in situ into oil and gas, with global geological resource estimates of (5-61)×1016 m3 and China’s estimated resource of (280-330)×1012 m3 [23]. PetroChina has developed a comprehensive suite of exploration, development, engineering and surface facility technologies. (2) The continental shale oil revolution of China aims to heat immature shale in situ and convert its organic matters into hydrocarbons, and upgrade heavy oil into light crude oil and natural gas. The global recoverable shale oil resource is estimated at 1.4×10¹² t, with the recoverable reserves of (700-900)×108 t of China. Simulated experimental results suggest that the Ordos Basin could yield approximately 450×108 t of shale oil and 30×1012 m3 of natural gas through in-situ conversion technology [24].
3.2. Achieving large-scale, economically secure development of new energy
New energy is a strategic pillar in the pursuit of an "energy powerhouse" of China, an inevitable choice and a necessary pathway for energy security and sustainability. It is crucial to recognize that the energy powerhouse vision of China depends on the robust new energy strategy. To build an "energy powerhouse", China must foster multi-type new energy development and integration, technological advancements and cost reductions, forming synergistic and competitive energy development model. Key new energy sources include wind, solar, hydropower, hydrogen, geothermal, nuclear, ocean energy and controlled nuclear fusion.
China has made revolutionary progress in wind and solar energy, achieving global leadership in technology, installed capacity and generation output. The country has entered the "wind-solar era". As of December 2024, the cumulative installed capacity of solar power in China reached approximately 8.87×10⁸ kW, while wind power installed capacity stood at 5.21×10⁸ kW, bringing the combined installed capacity of wind and solar to 14.08×10⁸ kW [25], accounting for 42% of the nation’s total installed power generation capacity of 33.49×10⁸ kW. In 2024, total electricity generation reached 100 868.8×10⁸ kW·h, with a year-on-year increase of 6.7% [13]. The electricity generation from thermal power, hydropower, nuclear power, wind and solar stood at 63 742.6×10⁸, 14 256.8× 10⁸, 4 508.5×10⁸, 9 970.4×10⁸ and 8 390.4×10⁸ kW·h, respectively. Compared to 2023, electricity generation increased by 1.7%, 10.9%, 3.7%, 12.5% and 43.6%, with wind and solar accounting for a combined 18 360.8×10⁸ kW·h, representing 18.2% of total electricity generation. During the construction of "energy powerhouse" of China, wind and solar energy will play a decisive role. To further increase wind and solar power generation, China must enhance installed capacity in the Three-North Region (North, Northeast, and Northwest China) and desert- gobi-arid zones, expand offshore wind power installed capacity, so as to achieve larger-scale and more cost-effective wind-solar energy development. Increase the share of wind and solar in China’s total installed power capacity and power generation capacity, elevate the proportion of wind and solar green power in power grid, and develop space-based solar power stations to explore new energy acquisition methods.
Wind and solar energy are inherently intermittent and variable, posing challenges to power grid stability. Energy storage technology is the key for mitigating new energy instability and balancing energy systems. By smoothing out fluctuations, increasing energy utilization efficiency, enhancing system flexibility, and supporting distributed energy networks, storage technologies will be essential for achieving China’s energy transition and carbon neutrality goals. Through technological innovation, policy incentives, and market mechanisms improvement, energy storage will play an increasingly critical role in modern energy systems.
Hydrogen energy, with its zero-carbon emissions, high energy conversion flexibility, and compatibility with multiple energy carriers, is an essential component of future clean energy systems [26]. It can facilitate the utilization of renewable energy, while enhancing the stability and security of the energy system. Based on hydrogen source and carbon emissions during producing, hydrogen is classified into green, gray, blue, gold, cyan, and orange hydrogen (Fig. 6 ). Green hydrogen is produced using renewable energy, generally with electrolysis of water using wind or solar power. Gray hydrogen is generated by burning fossil fuels, with CO2 emissions released into the atmosphere. Blue hydrogen is similar to gray hydrogen but with CCUS technologies to reduce greenhouse gases emission such as CO2. Gold hydrogen (white hydrogen) is naturally occurred in the Earth's crust. Cyan hydrogen is produced from underground coal bed through manual intervention, where water and coal interact under controlled temperature and pressure to generate hydrogen. Orange hydrogen is formed by injecting water and catalysts into specific reactive geological formations, where iron oxide in rocks reacts to release hydrogen, which is then collected via recovery wells.
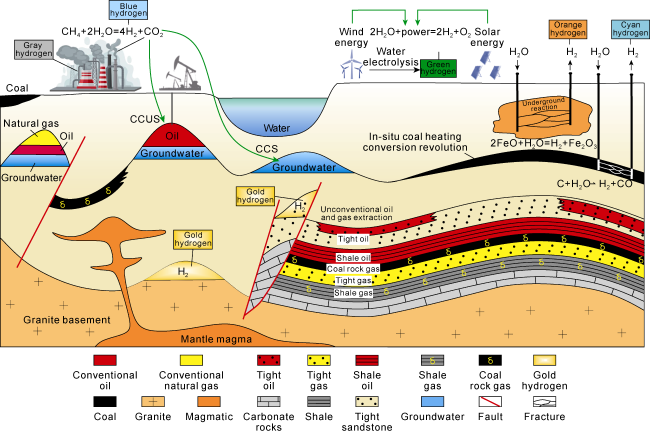
Fig. 6. Hydrogen types and formation mechanisms. |
Since 1671, when Robert Boyle first collected hydrogen from the reaction of dilute sulfuric acid and iron, the global development of hydrogen energy has spanned 350 years, transitioning from hydrogen gas to hydrogen energy and now toward a green hydrogen industry. In 2020, China’s Energy Law officially recognized hydrogen as an energy carrier [27]. In 2022, the National Development and Reform Commission (NDRC) and the National Energy Administration (NEA) jointly issued the Medium- and Long-Term Plan for Hydrogen Energy Industry Development (2021-2035) [28], outlining the fundamental principles, phased development goals, and key measures for the high-quality development of China’s hydrogen industry. China has established three major hydrogen industry clusters in the Yangtze River Delta, Guangdong-Hong Kong-Macao Greater Bay Area, and Beijing-Tianjin-Hebei region, with over 500 large-scale enterprises across the whole hydrogen energy industry chain. Hydrogen energy has been planned to a national energy strategy, solidifying its role in China’s future energy system. The "green hydrogen industry" is the natural extension of the oil and gas industry, serving as a decarbonization carrier for petrochemical and coal chemical sectors, a large-scale accommodation carrier for renewable energy, and a key technology for grid balancing and peak shaving. As part of the "energy powerhouse" strategy of China, the country must develop large-scale green hydrogen production bases, akin to underground natural gas fields, and establish a green hydrogen industrial chain integrating "aboveground production + underground storage + blending & transport + multi-purpose utilization".
The new energy vehicle (NEV) market has experienced exponential growth in China. In 2024, 1 125×104 new NEVs were registered, accounting for 41.83% of all new vehicle registrations, an increase of 382×104 vehicles (51.49%) compared to 2023. As of December 2024, the total number of NEVs in China reached 3 140×104, making up 8.90% of the national vehicle fleet, of which pure electric vehicles (EVs) accounted for 2 209×104 (70.34% of all NEVs) [29]. To become an "energy powerhouse", China must intensify efforts to develop NEV technologies, enhance policy support, and increase the share of NEVs in the overall transportation sector.
On January 20, 2025, China achieved a major breakthrough in nuclear fusion technology with the EAST (Experimental Advanced Superconducting Tokamak) device, also known as the "Artificial Sun" of China, accomplishing the world’s first steady-state long-pulse high-confinement plasma operation at 1×10⁸ °C for 1 066 s [30]. This milestone marks a significant leap from fundamental scientific research to engineering applications, accelerating the realization of commercial fusion power. The nuclear fusion research of China is the most advanced in the world, with commercial fusion power projected to enter households by 2049 [30].
New energy is both a traditional energy resource and a strategic tool for achieving carbon neutrality, playing a pivotal role in energy transition, energy security, energy independence, and the development of an energy powerhouse. The new energy installed capacity has been growing rapidly in China. By December 2024, the total installed capacity of new energy sources reached 19.05× 10⁸ kW, accounting for 57% of total power capacity [25], among which solar power accounted for 8.87×10⁸ kW, wind power accounted for 5.21×10⁸ kW; hydropower accounted for 4.36×10⁸ kW, nuclear power accounted for 0.61×10⁸ kW. To build an "energy powerhouse", China must accelerate the large-scale economic development of wind, solar and hydrogen energy, ensure stable growth in hydropower, nuclear and geothermal energy, and actively explore marine energy and controlled nuclear fusion. A multi-energy complementary integration model must be established to enhance sustainability and energy security.
3.3. Integrated development of the carbon-neutral "whole-energy system"
The carbon-neutral "whole-energy system" represents the integrated development of fossil fuels and new energy, utilizing CCUS/CCS and carbon sequestration technologies to achieve a regional carbon-neutral smart energy system balancing the carbon emission and underground carbon sequestration (Fig. 7 ). In the "energy powerhouse" strategy, "whole-energy system" with energy production and carbon-neutrality can be established in traditional oil and gas basins through an integrated "coal + oil + natural gas + new energy + CCUS/CCS" development model. This approach enables regional carbon neutrality, strengthens energy supply security, and establishes a "three-fusion" development framework encompassing multi-energy integration, carbon neutrality integration and smart energy integration. This framework supports the "dual carbon" goals, fosters a modern energy industry system, and accelerates regional green and sustainable development.

Fig. 7. The integrated development model for fossil fuels and new energy. |
The Ordos Basin offers significant locational advantages, with abundant fossil and new energy resources [16,31] and a well-matched CO2 source-sink distribution, making it an ideal candidate for a world-class energy production and carbon-neutral basin. As a representative case of the whole-energy system, the Ordos Basin provides a blueprint for transforming traditional oil and gas basins into integrated energy hubs. Establishing the world’s first carbon-neutral whole-energy system in Ordos would redefine energy exploration and development paradigms, marking a major milestone in the global energy revolution under the carbon neutrality agenda.
3.4. Shared development of the “Belt and Road” energy corridor
Countries participating in the Belt and Road Initiative (BRI), especially emerging economies and developing nations, generally face challenges such as high dependence on fossil fuels, rapid energy demand growth, and relatively underdeveloped technology and industrial capacity. These issues place significant pressure on their efforts to combat climate change, drive energy transitions, and achieve economic development.
China has proposed the construction of the Silk Road Economic Belt and the 21st Century Maritime Silk Road, aiming to promote high-quality and green development under the BRI framework. This initiative serves as the strategic contribution of China to global energy transitions and climate governance, demonstrating China’s responsibility as a major power and its commitment to global sustainable development. In 2022, the Chinese government released the Opinions on Promoting Green Development in the Belt and Road Initiative [32], further guiding the overseas energy investments of China toward green and low-carbon sectors. As of today, China has collaborated with over 100 countries and regions on green energy projects, with investments in green and low-carbon energy surpassing traditional fossil energy investments [33]. This shift not only underscores the determination of China to optimize the global energy structure but also provides strong momentum for partner countries in achieving their green transition goals.
During the high-quality green energy development of the Belt and Road Initiative in the future, China will align its cooperation strategies with the resource endowments and energy needs of participating countries, leveraging its strengths in green technology, ultra-high-voltage (UHV) power transmission, green financing, and engineering expertise to foster comprehensive and multi-level energy cooperation. China will rely on the abundant wind and solar energy resources of BRI partner countries to lead the construction of a green energy network across the Belt and Road region. This system will not only provide stable and cost-effective green energy supply to participating countries but also enable them to benefit from energy trading mechanisms, ensuring mutual benefit and win-win cooperation. By developing this green energy network, China can help partner countries gain competitive advantages in the green economy and accelerate their energy transition. This initiative represents a significant step in promoting global energy sustainability and is a strategic pathway for China to achieve its "energy powerhouse" vision.
3.5. “Three-stage” strategic path of building an “energy powerhouse”
The evolution of the energy system in China follows a structured transition: from the "impossible triangle" of fossil energy to the "achievable triangle" of a modern energy system [34], then to the "sustainable triangle" driven by the energy transition revolution. Through the synergistic development of resource chains, innovation chains, industrial chains, and value chains, this transformation advances toward the "energy golden triangle"—a model integrating technological revolution, dual carbon goals, and energy transition under green energy development. These four energy triangles (Fig. 8 ) enrich the energy triangle theory [5,35]. The energy transition revolution is propelled by a four-wheel drive approach: energy economy + energy security as the front wheels, ensuring feasibility; and technological innovation + dual carbon goals as the rear wheels, accelerating progress. This process leads to the formation of a new energy "achievable triangle", which may potentially resolve the "impossible triangle" of traditional fossil fuels. Under the energy revolution, the "sustainable triangle" ensures continuous energy production that meets demand. With green energy development, the "energy golden triangle" enables whole-energy system integration and green carbon-neutral growth, establishing China as a "super energy powerhouse". On the journey toward "energy independence" of China [36], the focus is on the interconnections and development of green energy transition, energy security, energy economy and carbon neutrality goals. The impossible triangle, achievable triangle, sustainable triangle, and energy golden triangle collectively illustrate the complexity, long-term nature, and inevitability of China’s energy independence strategy.
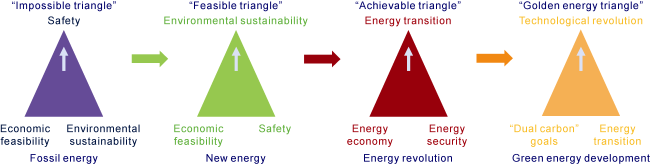
Fig. 8. The four "energy triangles" in the "energy triangle" theory (modified from Reference [5]). |
The three-stage strategic pathway toward achieving its "dual carbon" goals, energy independence, energy powerhouse status, and national energy development is formulated based on the current energy structure and development trends, with a scientific projection of energy demand for future economic growth and energy development situation, while aligning closely with the goal of building a modern socialist country (Table 8 ). Carbon-based fossil energy has supported China in becoming a major energy country, while zero-carbon clean energy will be the foundation for China to become an energy powerhouse. The energy strategy of China must adhere to the principles of "technology-driven development, clean coal and carbon reduction, stable oil production and increased gas supply, strong growth of new energy, and intelligent energy integration".
Table 8. The China carbon peaking and carbon neutrality goals and strategic pathway to building an "energy powerhouse" |
| Stage | Strategic pathway | Strategic goal | Key technologies |
|---|---|---|---|
| Stage 1 (2025- 2030) | Steady development and low-carbon, clean utilization of fossil energy, accelerated new energy growth, achieving peak primary energy consumption and carbon emissions. | Carbon peaking | (1) Establishment of a clean coal utilization industry chain; (2) Breakthroughs in stable production and enhanced recovery of conventional oil and gas; (3) Industrialized extraction of shale oil and gas; (4) Basic establishment of the hydrogen energy industry chain; (5) Large-scale deployment of renewable energy and nuclear power; (6) Major breakthroughs in controlled nuclear fusion engineering practices. |
| Stage 2 (2031- 2050) | Large-scale, economically efficient development of new energy, increased self-sufficiency in oil and natural gas to secure levels, and the establishment of a multi-energy integrated whole-energy system. | Advancing toward energy independence by 2050 | (1) Industrial-scale in-situ heating conversion of shale oil; (2) Completion of whole-energy system combining wind, solar, thermal, hydrogen, and storage; (3) Industrial-scale in-situ heating conversion of coal; (4) Establishment of hydrogen energy industrial system; (5) Development of full-scale industrial CCUS/CCS system; (6) Controlled nuclear fusion enters household applications. |
| Stage 3 (2051- 2060) | New energy becoming the dominant energy source, with fossil fuels shifting primarily to raw material use, and the shared development of the "Belt and Road" energy corridor. | Carbon neutrality, establishing an energy powerhouse and achieving national energy development | (1) Completion of a new energy system; (2) Commercialization of controlled nuclear fusion; (3) Leadership in energy-saving technologies and smart energy management; (4) New energy accounting for over 80% of total energy production; (5) Full-scale industrialization of CCUS/CCS. |
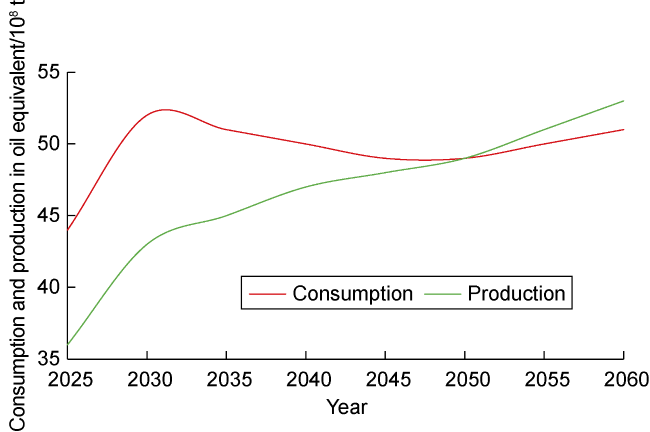
Stage 1 (2025-2030): Peak primary energy consumption and achieving "carbon peaking". During this phase, fossil energy will undergo steady development with a focus on low-carbon and clean utilization, while new energy expansion accelerates. China will implement the strategic plan of "clean coal utilization, stable oil production, increased natural gas supply, and accelerated new energy development". The oil and gas industry of China will continue making breakthroughs in eight "restricted zones": Breaking the oil generation barrier - advancing continental oil generation theory; Breaking the reservoir barrier - unlocking nano-scale pores; Breaking the exploration barrier - discovering oil and gas within source formations; Breaking the development barrier - developing artificial hydrocarbon reservoirs; Breaking the theoretical barrier - establishing the continuous accumulation model; Breaking the technological barrier - achieving ultra-deep (10 000 m) exploration and drilling; Breaking the management barrier - implementing the "one full, six transformations" model [37-39]; Breaking the sustainability barrier - transitioning to new energy development while ensuring stable oil and gas industry growth. Key technological priorities include developing clean coal utilization technologies and establishing an industrial chain, achieving breakthroughs in stable production and enhanced recovery of conventional oil and gas, scaling up industrialized extraction of shale oil and gas, establishing the hydrogen energy industry chain, and large-scale deployment of renewable energy and nuclear power. By 2030, China’s primary energy production is expected to reach 43×108 toe, while primary energy consumption will peak at 52×104 toe, achieving carbon peaking (Fig. 9 ).
Fig. 9. Prediction of the energy production and consumption in China. |
Stage 2 (2031-2050): The energy production of China will match its consumption for the first time, marking a significant step toward energy independence. The large-scale, economically efficient development of new energy will accelerate, while oil and natural gas self-sufficiency rates rise to secure levels. A multi-energy integrated whole-energy system will be essentially completed. The focus will intensify on technological innovation, with commercial viability serving as the ultimate measure of technological success. Rapid transformation of the innovation chain into industrial and value chains will enable China to transition from the "resource-driven" fossil fuel era to the "technology-driven" new energy era. Key breakthroughs include: the "coal rock oil and gas revolution", achieving in-situ heating and conversion of underground coal into oil and gas; the "continental shale oil revolution", enabling in-situ thermal maturation of immature shale into oil and gas. These advancements are expected to increase the oil and natural gas self-sufficiency rate of China to over 80%, potentially reaching full self-sufficiency. The hydrogen energy industrial system will be fully established, CCUS/CCS will evolve into an industrial-scale system, and the carbon-neutral whole- energy system integrating wind, solar, thermal, hydrogen, and storage will be completed. New energy will account for over 50% of the energy mix, ensuring a stable and secure energy supply while achieving continuous reductions in carbon emissions. Controlled nuclear fusion technology will achieve revolutionary industrial-scale breakthroughs. Primary energy consumption is expected to stabilize at 49×108 toe, with primary energy production reaching 49×108 toe by 2025 (Fig. 9 ). For the first time, the energy production of China will meet its consumption, marking full energy independence.
Stage 3 (2051-2060): Strive to achieve "carbon neutrality" and build a powerful energy country. Fossil energy will return more to its raw material nature, with new energy production taking the dominant position. The proportion of new energy production will exceed 80%. Controllable nuclear fusion will achieve industrialization, energy-saving technologies and intelligent levels will be leading, and a large-scale industrial system of CCUS/CCS will be formed. The goal of carbon neutrality will be achieved in 2060. An energy belt of the Belt and Road Initiative will be established, and new energy will provide green energy for the countries along the Belt and Road Initiative through the energy network system. It is estimated that the primary energy consumption will be 5.1 billion tons of oil equivalent, and the primary energy production will be 5.3 billion tons of oil equivalent (Fig. 9 ). The production will exceed the consumption, a "powerful energy country" will be built, and the mission of "serving the country with energy" will be realized.
4. Strategic significance of building an "energy powerhouse"
The construction of an "energy powerhouse" is a strategic choice for China to achieve energy security, carbon neutrality and modernization, and also an important initiative for contributing the wisdom and solutions of China to global energy transition and sustainable development. Through this strategy, China will play a greater role in global energy governance and contribute to building a shared future for humanity.
4.1. A fundamental measure to ensure national energy security
Building an "energy powerhouse" is a fundamental strategic initiative to ensure national energy security. Energy security is the cornerstone of a steady development of national economy, yet the high dependence on foreign oil and gas imports remains a key challenge. Through the construction of an "energy powerhouse", China aims to gradually achieve "energy independence" and significantly enhance its energy self-sufficiency. Specifically, this will be accomplished by expanding clean energy development (solar, wind, etc.) to optimize the energy mix and reduce dependence on fossil fuels; and advancing technological innovations and improving resource efficiency to increase self-sufficiency rates of domestic oil, gas and coal. These measures will fundamentally meet China’s energy demand, providing a stable and sustainable energy foundation for high-quality economic and social development.
4.2. Driving carbon neutrality goals
Building an "energy powerhouse" is a core pathway for China to tackle global climate change and achieve carbon neutrality. China is accelerating energy structure adjustments through the large-scale deployment of renewable energy and low-carbon technologies, actively fulfilling its climate commitments. Significant progress has been made in CCUS/CCS technologies. By 2060, China is expected to sequester (10-20)×108 t of CO2 annually through depleted oil and gas reservoirs and saline aquifers [16,40]. As a key decarbonization technology for traditional energy, the large-scale deployment of CCUS/CCS will be influenced by economic feasibility, policy support, and technological maturity—with carbon taxes and carbon trading policies playing a crucial role. Under a carbon trading system, CO2 emissions reduced through CCUS/CCS can be converted into tradable carbon credits, generating additional revenue and enhancing the economic viability of CCUS/CCS projects. This will accelerate the widespread adoption of CCUS/CCS, supporting the decarbonization of fossil fuels and the achievement of carbon neutrality. Additionally, as new energy gradually becomes the dominant energy source, rapid advancements and widespread applications of low-carbon technologies and the integration of AI into energy optimization, efficiency enhancement, technological innovation, and emissions reduction strategies will help China meet its carbon neutrality goal on schedule. This not only demonstrates the contribution of China to global climate governance but also provides a model for the global green energy transition.
4.3. Supporting the construction of a modern socialist powerhouse
Building an "energy powerhouse" is a critical support mechanism for the modernization efforts of China. The energy technology revolution is the key driver for achieving the goal of an energy powerhouse. China is making breakthroughs in cutting-edge technologies of unconventional oil and gas extraction, renewable energy innovations, and controlled nuclear fusion, significantly enhancing its global competitiveness in energy technology. These technological revolutions will not only strengthen the influence of China in the global energy market but also expand its role in international energy governance. Through independent energy technology innovation and international cooperation, China will provide strong energy security and technological support for modernization and economic development.
4.4. Providing the solutions of China for global energy transition and green earth development
The construction of an "energy powerhouse" offers a replicable "China’s solution" for global energy transition and green development. China has achieved significant breakthroughs in renewable energy expansion, energy storage technologies, smart grids, and hydrogen energy. At the same time, China is actively promoting the BRI green energy cooperation through green finance, policy support, and international collaboration, contributing to global carbon neutrality goals. Additionally, China’s advancements in electric vehicles and green transportation, ecological restoration and environmental protection, green consumption and energy efficiency, carbon reduction and sustainable practices offer valuable insights for global sustainable development, particularly for developing countries. These experiences demonstrate China’s commitment as a responsible global power, contributing to the global energy transition and sustainable future.
5. Conclusions
The global energy structure has evolved into a four-sector landscape dominated by coal, oil, natural gas, and new energy. The consumption and production of clean energy have been steadily increasing each year, accelerating the global transition from the oil and gas era to the new energy era. However, the energy structure of China significantly differs from the global trend due to its unique resource endowment of "abundant coal, limited oil and gas, and vast wind and solar potential". Additionally, coal consumption accounts for over half of the energy mix of China, with relatively low shares of oil and gas and a rapidly increasing share of new energy consumption. These characteristics indicate that the energy transition and path of China toward energy independence remain long and challenging.
The core concept of the whole-energy system lies in the orderly superposition and coordinated integration of all primary and secondary energy sources, both aboveground and underground, enabling intelligent development and utilization. The development model of this system is based on six key perspectives: whole oil & gas system, whole coal & rock system, new energy system, multi-energy system, carbon cycle system, carbon-neutral super-energy system.
To build an "energy powerhouse", China must adhere to the strategic approach of "technology-driven development, clean coal and carbon reduction, stable oil production and increased gas supply, strengthened new energy growth, and intelligent energy integration". While carbon-based fossil fuels have enabled China to become a major energy country, zero-carbon clean energy will be the foundation for China to become an energy powerhouse. China must steadily and orderly advance the low-carbon development of fossil fuels, while recognizing that only through large-scale, economic and safe development of new energy can achieve its energy powerhouse vision. The key is to develop an integrated carbon-neutral “whole-energy system” model based on multi-energy integration, dual carbon synergy, and intelligent energy fusion, and to lead the shared development of a high-quality green energy corridor under the Belt and Road Initiative.
The pathway of China to achieving carbon neutrality by 2060 and fulfilling its mission of national energy development involves three strategic stages: Stage 1 (2025-2030): Primary energy consumption is expected to peak at 52× 108 toe by 2030, achieving carbon peaking. Stage 2 (2031- 2050): Primary energy production is projected to match consumption at 49×108 toe by 2050, marking the transition toward energy independence. Stage 3 (2051-2060): New energy will account for over 80% of total energy production, and primary energy production will surpass consumption, establishing China as an "energy powerhouse" and achieving carbon neutrality by 2060.
China is currently a major energy country but not yet an energy powerhouse. Its energy development faces three major challenges: supply security, emergency security and environmental security. The construction of an "energy powerhouse" is a fundamental strategy to ensure national energy security, enhance risk management capabilities, and achieve carbon neutrality. It will provide the energy foundation for the socialist modernization of China, support national rejuvenation, and contribute the solutions of China to global energy transitions and sustainable development.