

Introduction
The rock structure of sandstone reservoirs refers to the size, shape, and spatial arrangement of rock particles, which can reflect the hydrodynamic conditions during sandstone formation. The evaluation of sandstone rock structure mainly involves the particle size, roundness, contact mode, and cementation type. The existing rock structure evaluation methods can be categorized into three types: visual observation, experimental analysis, and image analysis. For image analysis, scanning equipment such as microscopes is used to obtain core images by which the rock structure is analyzed. It is more quantitative than visual observation and more economical than experimental analysis, making it a commonly used method for rock structure analysis.
Current image analysis of rock structure mainly relies on traditional image processing algorithms, which extract rock particle edges based on pixel values and grayscale, but cannot identify particle category attributes. This approach has the following limitations. (1) The existing particle size analysis methods do not classify and count particles by mineral type, leading to the mixing of different particles and affecting the accuracy of hydrodynamic determination and provenance tracing based on the obtained comprehensive parameters. (2) Some parameters lack quantitative characterization methods. Roundness research still remains at the qualitative/semi- quantitative stage, and compaction lacks effective quantitative characterization, making the method not meet the precise needs of rock structure parameters for detailed sedimentary system research and reservoir evaluation.
In recent years, artificial intelligence technology has been applied in the field of oil and gas exploration and development [1-2]. Scholars have conducted research on the quantitative analysis of rock structure. The existing studies mainly focus on rock particle segmentation and the quantitative characterization of rock structure parameters such as particle size and roundness. Rock particle segmentation is the foundation of intelligent rock structure evaluation, and image segmentation algorithms are widely used in rock particle segmentation of core images[3-4]. Early methods mainly relied on traditional image processing algorithms [5-6], which extracted particle edges based on shallow image features and had relatively poor robustness [7-8]. In contrast, deep learning algorithms [9-10] can learn semantic features, not only extracting rock particle edges but also identifying their category attributes, making them the mainstream algorithms for rock particle segmentation [11-13]. Most existing deep learning-based segmentations are implemented for single images. Ren et al. [14] innovatively proposed a new deep learning algorithm that uses microscopic images under plane-polarized light and multi-angle cross-polarized light as input to achieve rock particle segmentation using multiple images. Based on rock particle segmentation, quantitative characterization of rock structure parameters such as particle size [15-16], sorting, and roundness [17-20] can be achieved. Research on compaction mainly deals with the quantitative relationship between porosity and the degree of compaction, as well as the quantitative classification of compaction [21], often in combination with computer image processing software. In the field of cementation research, current methods mainly rely on microscope observation and the construction of rock physics models [22-23]. Although the quantitative research of rock structure has achieved certain results, it still has the following limitations. (1) Traditional deep learning models are affected by factors such as diagenesis, resulting in weak cross-sample generalization capability. (2) Existing particle segmentation algorithms do not fully utilize particle characteristics such as interference colors and extinction under multi-angle polarization, and the accuracy of particle segmentation needs improvement. (3) Rock structure parameters (compaction, cementation type) lack classification statistics and quantitative characterization methods and still rely on qualitative/semi-quantitative evaluation.
The image segmentation algorithms used for rock particle segmentation have evolved from convolutional neural network (CNN)-based YOLO series [24], U-Net [25], to those based on attention modules such as Swin Transformer [26], Swin UNet [27], and Mask2former [28], moving towards the development of large models. Large model technology is expected to solve problems such as poor generalization in traditional deep learning. A representative large model algorithm in the field of image segmentation is segment anything model (SAM) [29]. SAM is a visual large model tailored for the specific task of image segmentation, capable of performing various image segmentation tasks with little or no fine-tuning. Its core advantage lies in its strong generalization capability, enabling it to handle various types of objects and scenes, including complex backgrounds and object occlusion, and it performs excellently in multi-task and zero-shot settings. In the field of downstream fine-tuning, there is extensive follow-up work centered on SAM. For example, SAM-PARSER [30] efficiently fine-tunes SAM through parameter space reconstruction; SAM-Adapter [31] enhances SAM's performance in challenging tasks by introducing domain-specific information or visual prompts; ALLABADI [32] combines SAM with new species detection methods to propose an open-world object detection framework, enabling the recognition of new species without labeled data and facilitating self-learning.
This article takes thin section images as an example to study the quantitative characterization method of sandstone rock structure based on a visual large model. Firstly, to address issues such as multispectral characteristics in thin section images, improvements are made to SAM, and a new algorithm based on SAM, namely Core Segment Anything Model (CoreSAM), is proposed to achieve the extraction of rock particle contour lines and the identification of their attributes. On this basis, an intelligent characterization method of rock structure is constructed, including assessments of sorting and roundness, aiming to promote intelligent rock structure analysis based on core images through visual large model technology and provides technical means for detailed sedimentary system research and reservoir evaluation.
1. Rock particle segmentation model CoreSAM
Compared with ordinary natural images in the general field, the rock particle segmentation of sandstone thin section images faces numerous challenges. (1) Influenced by the non-homogeneity of the reservoir and other factors, the thin section images from different layers can vary greatly. Traditional deep learning-based models for rock particle segmentation have poor generalization capabilities when faced with these variations. (2) Due to factors such as diagenesis, rock particles are squeezed and dissolved, leading to blurred particle edges. Existing image segmentation algorithms struggle to accurately extract these edges. (3) The recognition of particle category attributes requires a synthesis of features from single polarized and multi-angle cross-polarized images, relying on phenomena like interference colors, relief, texture, extinction, etc., to achieve accurate identification. To address the special characteristics of sandstone thin section images, this article proposes a rock particle segmentation model, CoreSAM, based on the visual large model, SAM.
The SAM model consists of three main parts: image encoder, prompt encoder, and mask decoder. The image encoder uses the ViT network to capture the global information of the image and map it to the feature space through the self-attention mechanism. The prompt encoder maps the prompts, including masks, bounding boxes, points, and text, to the feature space and then are fused with image features. In addition, SAM provides a model inference mode to extract all instances (Everything) at once based on point prompts, which is implemented by sampling grid points on the image with a fixed step size and traversing these points as prompt inputs for SAM. The mask decoder fuses the features obtained by the image encoder and the prompt encoder to generate an object query and output the segmentation mask. The query features are optimized by multilayer self-attention and cross-attention and trained with Focal Loss.
As shown in Fig. 1 , based on the SAM model, CoreSAM introduces the multispectral image fusion module, the Matrix-decomposition-based Adaptor (MD-Adaptor), and the classification module. This article designs a multi-channel mask feature merging algorithm to comprehensively learn the features such as extinction, interfering color, bulge, texture, etc. exhibited by particles under multi-spectral images to improve the accuracy of rock particle edge recognition. This article presents a lightweight fine-tuning method based on MD-adaptor to effectively address the challenge that the original SAM model lacks semantic classification ability, avoid the loss of generalized performance and reduce the training cost. By adding a classification module, the categories of rock particle masks are recognized, solving the problem of the original SAM model's inability to classify.
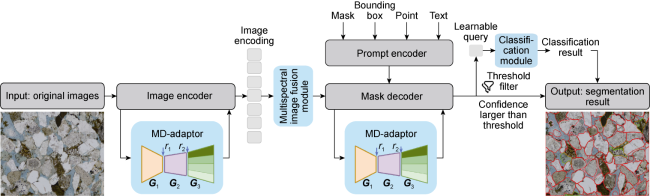
Fig. 1. The overview architecture of CoreSAM. |
1.1. Multispectral image fusion module
In multispectral imaging, each set of input data consists of several cross-polarized (RGB) images. A common approach is to directly employ a two-dimensional convolution with a kernel size of 1×1 to fuse multiple three- channel images into a single multi-channel image, which then serves as the input to an image encoder. However, this method does not allow for the utilization of large- scale three-channel image datasets for pre-training the image encoder, and constructing a dedicated multispectral image pre-training dataset incurs high costs in computation, annotation, and other resources.
This article proposes a lightweight post-feature fusion method that inputs all RGB images from different incident angles separately into a three-channel image encoder. After extracting image features, a lightweight multispectral feature fusion module is used to obtain compressed features. This fusion approach fully leverages the SAM pre-trained image encoder and mask decoder, reducing reliance on annotated data.
The core idea behind the design of the multispectral feature fusion module is to compactly and efficiently fuse multiple image features from different light sources or angles through a series of operations, thereby reducing computational complexity while preserving the key information contained in each channel. Specifically, the module compresses the spatial dimensions of the input image features and applies inter-channel weighting to obtain an effective set of fused features.
First, the model represents the multispectral features from different light sources or angles,$ \boldsymbol{X} \in \mathbb{R}^{4}$, as a four-dimensional feature tensor with shape , where i denotes the number of images (set to 7 in this article), and h, w, and m represent the height, width, and number of channels of the feature tensor output by the image encoder, respectively. After feature extraction, the spatial dimensions of the features are compressed by applying global average pooling, which reduces the spatial features of each channel to a scalar (Eq. (1)), resulting in a feature tensor $ \boldsymbol{X}_{\mathrm{gap}} \in \mathbb{R}^{2}$ with shape . This process captures the global features of each channel for each image, removing spatial information while preserving the differences between channels.
is the value at position in the feature , and is the value at position in the feature X.
To effectively fuse the multispectral information from different images, the module employs a one-dimensional convolutional layer with a kernel size of 1×1 that maps from m channels to m channels. This layer reweights the multispectral image features along the channel dimension, allowing the model to emphasize important features while suppressing redundant or unimportant information during training.
Subsequently, the module applies a weight normalization operation along the image dimension (Eq. (3)) to ensure that the total weights sum to 1, thereby ensuring a reasonable distribution of relative importance among different images. Finally, these weights are used to compute a weighted sum of the features from the different images, resulting in a fused feature tensor with shape . This fused feature retains the key content of the multispectral information while significantly reducing computational costs, thereby enhancing the efficiency of subsequent segmentation tasks.
1.2. MD-adaptor
This article introduces an MD-adapter and fine-tunes SAM with few training costs and balancing versatility and specialization.
1.2.1. Architecture
This article designs an adapter based on matrix-decomposition. As shown in Fig. 1 , the matrix decomposition technique can be adopted to reduce the number of parameters required and support an arbitrary number of specialized datasets for model fine-tuning, so as to achieve a balance between SAM versatility and specialization. For specialized domain data such as rocks, a fine-tuning parameter matrix A is assigned. Then, the parameter matrix A is decomposed to construct shared weight matrices and , and specialized weight matrix for multiple datasets. Among them, and are fine-tuned by large-scale generalized instance segmentation datasets to enable the network to obtain a more generalized instance segmentation capability. The matrix is fine-tuned with different specialized datasets to avoid task conflicts and knowledge forgetting problems when the model learns different datasets.
Assuming the original weights of Q and V in each Transformer Attention Block of the SAM image encoder and mask decoder is , a fine-tuning parameter is added for each fine-tuned dataset during the fine-tuning process:
where is a two-dimensional matrix representing the fine-tuning parameters used in the fine-tuning process for the u-th dataset.
After that, the fine-tuning parameters of all the datasets are combined into a three-dimensional matrix A. Then, A is divided with the low-rank decomposition, as shown in the following equation:
where , , and are low-rank matrices with matrix dimensions of , , and , respectively. is the input dimension of Q and V matrices. is the output dimension of Q and V matrices. and represent the rank of low-rank matrices, which can be adjusted as a hyperparameter in the fine-tuning process. n denotes the number of datasets in the multi-dataset fine-tuning process.
1.2.2. Fine-tuning process
The MD-adaptor is configured and fine- tuned on the image encoder and prompt encoder of the SAM model. The architectures of MD-adaptor are the same for two encoders, while the parameters are different.
The fine-tuning process is divided into two stages. In the first stage, the and matrices are fine-tuned. The generalized instance segmentation dataset, COCO, is used for fine-tuning and the Binary Cross-entropy loss and Dice loss as loss functions for supervision. The Binary Cross-entropy loss supervises each segmented pixel point, while the Dice loss function supervises the intersection over union (IoU) of the segmentation predictions to the ground-truth. The combination of the two loss functions enables the model to focus on both local and global segmentations, improving the convergence of the model. In the second stage, given one dataset during multi-dataset fine-tuning, the parameters of and matrices are fixing. Only the parameter of matrix is fine-tuned. The fine-tuning is supervised with the same loss function as in the first stage.
1.3. Classification module
For rock particle classification, this article proposes a classification module with a multilayer perceptron. Based on the segmentation capability of SAM, a classification head is introduced to realize classification on the mask results for SAM.
Specifically, the output of the SAM mask decoder consists of the mask result and the corresponding Learnable Query. In this article, the Learnable Query features extracted by SAM are fed into a multilayer perceptron. Then, the features are mapped into the classification space with a nonlinear activation function. Finally, the classification prediction results of each Learnable Query are supervised using Cross-entropy loss.
With the proposed classification module, the classification result of each mask can be obtained by utilizing the Learnable Query corresponding to each mask result, which solves the problem that the SAM model cannot classify objects.
2. Quantitative evaluation of rock structure based on CoreSAM
CoreSAM achieves the extraction of particle edges and the identification of category attributes. Rock particles are classified into three categories: terrigenous clasts, non-terrigenous clasts, and interstitial materials. The terrigenous clasts are subdivided into rigid particles and plastic particles. In this study, rigid particles are selected to evaluate particle size, sorting, and roundness; terrigenous clasts are used to obtain contact lines and evaluate compaction effect, and interstitial materials are employed to determine cementation types.
2.1. Particle size and sorting
Based on rock particle segmentation, particle size and area of each rigid particle are calculated. The particle size refers to the long axis of particle, achieved by finding the minimum bounding rectangle on each rigid particle's mask, calculating the length and width of the rectangle, and taking the length of the rectangle as the particle size (Fig. 2 ). The area calculation utilizes the contour of rigid particle segmentation, implemented through the cv2.minAreaRect function in the OpenCV library.
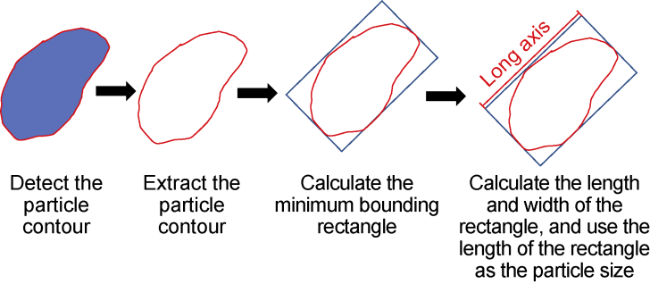
Fig. 2. Calculation method for long axis of rock particle. |
Particle size analysis primarily involves maximum particle size, primary particle size range, and particle size fractions. Here, all rigid particles within the field of view are ranked in an ascending order of particle size, and the maximum value is taken as the maximum particle size. A cumulative area proportion graph of particle sizes is plotted, with the horizontal axis representing particle size and the vertical axis representing the cumulative area proportion of all rigid particles smaller than or equal to that size, accounting for the total area of rigid particles. The particle size interval corresponding from 25% to 75% is taken as the main particle size interval. According to the particle size thresholds corresponding to different particle sizes given in the Identification for Thin Section of Rocks (SY/T 5368-2016) [33], the particle sizes are divided into coarse sand, medium sand, fine sand, very fine sand, coarse silt, and fine silt. When the area proportion of particles with the same particle size fractions is greater than or equal to 75%, the sorting is defined as good; when it is greater than or equal to 50% and less than 75%, the sorting is defined as moderate; when it is less than 50%, the sorting is defined as poor.
2.2. Roundness
This article achieves the quantitative calculation of roundness from a geometric perspective, analyzes the circularity of rigid particles, and provides a calculation formula for roundness. The perimeter and area of each rigid particle are calculated using the functions cv2.arcLength and cv2.contourArea from the OpenCV image processing library, and the roundness index of each rigid particle is calculated by Eq. (7). The mean value of the roundness indices of all rigid particles within the field of view is taken as the roundness index for that field of view.
$p_{\mathrm{m}}=\frac{4 \pi S}{d^{2}}$
According to the Identification for Thin Section of Rocks (SY/T 5368-2016) [33], the roundness grades are classified into five categories: angular, sub-angular, sub-rounded, rounded, and well-rounded. This study compiled a dataset of 5 000 particle images (1 000 samples per roundness grade) and calculated the roundness index for each particle using Eq. (7). Subsequently, the probability distribution of roundness indices across different roundness grades was plotted (Fig. 3 ). The threshold values distinguishing each roundness grade were determined based on the intersection points of their respective roundness index distribution curves. Taking angular and sub-angular as examples, the abscissa of the intersection point between their distribution curves was identified as 0.69, which was thereby established as the threshold between angular and sub-angular. Following this methodology, the thresholds for the remaining grades were correspondingly determined as 0.76 (sub-angular to sub-rounded), 0.79 (sub-rounded to rounded), and 0.85 (rounded to well-rounded). Thus, the threshold for determining the type of roundness given in this article is as follows: when , roundness is judged as angular; when , roundness is judged as sub-angular; when , roundness is judged as sub-rounded; when , roundness is judged as rounded; when , roundness is judged as well-rounded.
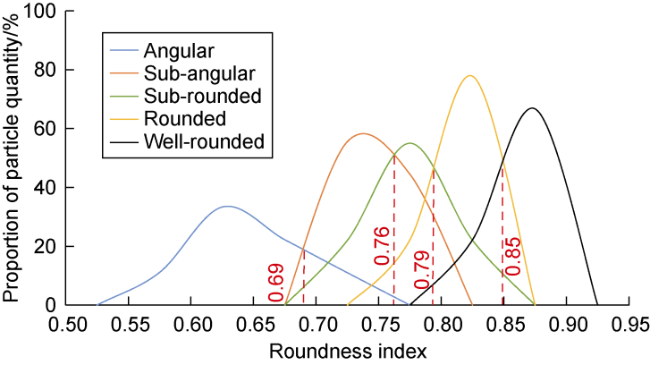
Fig. 3. Probability distribution of roundness index for different roundness grades. |
2.3. Particle contact lines and compaction index
The particle contact lines and compaction effect are evaluated based on terrigenous clasts. The contact lines are determined in the following steps. First, identify the area where the contact line may exist, that is, the overlapping area of the rectangular frame surrounding the two particles (Fig. 4 ). Then, transverse all pixels in the red box from left to right and from top to bottom to determine whether they are contact lines.
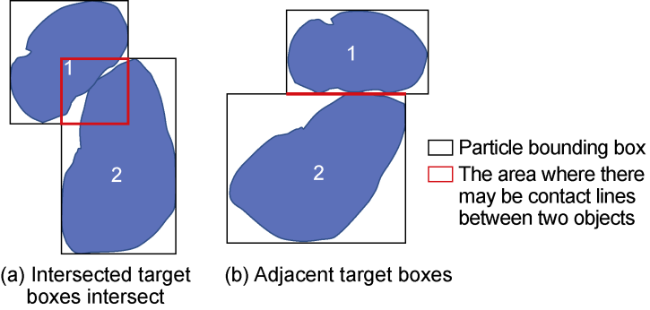
Fig. 4. Areas where contact lines may exist. |
The contact line determination method refers to the eight neighborhood method. For a pixel in the red box, eight neighborhood method looks for a 3×3 square box with the pixel as the center (the side length is 3 pixels, as shown as red box in Fig. 5a ). If the nine pixels in the square box all belong to the same particle, then the pixel does not belong to the contact line; otherwise, it belongs to the contact line. Due to the influence of diagenesis and other factors, the edge of rock particles is blurred. Therefore, this article expands the edge length of the eight neighborhood square box from 3 pixels to 5 pixels (Fig. 5b ). If 25 pixels in the square box belong to the same particle, then the pixel does not belong to the contact line; otherwise, it belongs to the contact line. According to this method, all contact lines can be identified.
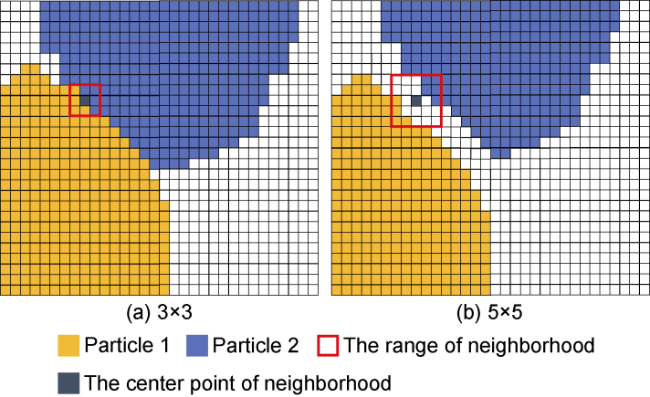
Fig. 5. Contact line discrimination method. |
When determining the type of contact line, it is necessary to consider the influence of particle size. Therefore, while calculating the absolute length l1 of the contact line, this article also provides the relative length l2 of the contact line. The calculation formula is as follows:
Meanwhile, the calculation formula for the compaction index is defined as follows:
2.4. Cementation type
On the basis of rock particle segmentation, the ContourArea function in the image processing library OpenCV is used to calculate the area of interstitial materials, and the determination of cementation type is based on the proportion of interstitial materials to the total particles area. This article combines expert experience to provide the following threshold for determining the type of cementation: when interstitial materials content , the cementation type is determined to basal cementation; when interstitial materials content , the cementation type is determined to basal-pore cementation; when interstitial materials content , the cementation type is determined to pore cementation; when interstitial materials content , the cementation type is determined to contact-pore cementation; when interstitial materials content , the cementation type is determined to contact cementation.
3. Experiments and results analysis
3.1. Dataset
Thin-section samples were collected from 12 stratigraphic units, including the Tengger Formation Member 1 and Arshan Formation Member 4 of the Cretaceous in the Erlian Basin, the Linhe Formation Members 1 and 2, and the Wulate Formation Members 1 and 2 of the Paleogene in the Hetao Basin, and the Dong 3 Member, Sha 1-4 members, and Kong 2 Member of the Paleogene in the Bohai Bay Basin.
For each sample, two fields of view (FOVs) were elected. One plane-polarized light image and six cross-polarized light images at six angles (0°, 15°, 30°, 45°, 60° and 75°) were captured for each FOV. These seven positionally unbiased microscopic images form the input for the rock particle segmentation model (Fig. 6 ).
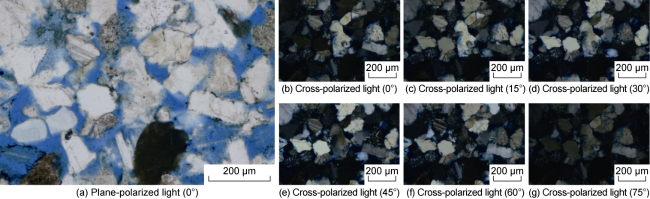
Fig. 6. Multi-source, multi-angle, positionally unbiased thin-section image. |
The research team collaborated with mineral identification experts to annotate 10 000 FOVs, including rock particle edges and categorical attributes. Specifically, 8 000 annotated FOVs were used as the training set for fine-tuning CoreSAM, and 2 000 FOVs were reserved as the test set. Additionally, 500 sandstone CT images and 200 conglomerate core photographs were collected. These CT images and core photographs were not used for model training but served to evaluate the generalization capability of CoreSAM on other core image types.
3.2. Experiment design
Experiments were conducted in an Ubuntu 22.04 environment with a Python-based programming framework. The hardware setup included a 128-core 64-bit AMD EPYC 7763 CPU @2.45 GHz, 128 GB × 32 RAM, and eight NVIDIA A800-SXM4-80GB GPUs.
The performance of CoreSAM was compared against state-of-the-art deep learning methods, including Vistr [34], Mask Track R-CNN [35], SeqFormer [36], and Mask2Former [28], using the 2 000 FOV sandstone thin-section test set. Evaluation metrics included mean Average Precision (mAP), mAP50, and mAP75. CoreSAM was also tested on core photographs and CT images to assess its generalization capability.
3.3. Experiment results and analysis
Table 1. Comparison of CoreSAM with other segmentation methods |
| Model | Mean Average Precision | ||
|---|---|---|---|
| mAP | MAP50 | mAP75 | |
| Vistr | 0.401 | 0.640 | 0.450 |
| Mask Track R-CNN | 0.420 | 0.720 | 0.460 |
| SeqFormer | 0.593 | 0.810 | 0.653 |
| Mask2Former | 0.604 | 0.815 | 0.667 |
| CoreSAM | 0.658 | 0.859 | 0.706 |
Note: mAP—Mean Average Precision; mAP50—mAP at an IoU threshold of 0.5; mAP75—mAP at an IoU threshold of 0.75. |
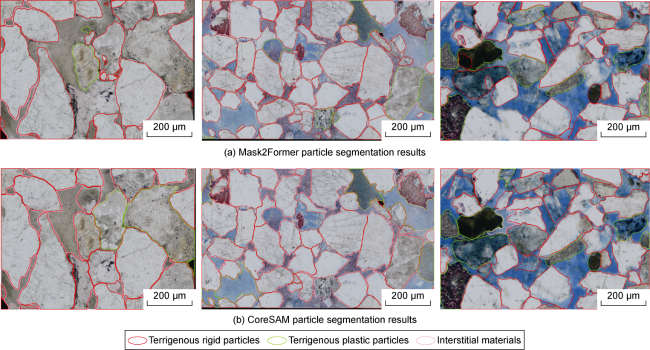
Fig. 7. Particle segmentation results. |
To validate generalization, CoreSAM was tested on CT images and core photographs (Figs. 8 and 9 ). The mean Average Precision (mAP) achieved was 0.850 for 200 core photographs and 0.425 for 500 CT images. Despite not being trained on these image types, CoreSAM demonstrated satisfactory performance, confirming its robustness.
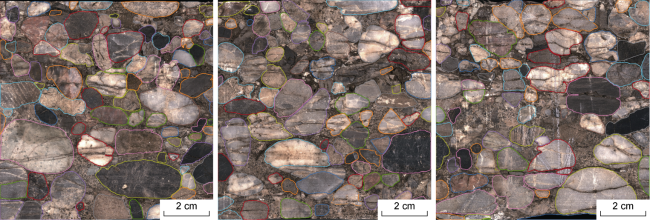
Fig. 8. Segmentation results of CoreSAM on conglomerate core photographs. |
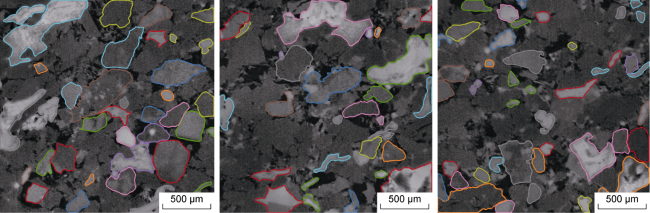
Fig. 9. Segmentation results of CoreSAM on sandstone CT images (different colors denote different particles). |
For example, a sample from the Huabei Oilfield was analyzed. Manual identification results showed a maximum particle diameter of 0.20 mm, a primary particle size range of 0.05-0.12 mm, moderate sorting, pore cementation, and sub-angular roundness. Intelligent identification results aligned closely: maximum particle diameter of 0.21 mm, primary particle size range of 0.10-0.16 mm, moderate sorting, compaction index of 0.38, pore cementation, and sub-angular roundness.
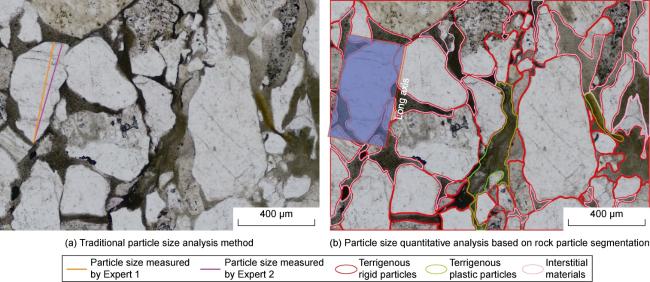
Artificial identification relies on visual observation, and the results are qualitative and not precise enough. Compared to Artificial identification, intelligent identi-fication results are more accurate, quantitative, comprehensive, and intuitive. Additionally, intelligent identifi-cation can also generates visualization outputs such as particle segmentation result diagrams, particle size distribution charts, contact line recognition diagrams, and roundness index distribution charts (Fig. 10 ). Taking particle size analysis as an example, traditional methods rely on expert visual observation under a microscope and manual measurement of the long axis. Due to differences in expert experience and visual estimation error, different experts have different particle size analysis results for the same particle. As shown in Fig. 11a , some experts believe that the orange line is the long axis, while others believe that the purple line is the long axis. The CoreSAM proposed in this paper can yield the result graph depicted in Fig. 11b , based on which the long axis of the particles can be accurately identified, and the equivalent circle diameter can also be calculated. Furthermore, CoreSAM can identify the category of particles, so it can also conduct particle size analysis by category, for example, only calculate the particle size of rigid particles.
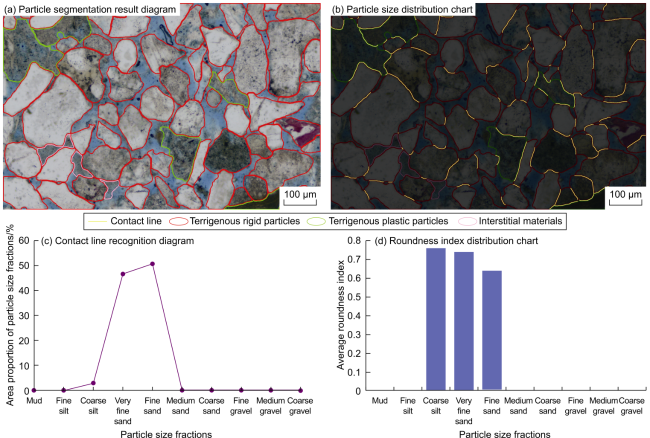
Fig. 10. Intelligent identification results. |
Fig. 11. Comparison of intelligent and traditional particle size calculation methods. |
4. Conclusions
This study proposes an intelligent evaluation methodology for sandstone rock structure based on a visual large model. CoreSAM is constructed through lightweight fine- tuning to achieve precise extraction of particle edges and recognition of category attributes. Building upon this framework, a quantitative evaluation method for sandstone rock structure is proposed, involving the parameters such as particle size, sorting and roundness. Experimental validation demonstrates that CoreSAM significantly outperforms conventional deep learning architectures in both segmentation accuracy and generalization capability, achieving superior particle delineation performance with minimal or even zero-shot fine-tuning requirements, thereby presenting an optimal solution to the small- sample learning paradigm prevalent in petroleum AI applications. Moreover, CoreSAM has a higher generalization capability. Meanwhile, due to a strong generalization capability, CoreSAM can handle various types of objects and scenes, including complex backgrounds, object occlusions, etc., effectively solving problems such as blurred particle edges caused by factors such as diagenesis. The research findings of this article contribute to the development towards precise, quantitative, intuitive, and comprehensive reservoir evaluation, providing a powerful tool for sandstone reservoir research.
Nomenclature
A—number of particles in the field of view;
A—fine-tuning parameters matrix;
Au—the fine-tuning parameters matrix for the u-th dataset;
b—number of adjacent particles around a target particle k;
—convolution layer with a kernel size of 1×1;
d—perimeter of a single particle, mm;
dk—perimeter of particle k, mm;
dx, dy—perimeter of particles on both sides of the contact line, mm;
f—percentage of interstitial material content, %;
G1—shared weight matrix 1;
G2—shared weight matrix 2;
G3—specialized weight matrix;
h, h°—the height of the feature tensor and its ID;
i, i°—the number of images and its ID;
j, k—particle number;
I1—the input dimension of the matrix;
l1—absolute contact line length, mm;
l2—relative contact line length, dimensionless;
lkj—length of contact line between a particle k and its adjacent particle j, mm;
m, m°—the number of channels of the feature tensor and its ID;
n—the number of datasets in the multi-dataset fine-tuning process;
o2—the output dimension of the matrix;
pm—roundness index of a single particle, dimensionless;
py—compaction index;
r1—the rank of G1 matrix;
r2—the rank of G2 matrix, dimensionless;
S—area of a particle, mm2;
w, w°—the width of the feature tensor and its ID;
W—the weights of matrix after fine-tuning;
W0—the original weights of matrix;
X—the multispectral features from different light sources or angles;
Xfus—fused feature tensor;
Xgap—feature tensor reducing the spatial features of each channel;
Xlin—feature tensor after linear transformation;
αi—fusion weights;
$ \mathbb{R}^{N}$—feature tensor with N dimension.