

Introduction
Deep to ultra-deep carbonate oil and gas reservoirs have been the frontier field for oil and gas exploration in China. With oil and gas exploitation and resources depletion in shallow to medium layers (shallower than 4 500 m), it’s an inevitable choice to explore oil and gas resources in deep layers (4 500-6 000 m) and even ultra-deep layers (deeper than 6 000 m) to ensure national energy security. Discoveries of large oil and gas fields such as Puguang, Anyue, North Shuntuoguole and Fuman [1-4] revealed that deep to ultra-deep carbonate reservoirs contain rich oil and gas resources and have become an important succession of oil and gas resources [5-7]. However, deep to ultra-deep carbonate reservoirs that experienced a long and complicated process of reservoir formation, oil and gas accumulation and reservoir transformation remain poorly understood, restricting oil and gas exploration and development. The evolution model of pore-throat structure and the mechanism of pore formation and preservation through the coupling of multi- phase structures, high-temperature and high-pressure (HTHP) and complex fluid are critical scientific issues faced by exploration and development of deep to ultra-deep carbonate oil and gas resources [8].
The study on the evolution model of pore-throat structure and the mechanism of pore formation and preservation in deep to ultra-deep carbonate reservoirs is based on two approaches: forward modeling and inversion [9-10]. "Forward modeling" can reproduce the factors (lithology, temperature, pressure, fluid, initial pore-throat structure, etc.) controlling the development and preservation of pores in carbonate rocks through simulation experiments on carbonate rock dissolution and precipitation under analogous geological conditions, and reveal the changes in pore-throat structure and the distribution law of dissolution vugs in the process of burial. However, the applicable "forward modeling" experimental device cannot simulate the multi-cycle structure-temperature-pressure coupling process, which restricts the evaluation of deep and super-deep reservoirs. The "inversion" method can determine the age, temperature, pressure and fluid properties of sedimentary and diagenetic minerals through geochemical analysis, and deduce the development and preservation mechanism of pores in carbonate rocks. However, the understanding inferred is difficult to meet the research of dissolution mechanism and quantitative evaluation of dissolution effect. The Key Laboratory of Carbonate Reservoir of China National Petroleum Corporation (CNPC) has the internationally advanced technology for testing "age, temperature, pressure and fluid properties". The age, temperature, pressure and fluid properties obtained from geochemical analysis of diagenetic mineral elements and isotopes are experimental parameters for simulating the dissolution and precipitation of carbonate rock [10], and the simulation experiment is closer to in-situ geological conditions. It is urgent to develop a visualization simulation experimental device that can work at ultra-high temperature and pressure, simulate multi-stage continuous flow, and real time and visually detect porosity and permeability in ultra-deep carbonate reservoirs. Through simulating the dissolution and precipitation process under analogous geological conditions, the controlling factors, the mechanism of pore formation and preservation and the evolution model of pore-throat structure can be revealed for deep to ultra-deep carbonate reservoirs.
1. Geological features of deep to ultra-deep carbonate reservoirs, and demand on simulation experimental equipment
High-temperature and high-pressure and complex fluid activities are characteristics of deep to ultra-deep environment (Table 1 ) [11-12], and they are the key parameters restricting the formation and preservation of carbonate pores. In addition to high-temperature and high-pressure, there is abnormal overpressure in the Tarim Basin and the Sichuan Basin. Fluid properties also change greatly with depth, and under the control of structure, rock-fluid interaction, hydrocarbon generation, and mantle thermal fluid activities. Formation brine is the product of rock- fluid interaction, which is rich in minerals and runs through the whole burial process. Meteoric water and connate seawater are mainly found in medium and shallow environments. Organic acids are acidic fluids associated with hydrocarbon generation in source rocks, which are mainly distributed in mid-shallow and deep layers. Formation thermal fluid and mantle-derived hydrothermal fluid are related to the hydrothermal activity controlled by episodic tectonic movement.
| Formation | Depth/m | Tarim Basin | Sichuan Basin | Fluid features | ||
|---|---|---|---|---|---|---|
| Temperature/°C | Pressure/MPa | Temperature/°C | Pressure/MPa | |||
| Shallow- medium | <4 500 | <115 | <54 | <125 | <67.50 | Meteoric water, connate sea water, formation brine, organic acid |
| Deep | 4 500-6 000 | 115-135 | 54-72 | 125-165 | 67.50-90.00 | Formation brine, organic acid, inorganic acid, formation thermal fluid, mantle-derived hydrothermal fluid |
| Ultra-deep | 6 000-7 500 | 135-165 | 72-90 | 165-200 | 90.00-112.50 | Formation brine, inorganic acid, formation thermal fluid, or mantle- derived hydrothermal fluid |
| Super-deep | >7 500 | >165 | >90 | >200 | >112.50 | |
Simulation experiment on carbonate rock dissolution and precipitation is an important way to explore the evolution model of pore-throat structure and the mechanism of pore formation and preservation in deep to ultra-deep carbonate rocks. In order to approach to the real geological background, the simulation experiment device should meet the following conditions. (1) The triaxial-stress core holder can work at over 300 °C and 150 MPa to simulate the real temperature and pressure in deep to ultra-deep formations in the Tarim Basin and Sichuan Basin. The triaxial-stress core holder available now can only work below 180 °C and 70 MPa. (2) Carbonate rocks in the superimposed basins in China have generally experienced multiple cycles of burial, uplift and denudation [15-16], resulting in multiple cycles of increasing temperature and pressure and decreasing temperature and pressure in the process of burial dissolution and precipitation. The qualified simulation experimental device should have the function to reservoirs simulate multi-stage and continuous flow across multiple tectonic epochs, but the experimental equipment available now can only simulate "continuously increasing temperature and pressure" (continuous burial) in a single cycle. (3) To continuously observe the changes of pore-throat structure in the process of dissolution and precipitation, the simulation experiment device should detect porosity and permeability in real time and visualization mode. The experiment device available now can only measure the pore-throat structure at the start and end of the simulation experiment. It’s difficult to quantify the changes of pore-throat structure in the entire experiment process.
2. Development of simulation experimental device
2.1. Research and development status of reservoir visual simulation experimental device
Since the 1980s, with large-scale discoveries of carbonate reservoirs around the world, research on the pore formation and preservation mechanism, especially the dissolution-precipitation mechanism and reservoir forming effect, has become the focus of simulation experiments. The simulation experimental devices that can meet specific geological conditions have been developed successively. There are acid-rock reaction rotating disk [17-18], HTHP tubular flow reaction device [19-20], hydrothermal diamond anvil cell [21], fused capillary silicon tube [22] and HTHP core seepage simulation device [23].
The acid-rock reaction rotating disk is a simple experimental device used to simulate the reaction between acidic fluid and carbonate rock, and can be used to test the kinetic parameters of acid-rock reaction [24]. Experimental samples, namely rock plungers, are soaked in and washed by acidic fluid on the sample surface under simulated geological conditions. The dissolution rates of carbonate minerals under different experimental conditions (temperature, pressure, flow rate, etc.), are compared to explore the dissolution mechanism of different types of carbonate minerals [25-26]. The acid-rock reaction rotating disk can only simulate the dissolution rate on rock surface. The water-rock ratio, hydrodynamics and temperature and pressure are extremely different from real geological conditions, so that the experimental results do not reflect the real underground situation.
The HTHP tubular flow reaction device developed by David Crerar of Princeton University in 1983 can simulate the reaction between fluid and mineral at high-temperature and high-pressure. A high-pressure pump is used to drive fluid to flow in a chamber, and a back pressure controller installed in the outflow direction stabilizes fluid pressure and ensure fluid flow at high-temperature and high-pressure. Since then, many institutes and scholars [20,27] have improved the device, and carried out dissolution kinetic experiments on quartz, feldspar, fluorite, limestone and other minerals. This device is also satisfactory for the feature that the parameters of the solution related to chemical kinetics in the experimental system, such as pH, flow rate, temperature, and particle size of reactive minerals, can be changed during experiments. However, it has some evident shortcomings. First, the samples are particles or blocks (not core plungers). Dissolution reaction can only run on rock surface, so it’s impossible to evaluate pore increase caused by dissolution and characterize the change of pore-throat structure in the process of dissolution and precipitation. Second, a single reactor cannot simulate the water-rock reaction under multiple temperature and pressure conditions at the same time, so it cannot complete water-rock reaction simulation experiment across different tectonic periods. Third, the dissolution process is not visualized and dissolution products can’t be detected in real time.
The hydrothermal diamond anvil cell is an HTHP in-situ simulation experimental device designed by Professor Bassett of Cornell University in 1993 on the basis of diamond anvil cell [28]. The device consists of a pair of parallel diamond anvil cells, sealing gaskets between and external mechanical devices. Transparent hydrothermal diamond provides a visualizing function. In combination with a laser Raman spectrometer, it has been widely used to realize real-time and online in-situ detection of fluid composition and content. However, it has some shortcomings. First, it is hard to evaluate pore increase and characterize the change of pore-throat structure in the process of dissolution and precipitation using powder samples (rather than core plungers). Second, a single reactor cannot simulate the water-rock reaction under multiple temperature and pressure conditions at the same time, so it cannot realize the water-rock reaction simulation across different tectonic periods. Third, the dissolution reaction on rock surface in a closed to (semi-) open system can run at the water-rock ratio, hydrodynamics, temperature and pressure different from actual underground geological background, so the experiment result cannot reflect the real underground situation.
The fused capillary silicon tube (about 2 cm long, and inner diameter of 50-500 μm) is a reaction chamber for dissolution-precipitation simulation experiment at high-temperature and high-pressure [29]. Due to the transparent wall of the chamber, the reaction process can be monitored in real time under a microscopy, and the fluid composition and content in the reaction chamber can be measured in real time in combination with a laser Raman spectrometer. In addition, the composition of the fused capillary silicon tube is SiO2, so it is not necessary to add SiO2 when using the silica-bearing fluid, which is helpful for studying the reservoir development mechanism under the action of silica-bearing hydrothermal solution. The fused capillary silicon tube has the same shortcomings as the hydrothermal diamond anvil cell.
The HTHP core seepage simulation device was developed by Luquot of University of Montpellier in France in 2009 [23]. The device can measure core plunger (7.5 mm diameter) permeability at 20-180 °C, and 0.1-20.0 MPa in real time online. The Key Laboratory of Carbonate Reservoir of CNPC developed a HTHP core seepage simulation device as shown in Fig. 1. It uses a triaxial stress core holder as a reactor, and measure the permeability of the core plunger (25 mm diameter) in water-rock reaction at 20-180 °C and 0.1-70.0 MPa in real-time online. The range of permeability measured is (0.1-1 000.0)×10−3 μm2. It basically represents the level of simulation experimental equipment home and abroad at the present stage. The advantages includes: using core plungers as experimental samples; dissolution simulation experiment inside rock; the simulated water-rock ratio, hydrodynamics, temperature and pressure similar to real underground conditions; quantitative evaluation of pore increase by dissolution; characterization of pore structure during dissolution-participation; and real-time measurement of permeability. However, it has some shortcomings. First, it is impossible to simulate water-rock reaction under multiple temperature and pressure conditions at the same time, so it can’t work across different tectonic periods. Second, low experimental temperature and pressure cannot simulate the reaction in deep to ultra-deep formations at ultra-high temperature and pressure. Third, the dissolution process is not visualized, and it is hard to measure porosity, permeability and fluid properties (composition and content) in real-time.
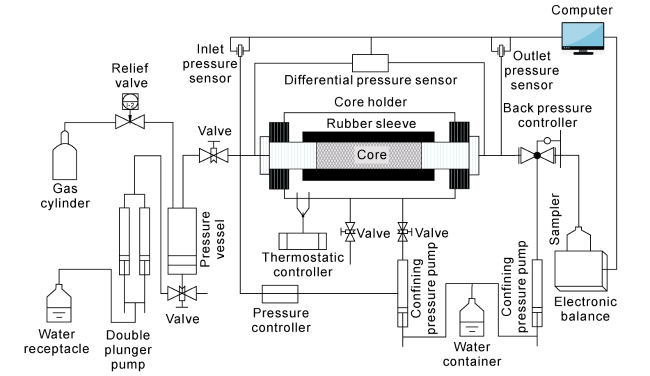
Fig. 1. HTHP core seepage simulation experimental device developed by CNPC Key Laboratory of Carbonate Rock Reservoir. |
In short, although the functions of the devices abovementioned are different, they can only meet specific requirements. Their common shortcoming is that each one of them is effective to simulate the rising temperature and pressure process. Carbonate reservoirs in superimposed basins generally experience multiple cycles of rise and fall of temperature and pressure in deep to ultra-deep formations, but the simulation experiment conditions can’t reproduce to the real geological background. Some devices only use powdery rock samples (not core plungers) to simulate surface reaction. Although it is visualized, it is impossible to objectively evaluate the pore increase by dissolution and characterize the change of pore-throat structure inside rock samples in the process of dissolution and precipitation. The device that uses core plungers can’t visually and characterize the change of pore-throat structure and measure the porosity, permeability and fluid properties (composition and content) in real-time in the process of dissolution and precipitation. All these disadvantages restrict the research on the controlling factors and chemical mechanism of water-rock reaction.
2.2. Characteristics and functions of new reservoir visualization simulation experimental device
The new HTHP visualizaition simulation experimental device includes four modules: triaxial stress core holder module, multi-stage continuous flow module that can regulate temperature and pressure, sapphire window pool and fluid properties measurement module, and real-time online ultra-high temperature and high-pressure permeability detection module. It is effective for the experimental study on the mechanism of pore formation and preservation and the evolution of pore-throat structure in deep to ultra-deep carbonate rocks. The whole structure is shown in Fig. 2 , see functional modules in Fig. 3.
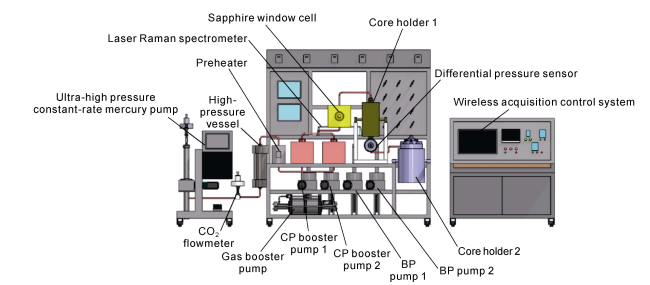
Fig. 2. Structure of the HTHP visualization simulation experimental device. |
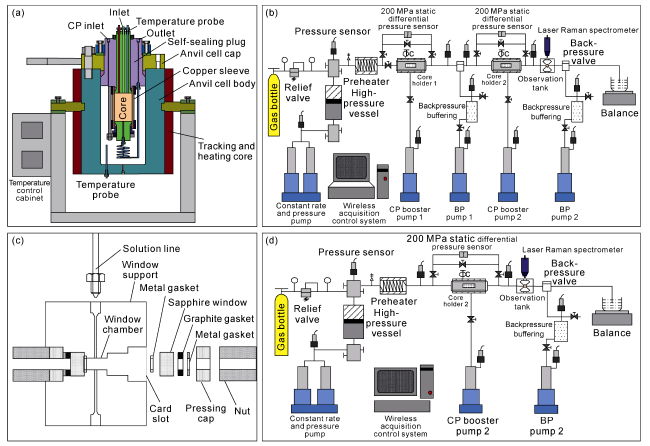
Fig. 3. Four functional modules of the HTHP visualization simulation experiment device. (a) Ultra-high temperature-pressure triaxial stress core holder and reactor module; (b) Multi-stage continuous flow module; (c) Internal parts of the ultra-high temperature -pressure sapphire window cell; (d) Real-time ultra-high temperature -pressure permeability detection module. |
2.2.1. Ultra-high temperature and high-pressure triaxial stress core holder module
Three innovations were made on the triaxial stress core holder and reactor. First, a copper sleeve replaces a rubber casing to protect the core sample. The former is more effective for simulation experiment at ultra-high temperature. Second, graphene is used to make key sealing parts which work better than screw thread + "O"-type rubber at ultra-high-temperature and high-pressure. Third, the wing support protects the copper sleeve wrapping the sample from being damaged at ultra-high confining pressure. The holder and reactor can work at over 300 °C and 150 MPa, so it meets the requirements of internal dissolution simulation experiment in ultradeep formations (around 10 000 m).
2.2.2. Multi-stage continuous flow module with temperature and pressure adjustment function
The multi-stage continuous flow module (Fig. 3b ) is designed to simulate the dissolution and precipitation in carbonate rocks that generally experience multiple cycles of rise (increasing burial depth) and fall (tectonic uplifting) of temperature and pressure across tectonic periods in superimposed basins. The module includes at least two or more triaxial stress core holders that are connected through a pipeline. Each core holder independently simulates water-rock reaction at specified temperature and pressure, and the temperature and pressure between the core holders are changed regularly to realize the water-rock reaction simulation experiment of the dual process of rise and fall of temperature and pressure. Each core holder is equipped with independent temperature controller, confining pressure pump, back pressure controller and back pressure pump. The temperature controller controls the temperature of water-rock reaction in the core holder, the confining pressure pump controls the confining pressure on the core, and the back pressure controller and the back pressure pump at the outlet of the core holder control the fluid pressure inside the core.
The multi-stage continuous flow module includes two innovations. First, the core holders are connected together, but each of them is equipped with independent temperature, pressure and confining pressure controllers. A preheater is installed in front of the core holders. These installations ensure the simulation to the dissolution and precipitation of carbonate rocks in multiple cycles of changes of temperature and pressure across tectonic periods, so they are more effective than the old device that can only simulate water-rock reaction at increasing temperature and pressure. Second, at constant pressure or constant rate, and with the help of injection pump, preheater and confining pressure controller, water-rock reaction can be simulated at a variety of conditions including structural dynamics, hydrodynamics, geostatic pressure and thermal driving force. It is more effective than the old device that can only simulate at hydrodynamics. In addition, the temperature and pressure control and acquisition systems are equipped with independent proprietary software to realize the compatibility, cooperation and stability of all parts in the multi-stage continuous flow module. The multi-stage continuous flow module provides a simulation platform for changes in formation temperature, pressure and fluid properties during long distance fluid migration across different tectonic periods.
2.2.3. Ultra-high temperature-pressure sapphire window cell and fluid real-time online detection module
The sapphire window cell and real-time fluid detection module (Fig. 3c , 3d) for testing fluid composition and content at ultra-high temperature and pressure is composed of a sapphire anvil cell, external heating and temperature control components, safety protection components, connectors between the sapphire anvil cell and laser Raman fiber probes, fluid inlet and outlet pipelines. Real-time fluid detection follows the principle of hydrothermal diamond anvil cell or fused capillary silicon tube. The sapphire window cell is connected to laser Raman spectrometers by optical fiber probes at both ends. The fluid generated by the reactor flows through the sapphire window cell, and detected by the laser Raman spectrometers for its composition and content in real time. In other words, the dissolution process is visualized, and the composition and content of the fluid is detected in real time at ultra-high temperature and pressure. The wall of the sapphire anvil cell should be strong enough for high pressure, and easy enough for penetration of spectral signal. Trial and error is necessary to find the best balance between the two.
Two unique designs were made on the sapphire window cell and real-time fluid detection module. First, the sapphire window cell provides a visualization function at ultra-high temperature and pressure. Second, the core holders are connected to the sapphire window cell, and the two ends of the window cell are connected to laser Raman spectrometers through optical fiber probes to achieve real-time detection of fluid composition and content.
2.2.4. Real-time online permeability detection module under ultra-high temperature -high-pressure
Permeability measurement is realized by measuring the pressure difference between the fluid inlet and outlet of water-rock reaction. It is a common practice to measure the pressures at fluid inlet and outlet by pressures sensors, and then calculate the pressure difference. However, because the accuracy of pressure sensor depends on specific pressure values, the higher the pressure value, the lower the accuracy is, so that a large error of permeability measured appears at ultra-high pressure. In addition, the applicable pressure sensor can only measure the pressure less than 70 MPa, which is lower than the demand of simulation experiment on ultra-deep carbonate rocks. The real-time permeability detection module at ultra-high temperature and pressure (Fig. 3d ) adopts triaxial stress core holders as reactors whose two ends are connected with pressure difference sensors and pressure sensors to obtain the fluid pressure difference between the inlet and the outlet of the core in real time. The electronic balance records the fluid flow in the sampler, and calculates the flow rate from the reaction in real time. The core permeability is calculated in real time according to the Darcy formula. The real-time permeability curve is plotted by the proprietary software.
The real-time permeability detection module has two advantages. First, the pressure difference sensor as the key part can measure pressure higher than 150 MPa. Second, the cooperation of differential pressure sensor and pressure sensor can measure a large range of permeability, (0.1-10 000.0)×10−3 μm2. The differential pressure sensor measures relatively low permeability, while the pressure sensor measures relatively high permeability.
3. Simulation experiment on pore formation and preservation of deep to ultra-deep reservoir
The new device can measure the permeability and fluid (composition and content) of deep to ultra-deep carbonate rock in visualized and real-time mode at ultra-high temperature (300 °C) and high pressure (150 MPa) with the function of temperature and pressure regulation. It provides a new means for simulating the dissolution and precipitation process under nearly real geological conditions.
3.1. Simulation experiment on the changes of pore-throat structure and fluid physical properties
Pores in unconsolidated or semi-consolidated sediments in the depositional and early supergene period are mainly matrix pores, including primary pores (intergranular and intragranular pores), structurally selective dissolution pores (moldic pores) and enlarged pores by dissolution expansion of sedimentary primary pores, and almost no fractures and karst caves are observable [30]. Whether and how the structure of the matrix pores changes after being deeply buried and the controlling factors on the change are important for evaluating deep to ultra-deep carbonate reservoirs. They are also important for evaluating well productivity before drilling operation for oil and gas field development.
To reveal the change of pore-throat structure and controlling factors during buried dissolution, the influence of lithology and initial pore-throat structure on dissolution was simulated. Pores (vugs) and fractures are common pore-throat types in deep to ultra-deep carbonate reservoirs. Four groups of samples representing porous (vuggy) dolomite, fractured-porous (vuggy) dolomite, porous (vuggy) limestone and fractured limestone were selected for experimental simulation following the conditions shown in Table 2 . Considering the temperature at which hydrocarbon becomes mature and generates organic acids, the thermal decarboxylation of organic acids at high temperature and pressure, and CO2-saturated fluid (inorganic acid) in deep to ultra-deep formations playing a dominant role, 2 mL/L acetic acid solution was used for medium to shallow reaction, and CO2-saturated solution was used for deep to ultra-deep reaction. Both acetic acid and CO2-saturated solution are weak acids, but the strength of acetic acid is stronger than that of CO2-saturated solution, and their stability at high-temperature and high-pressure is different. 16 temperature-pressure points were selected based on the temperature and pressure field built on real samples. 8 samples were taken from the Tarim Basin and 8 from the Sichuan Basin (Table 3 ).
Table 2. Experimental conditions for simulating the influence of lithology and initial pore-throat structure on dissolution effect in Tarim and Sichuan basins |
| No. | Samples lithology | Sample source | Porosity/ % | Permeability/ 10−3 μm2 | Experimental condition |
|---|---|---|---|---|---|
| 1 | Porous (vuggy) dolomite | Triassic Feixianguan Formation in the Sichuan Basin | 10.15 | 6.18 | 2 mL/L of acetic acid/CO2-saturated solution, open flow at 2 mL/min, dissolved inside. 8 TP points simulated in the Tarim Basin and 8 in the Sichuan Basin, representing 4 depths: shallow-medium, deep, ultra-deep and super deep. 60 min spent on each point |
| 2 | Fractured-porous (vuggy) dolomite | Cambrian Longwangmiao Formation in the Sichuan Basin | 10.80 | 32.40 | |
| 3 | Porous (vuggy) limestone | Ordovician Yijianfang Formation in the Tarim Basin | 7.08 | 0.70 | |
| 4 | Fractured limestone | Ordovician Yingshan Formation in the Tarim Basin | 2.79 | 3.30 |
Table 3. Results of dissolution simulation experiments on samples with different lithologies and initial pore-throat structures in Tarim and Sichuan basins |
| Sample No. | Physical properties at different temperature and pressure | |||||||||||||||||
|---|---|---|---|---|---|---|---|---|---|---|---|---|---|---|---|---|---|---|
| Initial physical properties | Shallow to medium | Deep | Ultra-deep | Super-deep | ||||||||||||||
| ϕ | K | 80 °C, 48 MPa | 110 °C, 66 MPa | 130 °C, 78 MPa | 150 °C, 90 MPa | 170 °C, 102 MPa | 190 °C, 114 MPa | 210 °C, 126 MPa | 230 °C, 138 MPa | |||||||||
| ϕ | K | ϕ | K | ϕ | K | ϕ | K | ϕ | K | ϕ | K | ϕ | K | ϕ | K | |||
| 1 | 10.15 | 6.18 | 10.20 | 6.2 | 10.32 | 6.25 | 10.45 | 6.38 | 11.05 | 8.65 | 12.15 | 13.15 | 13.27 | 15.23 | 13.67 | 18.4 | 14.95 | 21.2 |
| 2 | 10.80 | 32.40 | 11.12 | 46.7 | 11.44 | 64.30 | 11.69 | 79.60 | 11.89 | 95.70 | 12.05 | 110.50 | 12.15 | 131.50 | 12.25 | 149.7 | 12.30 | 182.4 |
| 3 | 7.08 | 0.70 | 7.30 | 27.5 | 7.48 | 112 | 7.63 | 207.00 | 7.77 | 323.00 | 7.87 | 587.30 | 7.99 | 876.50 | 8.04 | 1 467.0 | 8.08 | 1 650.7 |
| 4 | 2.79 | 3.30 | 2.90 | 69.0 | 2.98 | 189 | 3.03 | 268.00 | 3.07 | 367.00 | 3.13 | 604.00 | 3.19 | 973.00 | 3.23 | 1 143.0 | 3.29 | 1 278.3 |
Note that ϕ is porosity (%) and K is permeability (10-3 μm2). |
The basic principle of permeability measurement at each temperature-pressure point is that the pressure difference between the inlet and the outlet of the water-rock reaction is measured by a pressure difference sensor to calculate the permeability. In the meantime, the dissolution process and pore structure change are observed through the sapphire window cell. Since the newly-developed simulation experiment device cannot be used for real-time online porosity detection, the porosity of each temperature and pressure point of the four plunger samples in Table 3 , except the porosity at two end points is the measured value, and the porosity of the other temperature and pressure points is the virtual value given by the previous [31-32] dissolution simulation experiment. Of course, the porosity can be measured offline to verify the virtual value at each measure point. The photo of the pore-throat structure at each temperature-pressure point shown in Fig. 4 was offline CT scanned because no camera is equipped on the device.
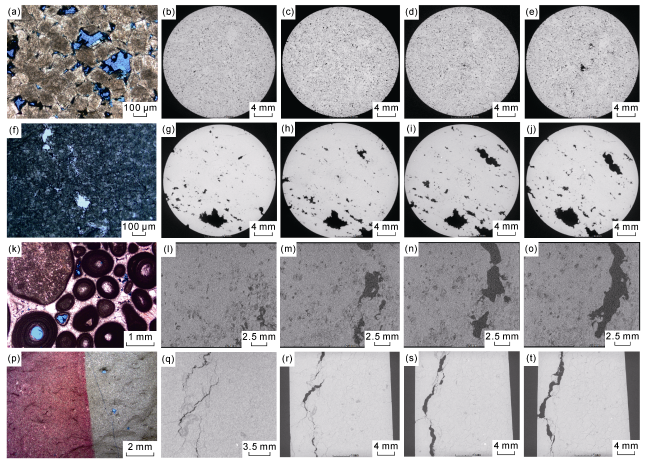
Fig. 4. Variation of pore-throat structure of different samples at different temperature and pressure points in burial and dissolution process. (a)-(e) Porous(vuggy) dolomite, Sample 1, with the conditions of cast thin section and plane-polarized light in (a), 80 °C and 48 MPa in (b), 130 °C and 78 MPa in (c), 170 °C and 102 MPa in (d), and 210 °C and 126 MPa in (e); (f)-(j) Fractured-porous(vuggy) dolomite, Sample 2, with the conditions of cast thin section and plane-polarized light in (f), 80 °C and 48 MPa in (g), 130 °C and 78 MPa in (h), 170 °C and 102 MPa in (i), and 210 °C and 126 MPa in (j); (k)-(o) Porous(vuggy) limestone, Sample 3, with the conditions of cast thin section and plane-polarized light in (k), 80 °C and 48 MPa in (l), 130 °C and 78 MPa in (m), 170 °C and 102 MPa in (n), and 210 °C and 126 MPa in (o); (p)-(t) Fractured limestone, Sample 4, with the conditions of cast thin section and plane-polarized light in (p), 80 °C and 48 MPa in (q), 130 °C and 78 MPa in (r), 170 °C and 102 MPa in (s), and 210 °C and 126 MPa in (t). |
According to the simulation results, the fluid enters the pores (vugs) of the porous (vuggy) dolomite in a dispersive diffusion mode, which increases the specific surface area of dissolution. The permeability increases with the porosity proportionally, and both increase evidently, but the pore-throat structure remains unchanged (Fig. 5a ). For the fractured-porous (vuggy) dolomite, fractures are dominant channels for fluid flow, followed by pores (vugs). The permeability increases evidently, but the po-rosity increases insignificantly, and the pore-throat structure remains unchanged (Fig. 5a ). For the porous (vuggy) limestone, although fluid is initially dispersed into pores (vugs), continuous dissolution resulted in the connectivity of pores (vugs) and forming more fractures because limestone is much more soluble than dolomite at middle to deep-burial. The porosity increases less, but the permeability increases by 2 to 3 orders of magnitude, and the pore-throat structure evolves from pores (vugs) dominant to fractures and vugs dominant (Fig. 5b ). For the fractured limestone, fractures are dominant channels for fluid migration. The porosity increases little, but the permeability increases by 3 to 4 orders of magnitude. The pore-throat structure evolves from fractures dominant to fractures and vugs dominant (Fig. 5b ).
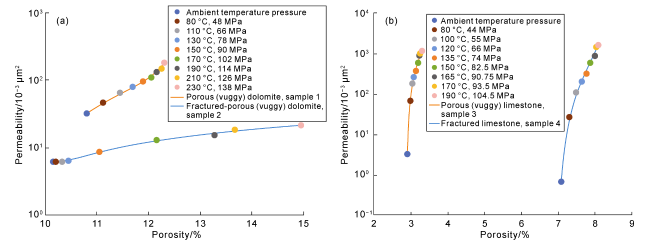
Fig. 5. Variation of porosity and permeability of plunger samples at different temperature and pressure points in Sichuan Basin and Tarim Basin (porosity data from offline detection). (a) Variation of porosity and permeability at different temperature and pressure points in porous (vuggy) dolomite and fractured (vuggy) dolomite in the Sichuan Basin; (b) Variation of porosity and permeability at different temperature and pressure points in porous (vuggy) limestone and fractured limestone in the Tarim Basin. |
In summary, lithology and initial pore-throat structure played important roles in controlling the evolution of pore-throat structure in the process of dissolution. For porous (vuggy) and fractured-porous (vuggy) dolomite reservoirs, burial dissolution leads to the increase of porosity and permeability, but the pore-throat structure remains unchanged. For porous (vuggy) and fractured limestone reservoirs, burial dissolution results in the increase of the permeability by several orders of magnitude, but the porosity increase is not evident, and eventually evolving into fractured-vuggy reservoirs. The findings describe the pore structure characteristics of deep to ultra-deep carbonate reservoirs: fractured-vuggy reservoirs are mainly found in limestone, and fractured-porous (vuggy) reservoirs in dolomite. Without special geological background (such as abnormal overpressure), it is difficult to develop limestone reservoirs with matrix pores in deep to ultra-deep carbonate rocks.
3.2. Simulation experiment on pore formation and preservation
Early simulation experiments to study the controlling factors on dissolution rate and dissolution laws of carbonate minerals [20,31 -37] used the experimental devices at working condition less than 70 MPa and 180 °C, such as HTHP core seepage simulation. Only the dissolution law in shallow-medium carbonate reservoirs was simulated.
The new simulation device provides a new way to explore the controlling factors on dissolution rate and dissolution laws of deep to ultra-deep carbonate minerals. It can detect the fluid composition and content in real-time at pressure up to 150 MPa and temperature up to 300 °C while protecting fluid from being polluted in the separation and transfer process, with high efficiency and small error. Similarly, considering the temperature at which hydrocarbon becomes mature and produces organic acids, the thermal decarboxylation of organic acids at high temperature and pressure, and the dominant role of deep to ultra-deep CO2-saturated solution (inorganic acid), acetic acid and CO2-saturated solution were used in shallow-medium reaction, while only CO2-saturated solution was used in deep to ultra-deep reaction. The temperature-pressure points simulated came from the restoration of the temperature and pressure field based on real samples (Table 4 , Fig. 6 , Fig. 7 ).
Table 4. Conditions and results of simulation experiments for dissolution rate controlling factors and dissolution laws of carbonate rocks |
| SN | Simulation experiment | Sample No. | Porosity/ % | Permeability/ 10-3 μm2 | Experimental conditions | Experimental results | |
|---|---|---|---|---|---|---|---|
| Shallow to medium (<70 MPa, <120 °C) | Deep to ultra-deep (˃70 MPa, ˃120 °C) | ||||||
| 1 | Contrast experiment on dissolution rate for limestone and dolomite | 5 | 6.78 | 1.43 | 2 mL/L acetic acid/CO2-saturated solution; internal dissolution of rock; open flow at 1 mL/min | The dissolution rate of acetic acid to limestone was much higher than that to dolomite. With the increase of temperature and pressure, the dissolution ability of limestone and dolomite increased | With the increase of temperature and pressure, the dissolution rate of CO2- saturated solution to dolomite increased rapidly, and was evidently greater than that to limestone |
| 6 | 5.56 | 1.27 | |||||
| 2 | Effects of fluid type and concentration on dissolution rate of carbonate | 5 | 6.78 | 1.43 | 2 mL/L acetic acid solution, 3.5 mL/L acetic acid solution and CO2-saturated solution; internal dissolution of rock; open flow at 1 mL/min | The dissolution rate to carbonate increased with the increase of temperature and pressure. The dissolution rate of acetic acid was greater than that of CO2-saturated solution. The higher the concentration of acetic acid fluid, the greater the dissolution rate | The dissolution rate of CO2-saturated solution to dolomite increased rapidly and was evidently greater than that to limestone |
| 6 | 5.56 | 1.27 | |||||
| 3 | Effects of lithology and physical properties on dissolution rate of carbonate | 7 | 19.80 | 1.70 | 2 mL/L acetic acid solution and CO2- saturated solution; internal dissolution of rock; open flow at 1 mL/min | With the increase of temperature and pressure, the dissolution amount (ion concentration) of acetic acid solution and CO2-saturated solution to dolomite was greater than that to limestone | With the increase of temperature and pressure, the dissolution amount (ion concentration) of CO2-saturated solution to dolomite was greater than that to limestone |
| 8 | 4.40 | 3.60 | |||||
| 4 | Relationship between temperature and dissolution amount | 5 | 6.78 | 1.43 | 1 mL/L acetic acid solution, 2 mL/L acetic acid solution, 4 mL/L acetic acid, 7 mL/L acetic acid solution, 8 mL/L acetic acid solution; internal dissolution of rock; open flow at 1 mL/min | With the increase of temperature and pressure, the dissolution amount (ion concentration) of acetic acid solution to dolomite increased, and there existed a peak of dissolution | With the increase of temperature and pressure, the dissolution amount (ion concentration) of acetic acid solution to dolomite decreased |
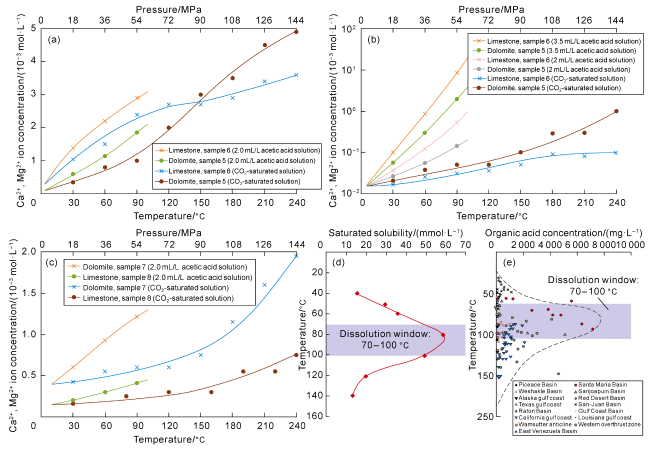
Fig. 6. Simulation results of controlling factors on dissolution rate of various carbonate minerals. (a) Simulation experiment on the effect of carbonate mineral types on dissolution rate; (b) Simulation experiment on the effect of fluid type and concentration on carbonate rock dissolution rate; (c) Simulation experiment on the influence of lithology and physical properties on carbonate rock dissolution rate; (d) Simulation results of the relationship between temperature, organic acid concentration and dissolution amount of carbonate rock; (e) The relationship between organic acid concentration and formation temperature in global typical oil and gas basins/regions. |
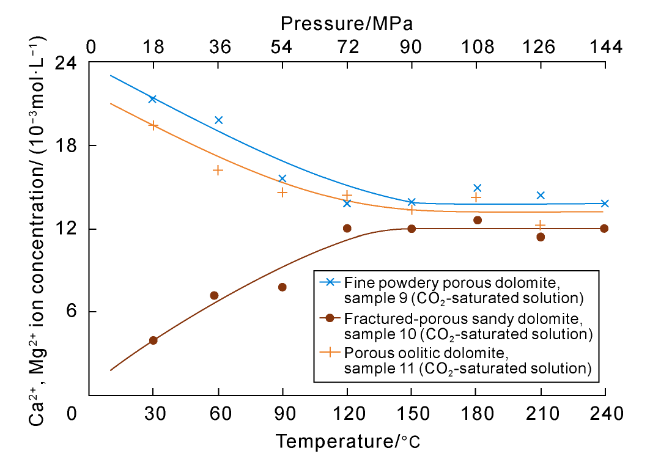
Fig. 7. Simulation experiments on pore preservation mechanisms of deep carbonate. Sample 9: Fine powdery porous dolomite, 5 994.00-5 994.15 m, Triassic Feixianguan Formation, Well LG001-1, Sichuan Basin. Sample 10: Fractured-porous sandy dolomite, 6 226.46-6 226.70 m, Triassic Feixianguan Formation, Well LG001-12, Sichuan Basin. Sample 11: Porous oolitic dolomite, 5 784.96-5 785.09 m, Triassic Feixianguan Formation, Well QB102, Sichuan Basin. |
The simulation results are of great significance for understanding the formation and distribution of carbonate pores. The simulation experiment on the dissolution rate of different carbonate rocks (Fig. 6a ) revealed that in the shallow-medium layer, limestone had a greater potential to form secondary dissolution pores through dissolution than dolomite, but in the deep to ultra-deep layer, dolomite had a greater potential to form secondary dissolution pores through dissolution than limestone. The results explained that deep to ultra-deep secondary dissolution pores are mainly developed in dolomite. However, deep to ultra-deep limestone is generally extremely tight, and secondary dissolution pores are mainly developed in shallow-medium or Meso-Cenozoic limestones. The simulation experiment on the effect of fluid type and concentration on the dissolution rate of carbonate minerals (Fig. 6b ) revealed that acetic acid is more aggressive than CO2- saturated solution (inorganic acid), and the fluid concentration is positively proportional to the dissolution rate of carbonate minerals. Fluid type, concentration and dissolution duration control the development of dissolution pores. In the process of hydrocarbon expulsion from source rocks, the concentration and quantity of organic acids associated with and migrated to carbonate rocks are the highest. The development potential of secondary dissolution pores in carbonate rocks is the largest. Meanwhile, the same dissolution law as shown in Fig. 6a was revealed, too, that is, the potential of deep to ultra-deep dolomite to form secondary dissolution pores is greater than that of limestone. The simulation experiment on the influence of lithology and physical properties on the dissolution rate of carbonate minerals (Fig. 6c ) revealed different dissolution laws in middle and shallow layers (Fig. 6a , 6b). The porosity of dolomite is much higher than that of limestone, and the ion concentration obtained by reaction fluid detected online is controlled by two factors (i.e., dissolution rate and specific surface area), so the specific surface area of dolomite dissolution is much larger than that of limestone. This is the real cause why the ion concentration of dolomite is higher than that of limestone, but it does not mean that the dissolution rate of shallow-medium dolomite is higher than that of limestone. It precisely reveals that initial porosity and permeability control ion concentration and the development potential of secondary dissolution pores, besides dissolution rate, and even the former two control more than mineral composition. Initial porosity and permeability, unconformity and faults control the plane distribution of dissolution pores, which are inherited and distributed along the pre-existing porous-permeable zones. The simulation experiment on temperature and dissolution amount (Fig. 6d ) revealed that dissolution pores were developed with events. The "peak of pore development" took place at 70-100 °C, and it’s consistent with the peak of hydrocarbon generation [38] (Fig. 6e ), providing a basis for predicting the enrichment of dissolution pores through reconstruction of burial, temperature and pressure and fluid histories.
In summary, the above four simulation experiments revealed that the pore development potential of dolomite in a deep to ultra-deep open system is greater than that of limestone, and controlled by the type and concentration of acidic fluid, and initial porosity and permeability. Dissolution vugs are mainly distributed in pre-existing pore and fracture zones. There exists a vertical "pore development peak", with pre-existing pores and fractures as dominant channels for acidic fluid migration.
3.3. Simulation experiment on pore preservation
In addition to pore formation and distribution mechanisms, pore preservation is another focus of the study on deep to ultra-deep carbonate reservoirs. The new visualization simulation experimental device, especially the real-time detection function for fluid composition and content at ultra-high-temperature and high-pressure, is a powerful tool for investigating the pore preservation mechanism of deep to ultra-deep carbonate rocks.
Generally, dolomite is the main type in deep to ultra-deep porous carbonate reservoir, and limestone with matrix pores is only developed on special geological background. Three groups of dolomite samples were selected for simulation experiment, which are fractured- porous sandy dolomite (porosity of 9.85%, permeability of 6.19×10⁻³ μm2), fine powdery porous dolomite (10.15%, 2.17×10⁻³ μm2) and porous oolitic dolomite (11.78%, 1.84×10⁻³ μm2). The reaction fluid was CO2-saturated solution. Dissolution inside the sample took place in a nearly closed system (the flow rate was 0.1 mL/min). The simulation experiment results were shown in Fig. 7.
In the shallow-medium layers, the dissolution rate of fractured-porous sandy dolomite increased with the increase of temperature and pressure (reflected by the increase of dissolution amount and ion concentration), but the fine powdery porous dolomite and the porous oolitic dolomite behaved oppositely with seeming decreasing dissolution rates (reflected by the decreases of dissolution amount and ion concentration). In fact, such a result is related to the different pore-throat structures, but not a real decrease of dissolution rate. The dissolution capability of the porous dolomite was strong in the initial reaction fluid (CO2-saturated solution). However, as the ion concentration of the reaction fluid gradually increased and the ions cannot move out of the nearly closed diagenetic system in time (at a flow rate of 0.1 mL/min), the chemical reaction between the reaction fluid and the dolomite gradually reached dynamic equilibrium. As a result, the dissolution amount and the ion concentration decreased. In the fractured-porous sandy dolomite, the fractures are more permeable than the matrix pores, so the initial solution (CO2-saturated solution) was difficult to enter the matrix pores, resulting in a great decrease of the specific surface area for dissolution, and the initial ion concentration of the reaction solution much smaller than in the porous dolomite. However, with the increase of temperature and pressure, the reaction fluid gradually entered the matrix pores, the dissolution amount and the ion concentration gradually increased. The result is consistent with that in Fig. 6. However, whether it is the porous or the fractured-porous dolomite reservoir, when temperature reached 150 °C and pressure reached 90 MPa, a common equilibrium point appeared. After the equilibrium point, the ion concentration in the reaction fluid hardly changed with the increase of temperature and pressure, indicating that the chemical reaction between the reaction fluid and the dolomite has been completely equilibrant.
The above simulation results revealed that in a deep to ultra-deep open-flow diagenetic system, secondary dissolution pores could be continuously formed through the dissolution of acidic fluids, but in a nearly closed diagenetic system, the chemical reaction between acidic fluids and carbonate rocks may reach dynamic equilibrium. In this case, no secondary dissolution pores will be developed, or existing pores will be destroyed, so the latter could be preserved. According to the simulation results in Fig. 6 , it can also be inferred that with the uplift of carbonate formations and the decrease of temperature and pressure, minerals may precipitate from the saturated reaction fluid, and the cements may fill in the pores. In a long geological history, closed and open systems are alternative. Each stage of regional tectonic activities may break a closed system and make an open system. After a long period of structural stability and fluid flow, the open system may become closed again after reaching energy balance. Then energy accumulates again, and regional tectonic activities take place again, making the closed system open again. This cycle repeats cyclically in the geological history.
4. Conclusions
The new simulation experimental device that can regulate experimental temperature and pressure, and achieve real-time and visually detection of permeability and fluid composition and content at high temperature (higher than 300 °C) and high pressure (higher than 150 MPa) provides a new way to simulate the dissolution and precipitation process in deep to ultra-deep carbonate rocks under analogous geological conditions. Using the new device to carry out simulation experiments on samples, three geological understandings were obtained. First, lithology and initial pore-throat structure play an important role in controlling the evolution of pore-throat structure by following two models. Second, in a deep to ultra-deep open-flow system, the pore development potential of dolomite is greater than that of limestone, and is controlled by the type, concentration of acidic fluid, initial porosity and permeability. Secondary dissolution pores are formed continuously, and distributed in the pre-existing pore-fracture development zone. Third, in a nearly closed diagenetic system, after the chemical reaction between acidic fluid and carbonate rock reaches dynamic equilibrium, no secondary dissolution pores are formed, or early pores are destroyed, so that the latter can be preserved. The experiment reveals that the decreases of temperature and pressure caused by tectonic uplift results in carbonate minerals precipitating from saturated solution and destroying pores. The above understanding is of great significance for evaluating the pore-throat structure and development potential of deep and ultra-deep carbonate reservoirs, and predicting the controlling factors and distribution of high-quality carbonate reservoirs.
The new visualization simulation experimental device has some disadvantages. For example, it can’t detect porosity in real-time. Instead, the sample has to be taken out to measure its porosity after the dissolution simulation experiment at each temperature-pressure point. Another disadvantage is that the device has no function for online 3D photography and video although the dissolution process and change of the sample is visualized through the sapphire window cell. The photos of the pore-throat structure at different temperature and pressure points have to be taken through offline industrial CT scanning. These limitations reduce the efficiency and accuracy, and restrict its application and deep understanding of pore formation and preservation of deep to ultra-deep carbonate reservoirs.