

Introduction
As oil and gas exploration moves deeper into complex environments like deep earth, deep water and unconventional reservoirs, subtle reservoirs that are thin, deep and complex become targets for increasing reserves and production [1-4]. The examples include ultra-deep reservoirs in the Tarim Basin, deepwater resources in the South China Sea, and unconventional reservoirs in the Sichuan Basin of China. Due to low-resolution seismic data, it is difficult to identify such reservoirs. In addition, complex structures (i.e., fractures and faults) pose risks on drilling operation [5]. To meet the needs of fine reservoir description, and ensure safe and effective drilling operation, it is urgent to improve the resolution of seismic data near drilling path and ahead of drill bit. High-resolution seismic data are necessary for accurately imaging geological structures like weak formations and faults, defining the boundaries and locations of geological bodies, and consequently locating wells, designing borehole trajectories and preventing drilling risk.
Seismic data are mostly narrow-banded, blurry and low-resolution due to formation absorption, energy attenuation and wavelet interference [6-7]. Conventional high-resolution processing methods mainly rely on deconvolution that compresses seismic wavelets from broad pulses into spike-like reflection sequences [8]. Currently, sparse spike deconvolution is the most widely used approach. It introduces sparse prior information or regularization constraints into the objective function to reduce the non-uniqueness of reflection coefficient inversion [9-10]. Common regularization constraints include L1 norm, Lp norm (0<p<1), Cauchy criterion, Huber criterion and Sech criterion [11-13]. These constraints are based on sparsity assumptions to obtain full-bandwidth reflection coefficient sequences. However, deconvolution is only available for seismic data. The inversion results beyond the frequency band of seismic data are unstable, and easily affected by noises or with aliasing artifacts [14].
With the application of artificial intelligence (AI) for petroleum exploration, intelligent high-resolution processing techniques based on deep learning have achieved remarkable progress. Unlike traditional deconvolution methods, intelligent high-resolution processing no longer relies on white noise or sparsity assumptions to obtain spike pulses. Instead, it incorporates high-frequency information from well logging data. By integrating well and seismic data, these techniques learn the statistical relationships and implicit connections between seismic data and high-resolution data (e.g. the result of convolution between reflectivity and one broadband wavelet). This enables the establishment of nonlinear mapping operators that transform narrowband seismic data into broadband high-resolution results [15-16]. These neural network- based operators employ multiple nonlinear layers to characterize the high-resolution processing workflow, exhibiting both strong robustness and efficient computational performance [17-19]. Data-driven high-resolution operators also exhibit significant flexibility, enabling the integration of physical processes and incorporation of multivariate information [20]. The fusion approaches between data-driven and existing model-driven algorithms can be categorized into two types. The first approach improves conventional optimization algorithms using artificial intelligence concepts to establish adaptive mathematical representations, such as introducing Bayesian learning [21] or backpropagation [22]. The second approach constructs physics-guided networks based on the iterative processes of conventional optimization algorithms to enhance the interpretability of intelligent high-resolution processing techniques [23-24]. By integrating geophysical domain knowledge, dual-supervised or semi-supervised networks with forward-inverse synergy can be established to improve operator stability [25-26].
In drilling scenarios, as exploration progresses, well location information keeps updating. Applying dynamic drilling data for establishing velocity-while-drilling models and migration imaging has achieved preliminary success [27]. Leveraging the advantages of artificial intelligence in multi-information fusion, this study designs a high-resolution seismic data processing technique specifically for drilling scenarios. It fully uses multi-information fusion and consists of three stages: pre-drilling processing, drilled well correction, and updating while drilling. And an AI-based high-resolution processing architecture is proposed, from which new information is progressively supplemented to improve the accuracy of high-resolution seismic data processing results. Application to the real data from the Bozhong Sag in the Bohai Bay Basin has verified the effectiveness of the progressive high-resolution processing technique. In addition, the fidelity of the high-resolution seismic processing results has been validated from multiple perspectives including well logging data, mud logging data, and near-well geological bodies.
1. High-resolution seismic processing architecture for drilling scenarios
Geologists suggest that understanding subsurface structures is a progressively updating process. With more and more information, geological interpretation would be more and more accurate [28]. Guided by the idea, this study analyzes the progressive information accumulation process in drilling scenarios, and divides high-resolution processing into three stages: pre-drilling processing, drilled well correction, and updating while drilling (Fig. 1). Seismic data resolution is progressively improved throughout the workflow. To address challenges at each stage, corresponding solutions are proposed. Finally, a progressive high-resolution processing technique is proposed for drilling applications (Fig. 2).
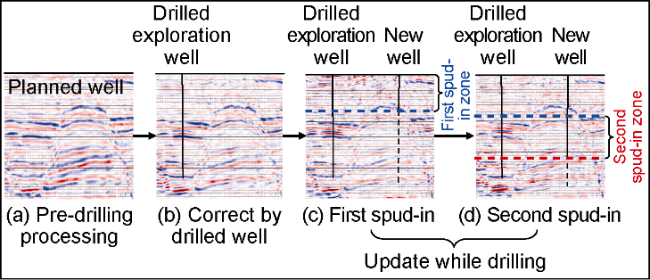
Fig. 1. High-resolution seismic data processing scheme for drilling scenarios. |
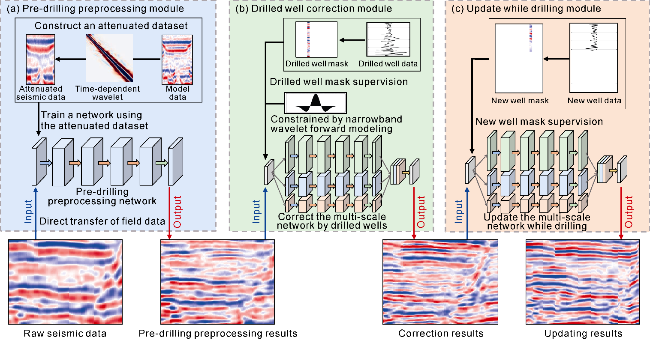
Fig. 2. Progressive high-resolution seismic data processing framework. |
1.1. Pre-drilling processing
Pre-drilling processing refers to the high-resolution processing of seismic data before drilling operation to obtain high-definition seismic data. Available information mainly comes from the seismic data itself. As shown in Fig. 1, the focus in drilling scenarios is on the near-wellbore trace data. Therefore, the challenge in pre-drilling high-resolution processing lies in the significant vertical variations in formation characteristics, requiring special attention to the geological structure and stratigraphic information from shallow to deep in the planned drilling area. Affected by formation absorption, seismic waves experience energy attenuation as they propagate from shallow to deep layers, and the seismic wavelet exhibits time-dependent effects. This results in increasingly blurred and information-poor seismic data with depth, thereby increasing the difficulty of seismic processing.
This gradual attenuation of information from shallow to deep layers is influenced by multiple factors. Taking amplitude attenuation as an example, its decay relationship can be expressed by the following formula:
where seismic wave amplitude A attenuates with seismic quality factor Q which characterizes formation absorption attenuation. With a known accurate Q, amplitude attenuation can be compensated through inverse Q filtering. However, complex subsurface structures make it difficult to get accurate characterization of absorption attenuation. Especially for severe attenuation by deep formations, it is urgent to enhance the resolution of seismic data. This paper proposes a high-resolution processing method with attenuation compensation capability and constructs an inverse operator that transforms attenuated and blurred data into clear data. Finally, based on a deep convolutional neural network architecture, and trained by a dataset composed of model data and time-dependent wavelets, a preprocessing module is established, as shown in Fig. 2a. Seismic data preprocessing makes deep information homing and the frequency bandwidths of shallow and deep data consistent, reducing potential mismatches between seismic responses and geological formations.
1.2. Drilled well correction
Pre-drilling processing results are corrected by available well data. Although data from drilled wells only cover a small scale, they are accurate and effectively complement seismic data. Seismic events from deep formations exhibit broader wavelets and narrower frequency bandwidths. Although these time-dependent wavelets are relatively accurate, information extracted in pre-drilling processing is limited. Available well data not only significantly enhance the structural characterization of deep formations, but also improve the fidelity of high-resolution seismic processing. On the other hand, there is a discrepancy in range. Seismic data contain all information within the dominant frequency range. After pre-drilling processing, some low-frequency components are recovered, but the high-frequency components are still weak. Well data contain strong high-frequency information, but with weak low-frequency and dominant-frequency components. How to effectively fuse seismic data with well data is a challenge. This paper proposes a mask-based semi-supervised operator (Fig. 2b) that strategically incorporates high-frequency well information while preserving mid-to-low frequency components of seismic data. This approach enables superior integration of multi-scale data through balanced utilization of well and seismic information to mitigate their mismatch caused by scale discrepancy. The fidelity of high-fidelity seismic processing results is improved.
1.3. Updating while drilling
The updating-while-drilling procedure is critical in high-resolution seismic processing for drilling operations. After pre-drilling processing and drilled well correction, a preliminary understanding of the new well location has been established, and deep weak reflection responses are available in the high-resolution seismic data. The primary objective of updating while drilling is to utilize information from drilled wells to predict and refresh the formation understanding ahead of the drill bit, thereby further enhancing the accuracy of high-resolution seismic processing results. As shown in Fig. 1, the first spud-in provides initial well data within a short interval, and the second spud-in extends the well coverage and validates predictions made on the first spud-in data.
In updating while drilling scenarios, high-resolution seismic processing primarily faces challenges in production application, and efficient computational performance is necessary. The method for integrating new well information into processing must be simple and rapid. This study develops a mask architecture (Fig. 2c) which dynamically updates the mask length according to depth and new drilling data. At the beginning, information is limited, so a short mask length is used. As drilling advances and more data become available, the mask length increases correspondingly. This adaptive mechanism ensures precise integration of new well information into the high-resolution seismic processing workflow, thereby improving the alignment between processed results and actual formation characteristics. The architecture is directly coupled with pre-drilling processing and drilled well correction modules, forming a comprehensive progressive high-resolution seismic data processing system (Fig. 2). This approach facilitates efficient incorporation of new well information and demonstrates superior adaptability to the changing formation conditions ahead of the bit. Through dynamic adjustments and synergistic combination with existing well data, the method effectively mitigates mismatches while enhancing the congruence between high-resolution seismic outputs and subsurface geology. Consequently, it enables real-time updating of formation information ahead of the drill bit in field applications.
2. Progressive high-resolution seismic data processing system
2.1. Pre-drilling preprocessing module
To meet the requirements of pre-drilling processing, this study establishes a pre-drilling preprocessing model based on time-varying wavelets. The primary step in constructing the preprocessing model involves acquiring substantial training data, typically generated from model data. Initially, design a time window to scan the seismic data from top to bottom, and employ the bispectrum method to extract wavelets segment by segment, to obtain a time-varying seismic wavelet dataset [29-30]. According to the seismic record convolution model:
Perform Fourier transform on both sides and get the amplitude spectrum relationship in frequency domain:
In frequency domain, the seismic record simultaneously contains both seismic wavelets and reflectivity, which are difficult to separate from each other. Under spectral simulation, the amplitude spectra of seismic wavelets primarily represent the smooth low-frequency components. By applying Fourier transform to both sides of Eq. (3), we get the bispectrum calculation formula:
$A_{\mathrm{s}}^{(2)}(f)=\frac{1}{2 \pi} A_{\mathrm{w}}^{(2)}(f)^{*} A_{\mathrm{r}}^{(2)}(f)$
In bispectrum domain, seismic wavelet information is concentrated in low frequencies, and reflectivity dominates high frequencies. Apply a low-pass filter to the bispectra to preserve the low-frequency components, then perform inverse Fourier transform to get the amplitude spectra of seismic wavelets, and finally the seismic wavelets in time domain [31]. The low-pass filter coefficient for bispectra is given by:
$\operatorname{cLow}(i)=0.5\left(1+\cos \left(\frac{2 \pi(i-1)}{N t}\right)\right) \quad(i=1,2, \cdots, N t)$
When i=1, clow(1)=1 means to preserve all frequency components. As i approaches to Nt/2, clow(i) approaches 0, and high-frequency components are strongly suppressed. The low-pass filter coefficient leverages the cosine function to smoothly adjust the weighting factors of different frequency components to accurately extract seismic wavelets by gradually filtering processing. Use the time-varying wavelets to construct a symmetric matrix. In the time-varying wavelet matrix, the wavelets along the diagonal demonstrate the progressive time-varying effects from shallow to deep formations. The main lobe gradually becomes wide, while the side lobe lasts longer.
Convolve the high-resolution model data with the time-varying wavelet matrix to get synthetic seismic data. Using them as input and the high-resolution model data as output, train the preprocessing network shown in Fig. 3. This network first increases the dimension of the input seismic profile, then sets a 21×1 convolutional layer and a 10×1 pooling layer, and uses ReLU as a nonlinear activation function, and finally, reduces the dimension and outputs the high-resolution profile. After trained by model data, the final pre-drilling preprocessing model is capable of transforming input seismic data into high-resolution data, as expressed by the following equation:
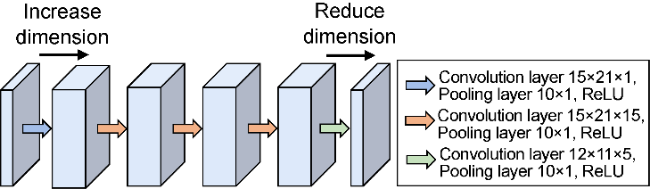
Fig. 3. Preprocessing network architecture. |
2.2. Drilled well correction module
The integration of drilled well information necessitates the fusion of multi-scale data. This study proposes a frequency-scale transform-based [32] multi-scale network (Fig. 4) which is constrained by the drilled well correction module (Fig. 2b) that uses pre-drilling processing results as input and outputs corrected high-resolution data. This semi-supervised module employs bidirectional forward-inverse constraints: the forward process enforces mid-low frequency consistency by convolving both input and corrected data with narrowband wavelets to establish spectral correlations, while the inverse process applies a null-valued mask matrix (excluding well locations) to compute errors exclusively between well-derived high-resolution data and corrected outputs. The module's loss function calculated as follows:
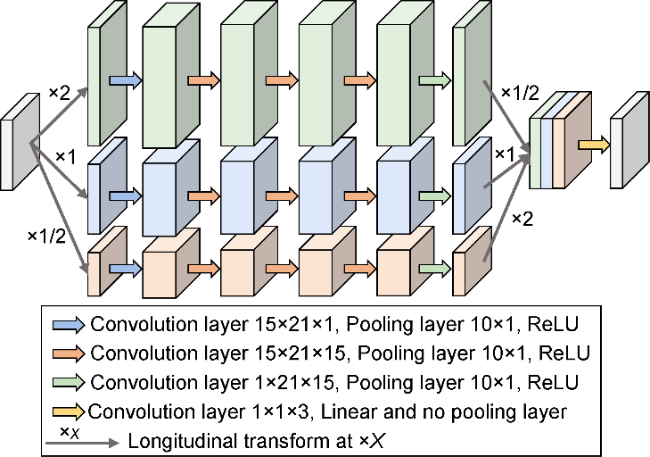
Fig. 4. Multi-scale network architecture. |
The regularization parameter λ governs the influence of drilled well information on the corrected results. When λ is relatively small, the well data have limited impact on the corrections, making the results rely more heavily on the predrilling processing output. In this case, the well information may not be fully utilized to enhance resolution. Conversely, when λ is large, the weighting of well data increases significantly. However, this may lead to overfitting of the well data, resulting in good performance near the well locations but introducing artifacts into other areas. Therefore, selecting an appropriate λ value requires careful consideration of the characteristics of actual data. Comparative experiments with different λ values should be conducted to determine the optimal parameter that achieves balanced integration between well and seismic data.
2.3. Update-while-drilling module
Data updating while drilling dynamically changes and exhibits a similar scale to old well data. This study employs a mask-based approach to introduce the data updating while drilling as a constraint (Fig. 2c), which also updates the multi-scale network shown in Fig. 4. The mask contains valid values only at positions with newly updated information, but zero in other areas. After the first spud-in operation, new well information is introduced and the loss function is modified into the following expression:
The regularization parameter μdrill1 controls the influence of new data on the updating results. The larger the μdrill1, the stronger the reliance on new well information is. After the second spud-in operation, the loss function is updated by simply extending both the mask length and the length of the new high-resolution data, as expressed below:
The same principle applies to subsequent operations (third spud-in, fourth spud-in, etc.), demonstrating the capability of the update-while-drilling module to adapt flexibly to dynamic information changes during drilling operations. With training time at the minute level for each drilling phase, the system provides crucial practical advantages: it enables timely update of high-resolution seismic processing results based on new drilling data, delivers rapid decision supports for drilling operations, minimizes time loss caused by processing delay, and ultimately enhances overall drilling efficiency.
3. Field application
In a drilling operation scenario at an oilfield in the Bohai Sea of China, the progressive high-resolution seismic processing technology proposed in this study was tested. The target zone between 3 000 m and 4 000 m primarily consists of buried hill structures with moderately to highly angled fractures. The maximum depth of the raw seismic data is approximately 4 000 m. The data resolution is low. The dominant frequency is about 15 Hz and the maximum effective frequency is around 30 Hz. Considering both subsurface geology and seismic data quality, this application focused on seismic data below 3 000 m (approximately 2.3 s in time domain). Based on the application results, the high-resolution processing technology was evaluated, and quantitative analysis was conducted on the case study.
3.1. Variations in high-resolution seismic processing results in drilling scenarios
Using the old and new wells in the case study as benchmarks, we designed a 2D well-tie profile for comparative analysis. First, the raw seismic data were preprocessed using the progressive high-resolution seismic processing technology proposed in this study, covering a depth range from 2 500 m to 3 900 m (equivalent to 2.0-2.8 s in time domain). Subsequently, the information of the old well with MD of approximately 4 000 m and fully penetrating the target zone was introduced to correct the preprocessing results. Next, the new well data from the first spud-in operation (to about 3 000 m, or 2.3 s) was used to update the high-resolution results. Finally, the second spud-in data (to 3 400 m, or 2.6 s) further updated the processing results ahead of the drill bit.
As drilling information accumulates, the processing effectiveness and accuracy gradually improve, and the high-resolution seismic processing results become increasingly clear (Fig. 5). The raw seismic data exhibits blurred formations and poorly defined seismic events, making fine stratigraphic interpretation difficult. After pre-drilling processing, the seismic resolution is significantly improved compared to the original data. However, below 2.4 s (deeper than 3 100 m), the formations are still indistinct, or no change on the raw seismic data. After corrected by old well data, the data became better below 3 100 m, and new seismic events appeared. With the first spud-in update, although the drilling bit hasn't yet reached the target zone, the updated data provided valuable guidance for the following operation. After the second spud-in update, and the target zone became nearer and nearer, the ahead-of-bit seismic results were more accurate, the discernible stratigraphic information became richer and the resolvable formation thickness became finer (black arrows in Fig. 5).
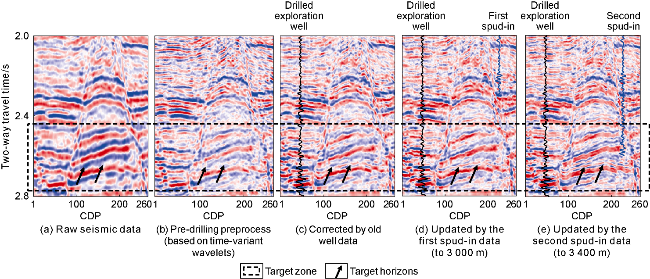
Fig. 5. Case study of the progressive high-resolution seismic processing technology. |
3.2. Weak seismic reflections enhanced by well data
Compared to the original seismic data, the pre-drilling high-resolution processing results exhibit a broader frequency bandwidth with rich low-frequency and high-frequency components. However, since the processing relies solely on seismic data, zones with weak seismic responses show limited resolution improvement due to insufficient information, as demonstrated in Fig. 5b. This limitation can be made up by incorporating abundant high-frequency information from drilled wells, namely compensating for missing information with well data.
Directly mapping between seismic data and real well- corrected high-resolution data may result in poor model stability and generalized near-well application. This paper proposes a semi-supervised multi-scale architecture that integrates multi-band frequency information and imposes bidirectional closed-loop constraints (forward and inverse modeling) on the high-resolution seismic processing results corrected by old well data. In this framework, mid-to-low frequency components are primarily derived from seismic data and pre-drilling processing results, and high-frequency components are corrected by old well data, thereby enhancing both the stability and the generalization capability of the correction operator.
The frequency comparison (Fig. 6) between pre-drilling processing section (Fig. 5b) and well corrected section (Fig. 5c) found that the information below 30 Hz on both sections is similar. However, after corrected by well data, the information above 30 Hz became significantly rich, particularly below 2.4 s (deeper than 3 100 m). The additional information above 30 Hz increased the discernible seismic events and identifiable details on the corrected section (black circles in Fig. 6). This demonstrates that although the incorporation of well data challenges multi-scale data fusion, it can effectively enhance weak signals on both original seismic and pre-drilling processing sections while making up missing information.
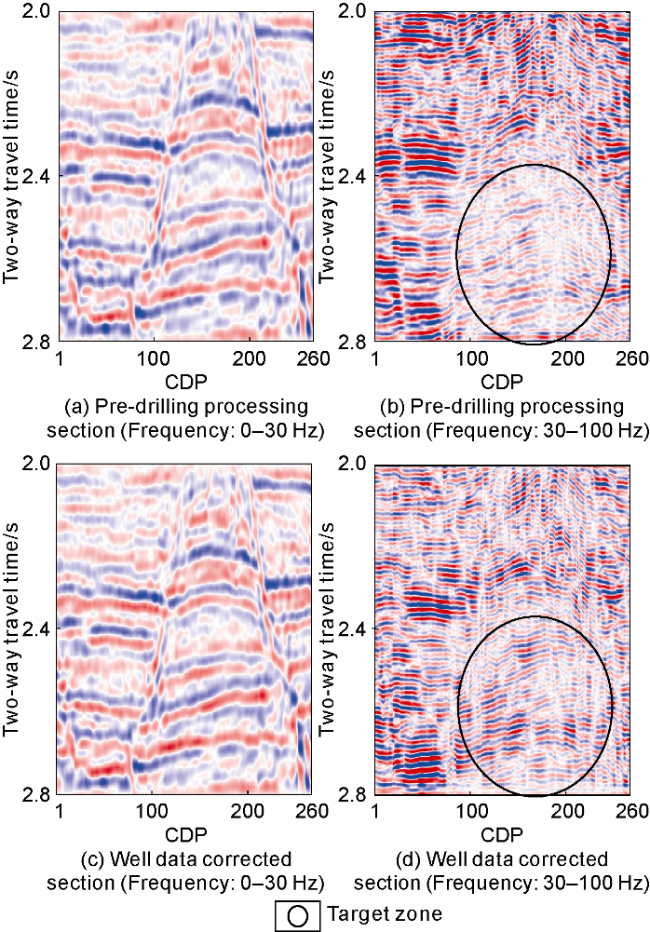
Fig. 6. Comparison between pre-drilling and well-corrected processing results. |
It should be noted that abnormal fractures appeared in the bottom left corner of the corrected section (Fig. 6d). This is ascribed to a big range difference between seismic data and well data, making difficult data fusion, poor match and unsmooth fracture transition. Although the semi-supervised operator and the multi-scale fusion architecture can make a compromise to some extent and improve the stability and generalization of the technology, improvement is necessary in dealing with complex fracture information.
3.3. Effectiveness analysis of updating-while-drilling practice
Following old well data correction, the high-resolution seismic section was updated by new data while drilling on the same multi-scale fusion architecture. In view of the information below 30 Hz is similar to the pre-drilling processing section, here we only analyze the effectiveness of the information above 30 Hz.
A comparison between the sections updated by the first and the second spud-in data (Fig. 7) reveals that after the first spud-in update, new thin bed information appeared in the second spud-in target zone ahead of the bit, and these thin beds were verified true by the second spud-in data (blue arrows in Fig. 7). This demonstrates that real-time drilling information can effectively predict undrilled formations ahead of the bit, and the prediction is consistent with the result constrained by old well data. After updated by the second spud-in data, the high-resolution seismic data ahead of the bit to 2.6 s (the weak reflection zone below 3 400 m) exhibits enhanced seismic reflections and lateral continuity of the thin beds (red arrows in Fig. 7).
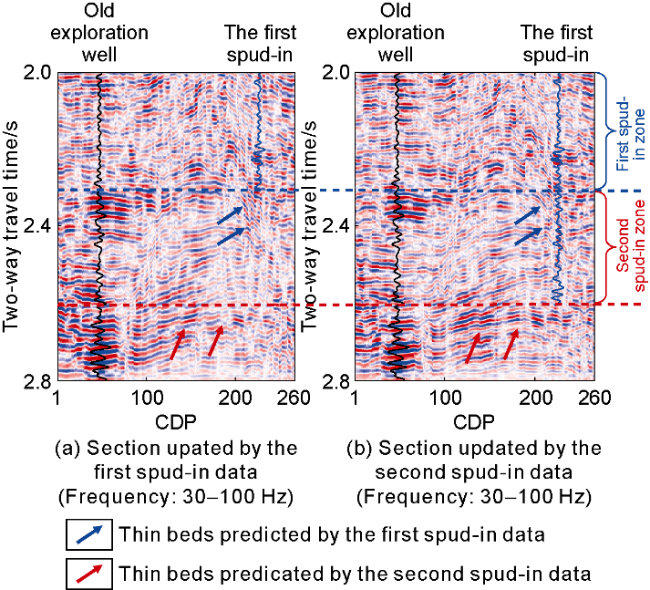
Fig. 7. High-frequency characteristic comparison between sections updated by the first and the second spud-in data. |
Time-frequency analysis was performed on the predicted zone ahead of the bit at 2.6-2.8 s (3 400-3 700 m deep) (Fig. 8). Compared with the section updated by the first spud-in data, the section updated by the second spud-in data exhibits clearer thin bed features and more complex geological structures in the undrilled zone. The time-frequency spectra at 30 Hz are similar on the sections, but the time-frequency characteristics at 50 Hz are richer and more continuous laterally on the section updated by the second spud-in data.
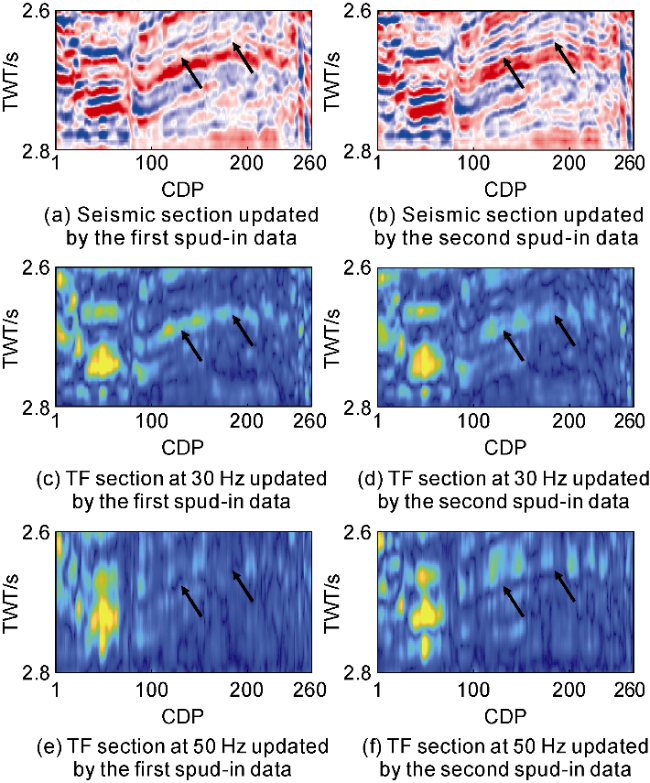
Fig. 8. Time-frequency characteristic comparison between sections updated by the first and the second spud-in data (2.6-2.8 s and 3 400-3 700 m). |
These analyses demonstrate that data while drilling can effectively predict undrilled formations ahead of the bit, particularly for enhancing high-frequency thin bed information.
3.4. Fidelity assessment
To better adapt to actual drilling scenarios, the fidelity of the high-resolution seismic processing results updated by data while drilling ahead of the bit was analyzed from three perspectives: well logging, mud logging, and drilling engineering.
First, the results near the well being drilled were verified (Fig. 9), namely within 125 m on both sides of the well, and 2.4-2.6 s (3 100-3 400 m deep in the second spud-in zone). Fig. 9a to Fig. 9d show the formation information ahead of the bit became richer and richer as updated while drilling. For example, the two red dashed boxes only have weak responses on the original seismic data (Fig. 9a), but layered features appeared after updated by new drilling data (Fig. 9c, 9d). Near the new well, the original seismic data have weak effective signals. Although pre-drilling processing (Fig. 9b) restored numerous new seismic events, these signals are concentrated where seismic reflections exist, and poorly correlate with well logging data. After updated by the first spud-in data (Fig. 9c), more thin layers clearly appeared in the second spud-in zone that’s not drilled, and these features correlate well with the actual high-resolution logging data. After updated by the second spud-in data (Fig. 9d), the discrepancy between the processing result and real well data became smaller, and their correlation was further improved.
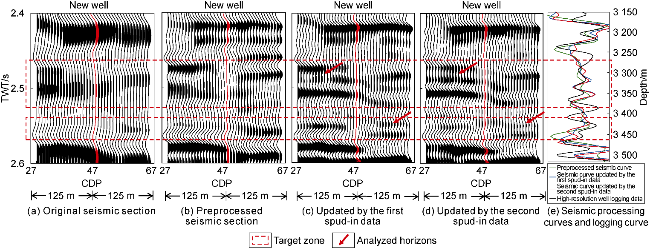
Fig. 9. Seismic processing results and comparion with well logging data (125 m around the new well). |
Fig. 9e shows the high-resolution seismic processing curves near the new well in different stages. As information was added, the seismic processing curve became increasingly consistent with the well logging curve, particularly in the red dashed box.
Data at different stages shown in Table 1 confirm the error becomes smaller and the correlation becomes closer between high-resolution seismic processing results and well logging data from pre-drilling processing to first spud-in update and then to second spud-in update. This gradual change demonstrates that updating while drilling has positive significance in improving the accuracy of high-resolution seismic processing results, and provides more valuable formation information for subsequent drilling operation.
Table 1. Errors and correlations between processing results and well logging data at different stages |
| Processing stage | Mean square error | Correlation coefficient/% |
|---|---|---|
| Pre-drilling processing | 0.274 2 | 24.85 |
| First spud-in update | 0.186 3 | 56.41 |
| Second spud-in update | 0.127 0 | 72.27 |
Secondly, the high-resolution seismic processing results ahead of the bit were verified by mud logging data (Fig. 10). The mud logging data provided more detailed lithological interface information for validating the reflectors in the seismic data. In the undrilled zone below 2.6 s (deeper than 3 500 m), the original seismic data (Fig. 10a) showed only a weak response, whereas the high-resolution results updated by the second spud-in data (Fig. 10b) revealed two distinct thin layers. The high-resolution seismic data constrained by well logging data (Fig. 10c) exhibited similar formation interfaces to the second spud-in well data. Compared with the mud logging data (Fig. 10d), the new formation interfaces corresponded to the lithological boundaries extracted from the composite mud log. Similarly, the gas logging curves with significant variations also matched the new formation interfaces. This further confirms that the high-resolution seismic results updated by data while drilling has high fidelity, and provide valuable guidance for safe drilling operations.
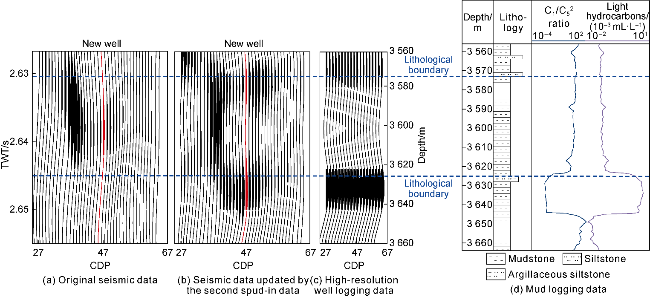
Fig. 10. Ahead-of-bit weak seismic response enhanced by new well data and validated by mud logging data. |
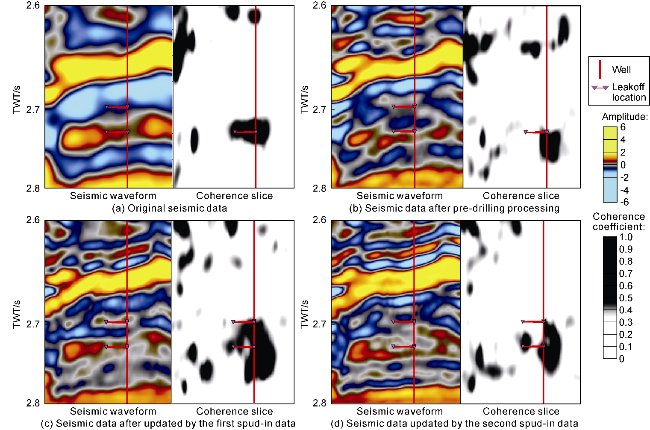
Finally, the high-resolution seismic processing results were verified by drilling engineering data (Fig. 11). Within the interval of 2.6-2.8 s (3 500-3 950 m deep), waveform and geosteering coherence attribute analyses [33] were performed on the near-well traces to evaluate the results based on fracture information and lost circulation locations caused by natural fractures. In Fig. 11, the left are seismic waveforms and the right are coherence slices on each plot. The analysis reveals progressive improvements in waveform characteristics, formation resolution and continuity from original seismic data to pre-drilling processing, first spud-in update, and second spud-in update. Notably, formation changes become more pronounced at lost circulation locations, with amplitude variation from no to obvious. This trend is more evident on the coherence slices. Fracture information was only found at about 2 725 ms (3 820 m) where lost circulation occurred on the original and the pre-drilling processed sections, but it appeared at 2 700 ms (3 765 m) and 2 725 ms (3 820 m) on the seismic sections updated by the first and the second spud-in data. Especially, the fractures systems became more visible after updated by the second spud-in data, and almost consistent with real lost circulation points. This confirms the geological features extracted from the ahead-of-bit seismic data updated by the second spud-in data are similar to the geological risks encountered in actual drilling operation. The fidelity of the seismic data updated while drilling is high. And the earlier the new drilling data are used, the more accurate the prediction.
Fig. 11. Fracture information resolved by seismic data updated by new drilling data and validated by acutual drilling data (waveform, coherence slice, and leakoff location). |
3.5. Quantitative evaluation
To investigate the practical effectiveness of updating while drilling, the high-resolution seismic processing results were quantitatively analyzed (Table 2). The dominant frequency of the original seismic data is approximately 15 Hz. After pre-drilling processing, it was escalated to about 30 Hz, achieving certain bandwidth extension within the effective frequency range. After updated by the second spud-in data, the dominant frequency was further improved to approximately 60 Hz, demonstrating more significant bandwidth extension. Based on the dominant frequency, resolvable formation thickness was calculated using the following formula [34]:
First, the temporal resolution tR was calculated based on the dominant frequency, and then the resolvable thickness zR was determined by considering interval velocity which is about 3 100 m/s in this study. According to the original seismic data, the resolvable thickness is 44.93 m. It’s 14.98 m after pre-drilling processing, and 11.23 m after updated by new well data. This is a good optimization result.
Table 2. Quantitative evaluation on high-resolution seismic data at different stages |
| Seismic data | Dominant frequency/Hz | Resolvable thickness/m |
|---|---|---|
| Original | 15 | 44.93 |
| Pre-drilling processed | 45 | 14.98 |
| Updated by the second spud-in data | 60 | 11.23 |
It should be noted that the quantitative results above are theoretical analysis based on the whole target zone. In field applications, geological structures are complex and heterogeneous, and the reflection responses from different layers are different, which control the interpretation precision.
In addition, during drilling operation, small geological hazards couldn’t be resolved only through high-resolution seismic processing. Seismic attribute analysis can detect smaller geological features [35]. As shown in Figs. 10 and 11, the seismic responses from the geological bodies less than 10 m are detectable, indicating a resolvable capability of high-resolution data.
4. Challenges and future development
The updating-while-drilling high-resolution seismic processing technology proposed in this paper represents a universal design concept and processing framework that can be directly extended to geophysical and drilling engineering applications such as elastic parameter prediction (P-wave velocity, S-wave velocity, density, etc.) and mechanical parameter updates. Nevertheless, research integrating drilling with seismic data is in the early exploratory stage, so discrepancies between high-resolution seismic processing results and actual drilling data may exist. For instance, the accuracy of imaging velocity is critical for drilling-seismic integration. Future research should focus on the following eight aspects:
(1) Integrate seismic data with highly deviated or horizontal wells to cope with complex geological structures and drilling conditions;
(2) Analyze the intrinsic relationships among drilling parameters, mud logging data and seismic data and establish integrated geological-geophysical-drilling models and algorithms;
(3) In zones with rich fractures, research structure-adaptive algorithms by incorporating flexible constraints and dynamically updatable parameters to enhance fracture identification and preservation, and explore dynamic weight allocation to maintain fracture continuity based on geological significance, for better processing fracture information and delivering more reliable results;
(4) In drilling operations, high-resolution processing effectiveness is closely related to and significantly influenced by time-depth relationship. Subsequent efforts will emphasize leveraging drilling data to further improve well-seismic calibration quality, thereby providing a more robust foundation for high-resolution seismic processing and inversion;
(5) Address the learning biases in AI-based high-resolution processing operators to enhance sensitivity to weak amplitude variations in seismic data, and enable effective identification of thin beds for better drilling engineering support;
(6) In geologically ultra-complex areas where formation continuity cannot be guaranteed, optimize algorithm models to improve adaptability to complex geological conditions;
(7) Investigate the impacts of two or more wells drilled or being drilled on seismic resolution enhancement and how to better utilize multi-well information for method optimization;
(8) Since accurately predicting geological features ahead of the bit only through seismic waveform and amplitude analysis remains challenging, additional parameter inversion and feature prediction (e.g., velocity inversion, attenuation characterization), and establishing direct correlations with geological features are worthy to investigate.
5. Conclusions
Based on multi-information fusion and following a ‘three-step’ strategy, this study proposes a progressive high-resolution seismic processing method for drilling scenarios, which consists of pre-drilling preprocessing, drilled well correction, and updating while drilling modules. The pre-drilling processing module utilizes time- varying wavelet effects to enhance amplitude preservation. The drilled well correction module integrates old well data with seismic data to establish a multi-scale seismic-well data fusion framework. Updating while drilling means dynamic muti-scale information fusion, and update high-resolution seismic processing results in real time. Field application has demonstrated that drilling data could significantly improve high-resolution seismic processing results by more than doubling the resolvable thickness ahead of the bit. The technology is advantageous for recovering thin beds and ahead-of-bit information, and provides accurate formation data for safe and effective drilling operation. Additionally, fidelity verification and quantitative analysis were conducted from well logging, mud logging, and drilling engineering perspectives. Real-time seismic-well integration still faces challenges in reducing discrepancies between seismic processing results and actual formations. Future study should focus on at least eight technical aspects, such as to enhance imaging velocity accuracy, update seismic processing results while drilling highly deviated or horizontal wells, and AI/machine learning-based seismic processing.
Nomenclature
A—seismic amplitude;
Ar—amplitude spectrum of reflection coefficient;
Ar(2)—second amplitude spectrum of reflection coefficient;
As—amplitude spectrum of seismic record;
As(2)—secondary spectrum of seismic record;
Aw—amplitude spectrum of seismic wavelet;
Aw(2)—secondary spectrum of seismic record;
clow—low-pass filter coefficient;
f—frequency, Hz;
f*—dominant frequency of seismic data;
Fdrill1—first spud-in updating operator;
Fdrill2—second spud-in updating operator;
Fprel—pre-drilling preprocessing operator;
Fwell—drilled well correction operator;
Hprel—high-resolution output of pre-drilling preprocessing model;
i—index variable, positive integer ranging from 1 to Nt;
Lossdrill1—loss function for first spud-in update;
Lossdrill2—loss function for second spud-in update;
Losswell—loss function for drilled well correction module;
Nt—number of sampling points of seismic signals in time domain;
Q—quality factor characterizing seismic signal attenuation;
ReLU—nonlinear activation function;
Rdrill1—true high-resolution seismic processing results at first spud-in location;
Rdrill2—true high-resolution seismic processing results at second spud-in location;
Rwell—true high-resolution seismic processing results at drilled well location;
S—matrix composed of multiple seismic traces;
t—time-domain sampling point;
tR—time resolution of seismic data;
v—interval velocity;
Wlow—Toeplitz matrix composed of narrowband wavelets;
Ydrill1—first spud-in mask matrix;
Ydrill2—second spud-in mask matrix;
Ywell—drilled well mask matrix;
μdrill2—weight coefficient of second spud-in data;
zR—seismic resolvable thickness;
μdrill1—weight coefficient of first spud-in data;
ω—angular frequency of seismic wave;
λ—weight coefficient of drilled well data;
λ*—apparent seismic wavelength;
||•||2—L2 norm.