

Introduction
The development of deep shale gas (buried deeper than 3 500 m) in China, concentrated in the southern part of the Sichuan Basin, is still in the evaluation stage. Its resource volume accounts for 86.5% of the total shale gas resources in southern Sichuan [1]. The highest gas production during single-well test is 137.9×10⁴ m3/d, demonstrating a great potential of deep shale gas [2-3]. However, the production enhancement effects of deep shale gas horizontal wells vary greatly, with single-well test gas production mainly concentrated in (5-50)×104 m3/d [4-5]. This is ascribed to a mismatch between drilling, completion and production technologies and the geological-engineering demands for the shale gas reservoirs that suffer from deep burial, high temperature and large horizontal stress difference, so that basic theoretical and experimental data are insufficient for effective fracturing operation [6-13].
A large amount of field data shows that shale gas horizontal wells at relatively low backflow rates generally have higher production [14-15], and continuous fracture network expansion induced by shale hydration is one of the primary reasons. Shale contains a high content of clay minerals that are prone to water absorption. Water molecules entering the interlayer structure of clay minerals cause clay to swell and the cohesion among clay mineral particles decrease, consequently the detachment of mineral particles and further expansion of dissolution pores and fractures. Meanwhile, the decrease of shale mechanical strength promotes the development of weak planes, fracture initiation and propagation, thereby enhancing fracture network complexity. In response to these phenomena, many studies have been conducted. Wang et al. [16] conducted hydration experiments on the Silurian Longmaxi Formation shale in Changning area to observe fracture initiation, propagation and coalescence. Zhao et al. [17] carried out laboratory experiments and theoretical modeling on the deep shale of the Longmaxi Formation, and revealed that shale hydration damage was primarily resulted from the initiation and propagation of microfractures, and that the mechanical properties of the shale deteriorated with increasing hydration time. Ding et al. [18] developed a constitutive model for shale hydration damage in imbibition process, and found that hydration-induced fractures gradually propagated, the mechanical strength decreased and the mechanical stability became poor, and the shale transitioned from brittle to ductile. Moreover, hydration-induced microfractures provide a theoretical basis for widespread field application of post-fracturing shut-in operations [19-21].
Under the influences of deep burial, complex geological structures (i.e., faults, macroscopic natural fracture networks, folds), hydraulic fractures, drilling and borehole disturbances, deep shale is subjected to a true triaxial stress [22-24]. Due to the lack of equipment and methods for rock mechanics experiments under true triaxial stress, studies on rock mechanical properties are usually conducted under conventional triaxial or uniaxial stress conditions [25-30]. However, how shale mechanical properties dynamically evolve under deep complex geological conditions, and whether hydration research results from shallow to medium shale are still applicable, directly affect the influence of fracturing fluid on deep shale gas well production during the post-fracturing shut-in period.
Taking the deep shale in the Jiaoshiba block of Fuling shale gas field in the Sichuan Basin as a case, and using a GCTS true triaxial system to carry out mechanical experiments on deep shale after hydration under different temperatures, hydration durations and horizontal stress differences, this study obtained stress-strain data during the deformation and failure process, and revealed the variation law of the mechanical properties of the deep shale. The findings are helpful to understanding the hydration-induced fracturing mechanical mechanism during the shut-in of deep shale wells, scientifically and reasonably optimize shut-in time, increase fracture network complexity, and improve production of deep shale gas horizontal wells.
1. Experimental material and method
1.1. Material
The deep shale from the Jiaoshiba block of Fuling shale gas field in the Sichuan Basin was used as experiment samples. First, the outcrop rock samples from the Silurian Longmaxi Formation were cut into rectangular samples of 50 mm × 50 mm × 100 mm by wire cutting (Fig. 1), then the sample surfaces were ground and polished, and finally placed in a constant-temperature drying oven at 90 °C and baked for 24 h until their mass changed no more.

Fig. 1. Actual photograph of the experimental shale sample. |
To minimize the influence of sample anisotropy on experimental results, it is necessary to ensure that all samples have similar appearance, P-wave velocity and density. Samples used in this study were screened by following three steps: (1) Experimental samples were drilled from adjacent locations within the same outcrop to ensure similar mineral compositions. Visual inspection was conducted on the cut samples to exclude those with obvious fractures. As shown in Fig. 1, the samples exhibit a bluish-gray color, uniform and fine texture, and no obvious joints or fractures on the surface. Since bedding angle significantly influences rock mechanical parameters, seepage characteristics and fracture propagation [31-33], samples were drilled such that the bedding plane is parallel to the 50 mm × 50 mm end face. (2) Rock acoustic testing technology based on ultrasonic propagation can effectively characterize shale microstructure [34]. In this study, an ultrasonic detector was used to measure the P-wave velocity of the samples (Fig. 2). To obtain the samples with similar internal microstructures, those far from the values of (3.5 ± 1.0) km/s that most samples exhibit were excluded. (3) The density of the samples was measured using a high-precision electronic scale, and samples with density of (2 500 ± 1 000) kg/m3 (Fig. 3) were selected. Finally, 20 samples were selected for experiments: samples X-1 and X-2 were used for whole-rock mineral content and clay mineral content analysis; samples MD-1 to MD-8 and MG-1 to MG-8 for true triaxial mechanical experiments, with the density variance of 0.007 7 kg2/m6, indicating low variance and similar densities; samples MY-1 and MY-2 for verification of prediction model for the mechanical strength of shale after hydration.
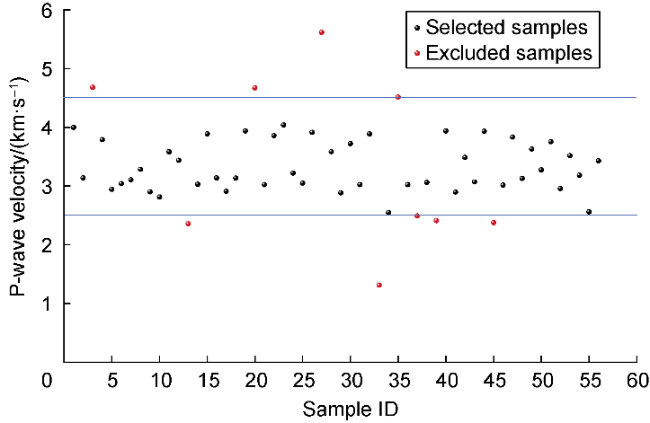
Fig. 2. Distribution of P-wave velocities of the shale samples. |
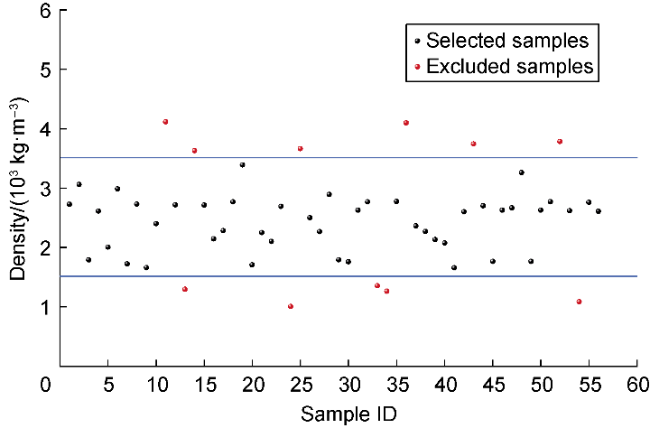
Fig. 3. Distribution of densities of the shale samples. |
For samples X-1 and X-2, 5 g was drilled and ground into 300 mesh (0.050 mm) from each for whole-rock mineral content analysis. Then an additional 30 g were taken and ground into 180 mesh (0.083 mm) for clay mineral content analysis. Both samples contain clay minerals more than 40%, of which illite is dominant, and ranges from 40% to 50% (Tables 1 and 2).
Table 1. Results of whole-rock mineral analysis |
| Shale sample | Quartz/% | Potassium feldspar/% | Plagioclase/% | Calcite/% | Dolomite/% | Pyrite/% | Clay/% |
|---|---|---|---|---|---|---|---|
| X-1 | 29.9 | 3.1 | 12.3 | 4.6 | 6.3 | 2.2 | 41.6 |
| X-2 | 27.7 | 3.3 | 11.0 | 5.3 | 6.1 | 2.9 | 43.7 |
Table 2. Results of clay mineral analysis |
| Shale sample | Illite/smectite mixed-layer/% | Illite/% | Kaolinite/% | Chlorite/% | Smectite/% |
|---|---|---|---|---|---|
| X-1 | 46 | 48 | 0 | 6 | 0 |
| X-2 | 52 | 43 | 0 | 5 | 0 |
Mercury intrusion porosimetry was conducted on samples X-1 and X-2, and the results show that the peak mercury intrusion corresponds to a pore diameter of approximately 10 nm. As shown in Fig. 4, the mercury intrusion volume is significantly lower for pores smaller than 2 nm or larger than 50 nm, indicating that the connected pores in the deep shale of the Jiaoshiba block are predominantly mesopores. These results indicate that the deep shale samples used in this study have high clay mineral contents and well developed micro- and nano- pores, inducing enhanced water absorption and hydration proneness [35-36].
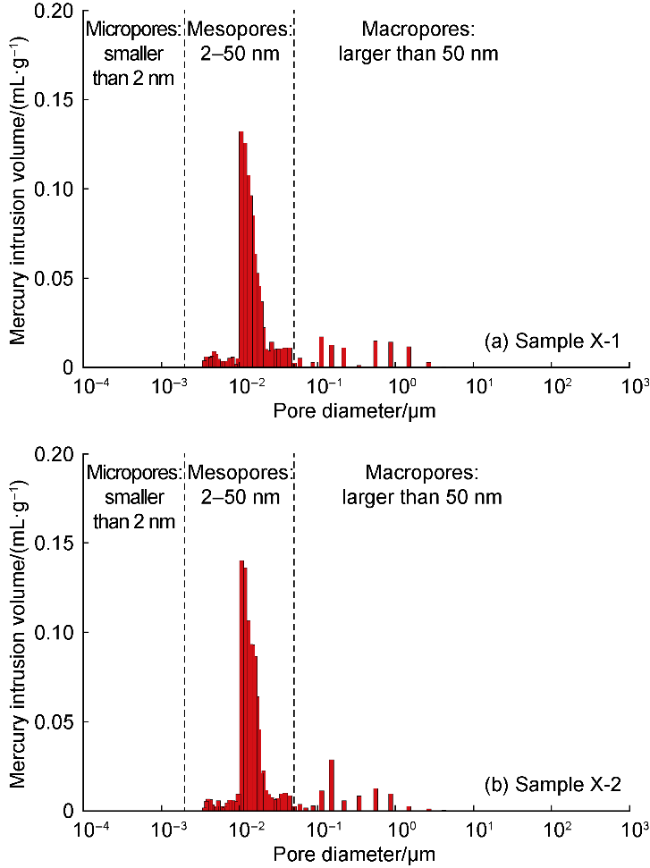
Fig. 4. Comparison of mercury intrusion test results for samples X-1 and X-2. |
1.2. Method
1.2.1. Conditions
The experimental temperature and stress referred to the typical deep shale gas blocks in the Sichuan Basin (Table 3). Three variables were considered in the experimental design: hydration temperature, hydration time, and horizontal stress difference. Based on the geological parameters of the deep shale in the Jiaoshiba block and the performance parameters of laboratory equipment, 16 groups of mechanical experiments were orthogonally designed (Table 4).
Table 3. Reservoir geological parameters of typical deep shale gas blocks in the Sichuan Basin |
| Block | Depth/m | Temperature/°C | Minimum horizontal principal stress/MPa | Horizontal stress difference/MPa |
|---|---|---|---|---|
| Weiyuan | 3 500-3 700 | 110-140 | 71 | 16-19 |
| Yongchuan | 3 800-4 100 | 100-135 | 88-101 | 11.1-16.0 |
| Jiaoshiba | 3 800-4 100 | 100-130 | 80-87 | 7.4-14.0 |
| Yuxibei | 3 700-4 400 | 110-120 | 84-98 | 14.5-21.5 |
Table 4. True triaxial mechanical experimental design for hydrated deep shale samples |
| Shale sample | Hydration time/d | Horizontal stress difference/MPa | Minimum horizontal principal stress/MPa | Maximum horizontal principal stress/MPa | Temperature/ °C |
|---|---|---|---|---|---|
| MD-1 | 1 | 15 | 80 | 95 | 100 |
| MD-2 | 2 | ||||
| MD-3 | 5 | ||||
| MD-4 | 12 | ||||
| MD-5 | 20 | ||||
| MD-6 | 30 | 15 | 80 | ||
| MD-7 | 10 | 85 | |||
| MD-8 | 5 | 90 | |||
| MG-1 | 1 | 15 | 80 | 95 | 130 |
| MG-2 | 2 | ||||
| MG-3 | 5 | ||||
| MG-4 | 12 | ||||
| MG-5 | 20 | ||||
| MG-6 | 30 | 15 | 80 | ||
| MG-7 | 10 | 85 | |||
| MG-8 | 5 | 90 |
1.2.2. Device
A RTX-3000 testing system (produced by GCTS Company of the United States) was used for true triaxial mechanical experiment. The system is equipped with an advanced closed-loop digital servo control device and consists of four parts: a SCON central control system, a loading system, a control system and a power system (Fig. 5). The SCON central control system is responsible for collecting and providing feedback of all sensor data and adjusting the other three systems according to designed parameters. Axial stress, horizontal stress, confining pressure, permeability and temperature are controlled independently, so that various mechanical properties and permeabilities can be measured at high temperature, single and mixed mechanical boundaries. The RTX-3000 system has high control precision and can perform true triaxial compression tests under multi-field coupling conditions including temperature field, seepage field and stress field. The key technical parameters are shown in Table 5.
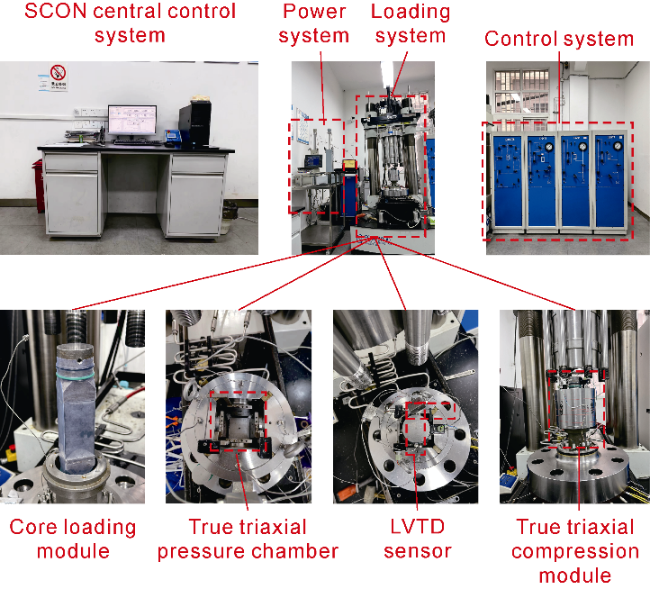
Fig. 5. Rock mechanics true triaxial test system. |
Table 5. Key technical parameters of true triaxial comprehensive test system |
| Technical parameters | Values | Technical parameters | Values |
|---|---|---|---|
| Maximum axial load | 3 000 kN | Maximum pore pressure | 200 MPa |
| Maximum confining pressure | 200 MPa | Dynamic loading frequency | 0-10 Hz |
| Maximum temperature | 200 °C | Displacement control accuracy | ±0.25% |
| Temperature control accuracy | 0.1 °C | Pore pressure control accuracy | 0.01 MPa |
1.2.3. Procedures
The specific steps of the true triaxial compression experiment are as follows: (1) To simulate the reservoir conditions near fractures during the high-pressure shut-in period, the shale samples were saturated at high pressure before experiment. First, the shale sample after drying was placed in a vacuum pressurized saturation device, and evacuated by a vacuum pump under negative pressure for 24 h. Then added distilled water until the sample was fully submerged. A hand pump is used to inject water into the saturation chamber until the water pressure reached 20 MPa. The sample was saturated for 30 h until its wet weight no longer changed (the wet weight was confirmed to be stable after 27 h in previous experiments). The saturated sample was fully soaked in a constant temperature water bath, and then taken out after soaking for the designed hydration time. (2) The saturated sample was loaded into the pressure chamber following the operating procedures [37], and applied 2 MPa initial stress in three directions to fix it. (3) The temperature controller was turned on to raise the sample temperature to the preset value. (4) Using the computer servo control system and force control mode, the two horizontal stresses were loaded at a rate of 2 MPa/min until reaching the preset values. Then displacement control was used to continuously load the axial stress at a rate of 0.02 mm/min until the sample failure occurred. The stress loading paths are shown in Fig. 6. The computer system automatically collected stress and strain data in all three principal stress directions throughout the experiment.
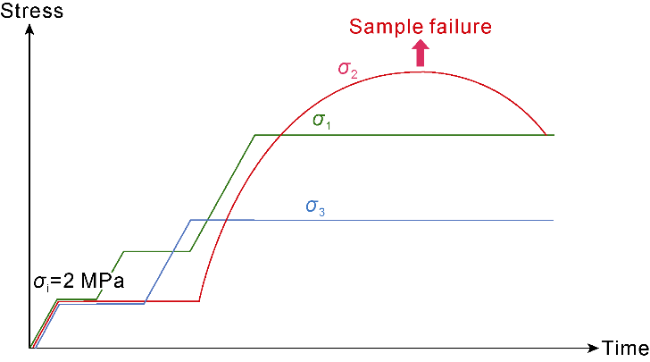
Fig. 6. Stress loading paths in the true triaxial experiment. |
2. Experimental results and discussion
Fig. 7 and Fig. 8 show the compressive stress-strain curves of the shale samples under different hydration time and temperature conditions (100 °C and 130 °C). The stress-strain curves of different experimental schemes exhibit similar general trends. As axial stress increases, axial strain increases too, but the strains in the directions of the maximum and the minimum horizontal principal stresses decrease. The LVDT displacement sensor used in the experiment was set to “positive for compression and negative for tension”, meaning that value increases for shale compression and decreases for expansion [38]. The axial deformation is more obvious than the horizontal. The strain along the minimum horizontal principal stress is larger than that along the maximum horizontal principal stress. This is attributed to the larger constraint along the maximum principal stress, which makes shale expansion more difficult.
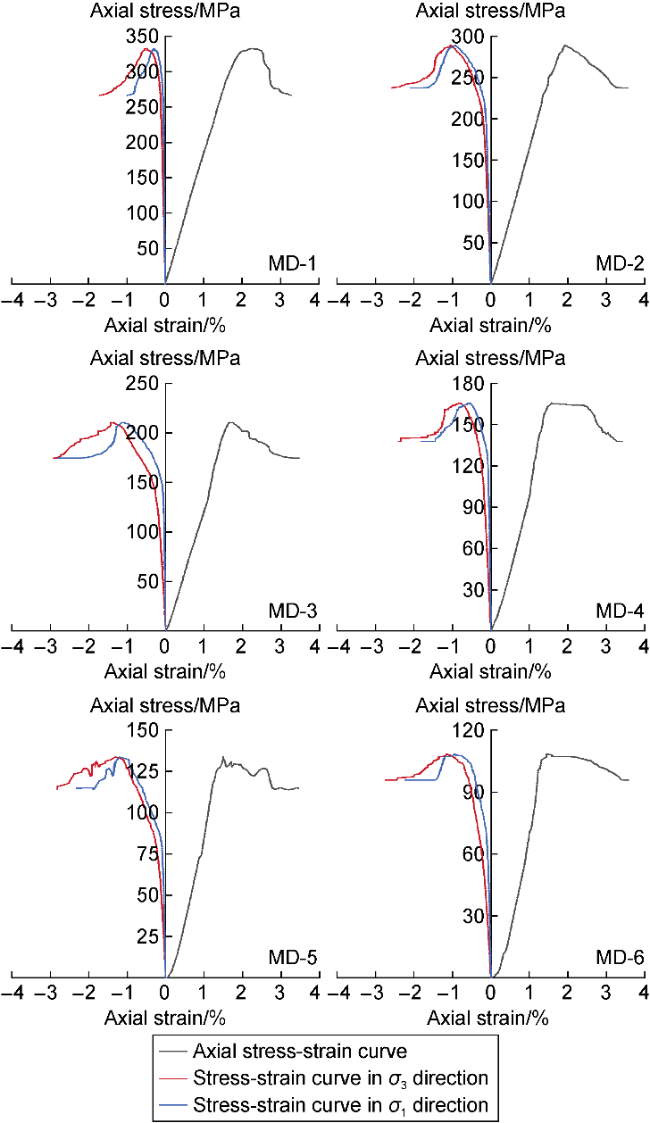
Fig. 7. Stress-strain curves of shale samples MD-1 to MD-6. |
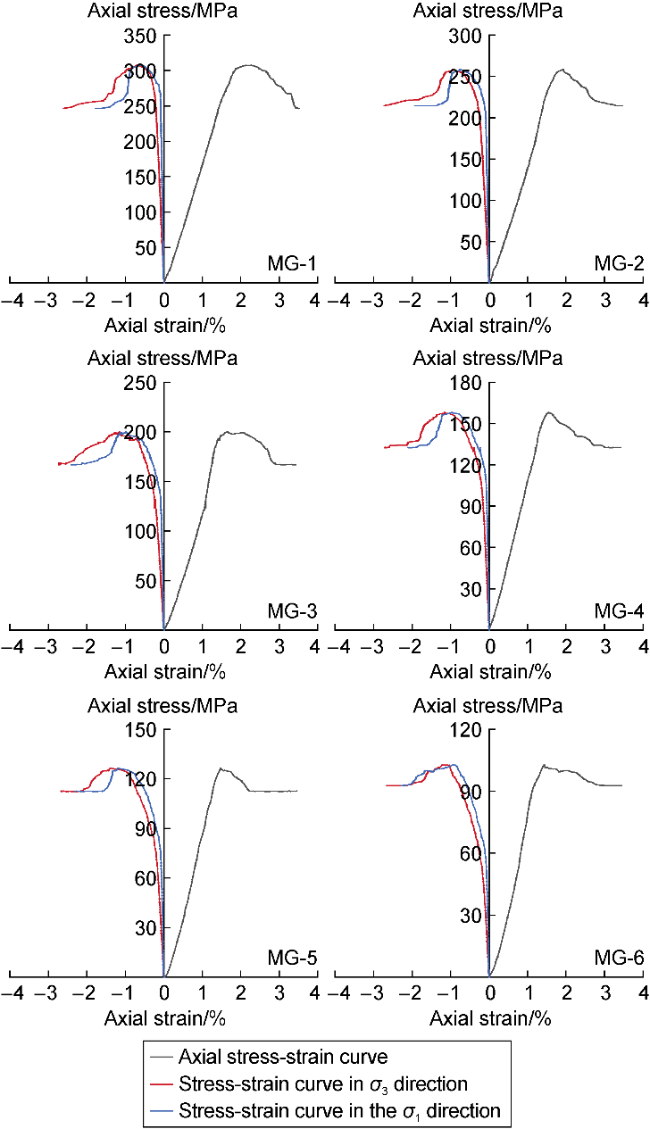
Fig. 8. Stress-strain curves of shale samples MG-1 to MG-6. |
The compressive stress-strain curve can be divided into four stages: (1) Initial compaction stage. The slope increase rate of the axial stress-strain curve first increases and then decreases, showing an “S-shaped” trend. This indicates that the pores and fractures in the shale sample gradually close, leading to an increase in the load-bearing capacity of the shale sample. (2) Elastic stage. With continuous increase of the axial stress but not sufficient to generate new microfractures, elastic deformation occurs, and the axial strain increases linearly with the axial stress. (3) Plastic stage. As the axial stress continues to increase and exceeds the yield strength of the shale sample, the stress-strain curve gradually deviates from the linear trend observed in the elastic stage, and the slope begins to decrease. The shale begins to yield, at which point the elastic deformation transitions to plastic deformation. A large number of new microfractures develop inside the shale, but without obvious macroscopic fracture surfaces. (4) Failure stage. When the axial stress reaches the peak strength of the shale, a clear inflection point appears and the stress-strain curve begins to drop. The axial stress decreases while the axial strain continues to increase. At this point, microfractures inside the shale propagate and connect into macroscopic fracture surfaces, causing a significant reduction in shale strength. However, due to the presence of horizontal stress, the shale retains a considerable residual strength.
2.1. Influence of temperature
2.1.1. Characteristics of stress-strain curve
As shown in Fig. 9, higher hydration temperature leads to earlier shale yield stage, and the yield stage would account for a larger proportion of the pre-peak stage, with more pronounced plastic deformation. After 1 d hydration, the stress-strain curve of sample MD-1 (100 °C) shows an inflection point at 85.7% of the peak stress, and the yield stage accounts for 29.6% of the pre-peak phase. In contrast, for sample MG-1 (130 °C), the inflection point appears at 82.5% of the peak stress, and the yield stage occupies 32.5% of the pre-peak stage. This indicates that high temperature intensifies the damage evolution in shale and resulting in an earlier transition into the yield state. At high temperature of 130 °C, plastic deformation becomes evident in samples hydrated for just 1-2 d, but at 100 °C, at least 5 d of hydration is required to produce comparable plastic deformation.
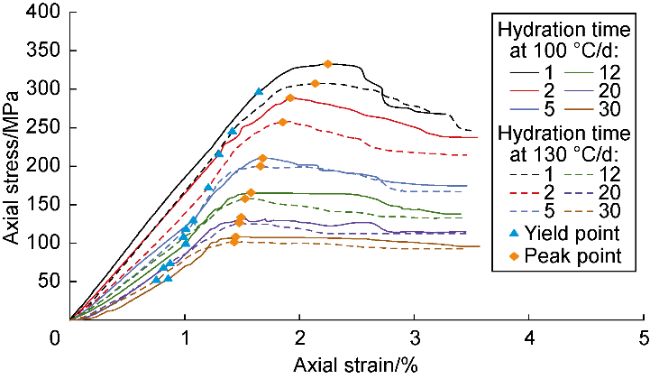
Fig. 9. Axial stress-strain curves of deep shale samples after hydration at different temperatures (horizontal stress difference of 15 MPa). |
It is analyzed that the higher the temperature, the faster the hydration reaction proceeds [39]. A large amount of cementing materials are dissolved, and the cohesion between mineral grains decreases significantly, thereby activating the natural weak planes within the shale and generating new microfractures. Consequently, the number and scale of new microfractures increase with temperature, causing the shale to yield earlier and exhibit more pronounced plastic deformation.
2.1.2. Changes of shale mechanical strength
Hydration transforms the dense lamellar structures among shale minerals into loose and broken flocculent structures. Additionally, hydration smooths the edges of the mineral particles and weakens the cementation among the particles, resulting in a reduction in shale strength. As shown in Fig. 10a, the higher the hydration temperature, the lower the peak strength of the shale. When the hydration time is 1 d, the peak strength at 100 °C is 332.681 MPa, while at 130 °C it is 307.472 MPa, representing a decrease of 7.58%. When the hydration time is 30 d, the peak strength at 100 °C is 108.445 MPa, and at 130 °C it is 102.719 MPa, decreasing by 5.28%.
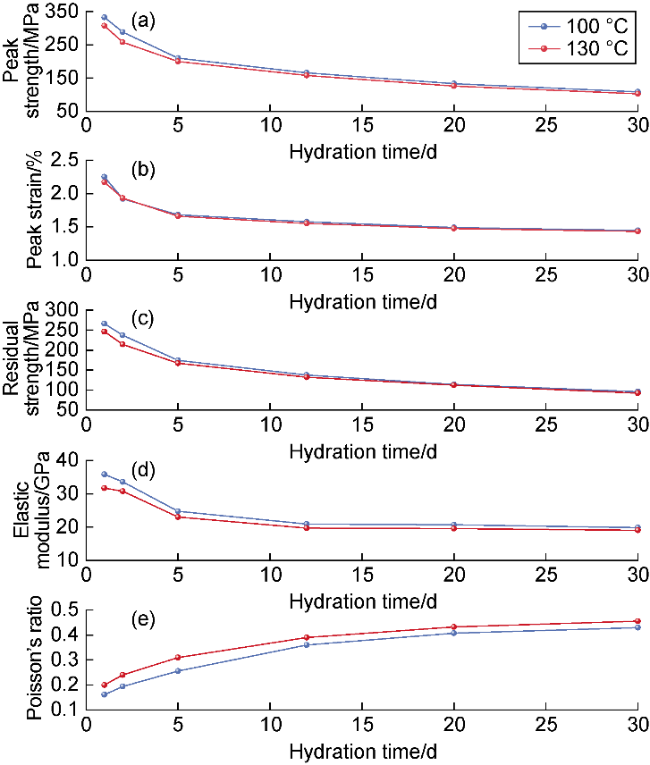
Fig. 10. Variation of mechanical parameters of deep shale with hydration time (horizontal stress difference of 15 MPa). |
As shown in Fig. 10b, the higher the hydration temperature, the lower the peak strain of the shale. When the hydration time is 1 d, the peak strain at 100 °C is 2.219%, while at 130 °C it is 2.171%, showing a decrease of 2.16%. When the hydration time is 30 d, the peak strain at 100 °C is 1.444%, and at 130 °C it is 1.433%, with a decrease of 0.76%.
The residual strength of the shale decreases as hydration temperature increases (Fig. 10c). However, due to the presence of horizontal stress, the residual strength still maintains high after failure. When the hydration time is 1 d, the residual strength at 100 °C is 266.445 MPa, and at 130 °C it is 246.331 MPa, with a decrease of 7.55%. When the hydration time is 30 d, the residual strength at 100 °C is 95.812 MPa, while at 130 °C it is 92.023 MPa, with a decrease of 3.95%.
After a large volume of fracturing fluid is injected, hydration causes clay minerals to swell, disintegrate, disperse and migrate, which collectively contribute to the reduction in elastic modulus of the shale [35,40]. As shown in Fig. 10d, the elastic modulus of the shale decreases with increasing hydration temperature. When the hydration time is 1 d, the elastic modulus at 100 °C is 35.8 GPa, and decreases to 31.6 GPa at 130 °C, representing a reduction of 11.7%. When the hydration time is 30 d, the elastic modulus at 100 °C is 19.8 GPa, and decreases to 19.0 GPa at 130 °C, representing a reduction of 4.0%.
After hydration, dissolution enlarges internal pores and fractures and induces new microfractures, leading to an increase in the Poisson’s ratio of shale. As shown in Fig. 10e, the higher the hydration temperature, the higher the Poisson’s ratio of the shale. When the hydration time is 1 d, the Poisson’s ratio of the shale sample is 0.159 at 100 °C and 0.199 at 130 °C, representing an increase of 25.2%. When the hydration time is 30 d, the Poisson’s ratio increases from 0.429 at 100 °C to 0.455 at 130 °C, with an increase of 6.1%.
The experimental results show that with increasing hydration time, the magnitude of change in mechanical parameters of the shale samples hydrated at 130 °C generally decreases, compared to those hydrated at 100 °C, particularly elastic modulus and Poisson’s ratio. In other words, the longer the hydration time, the less significant the effect of temperature on the mechanical parameters is (Fig. 11).
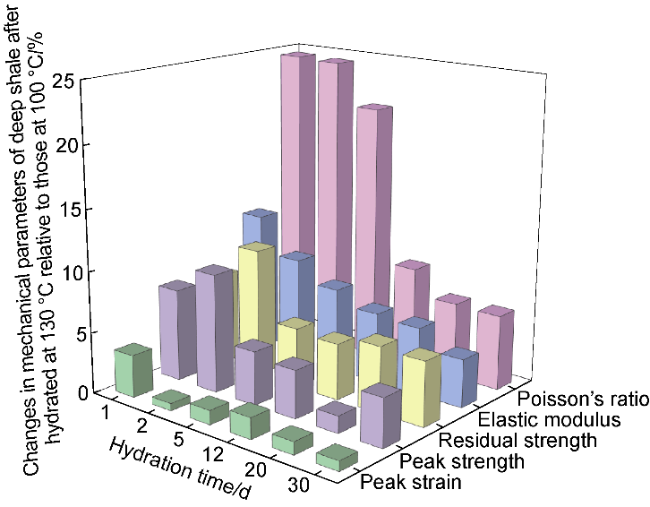
Fig. 11. Changes in mechanical parameters of deep shale samples after hydrated at 130 °C relative to those at 100 °C. |
2.2. Influence of hydration time
2.2.1. Characteristics of stress-strain curve
As shown in Fig. 9, the longer the hydration time, the earlier the shale enters the yield stage and the larger the proportion of the yield stage in the pre-peak stage, indicating more pronounced characteristics of plastic failure. For instance, sample MD-1 (hydrated for 1 d) begins to show an inflection point at 85.7% of the peak stress, with the yield stage accounting for only 29.6% of the pre-peak stage. In contrast, sample MD-6 (hydrated for 30 d) exhibits an inflection point at 50.8% of the peak stress, and the yield stage accounts for 44.3% of the pre-peak stage. This can be attributed to the fact that the longer the hydration time, the greater the dissolution of cements and the more significant the reduction in cohesion among mineral particles, resulting in an increasing number and scale of new microfractures and more apparent plastic deformation of the shale.
2.2.2. Change of shale mechanical strength
At different temperatures, with increasing hydration time, the peak strength, peak strain, residual strength and elastic modulus of the shale exhibit a decreasing trend, while the Poisson’s ratio shows an increasing trend. As shown in Fig. 10, the mechanical strength of the samples is significantly weakened within the first 5 d of hydration. As hydration time goes, the mechanical strength tends to be stable, indicating that the hydration effect mainly occurs in the early stage. At 100 °C, the peak strength of sample MD-1 after 1 d of hydration is 332.681 MPa, and that of sample MD-3 after 5 d of hydration is 210.279 MPa, with an average decrease rate of 30.6 MPa/d; the peak strength of sample MD-6 after 30 d of hydration is 108.445 MPa, and compared to MD-3, the average decrease rate is only 4.1 MPa/d. At 130 °C, the peak strength of sample MG-1 after 1 d of hydration is 307.472 MPa, and that of sample MG-3 after 5 d of hydration is 199.974 MPa, with an average decrease rate of 26.9 MPa/d; the peak strength of sample MG-6 after 30 d of hydration is 102.719 MPa, and compared to MG-3, the average decrease rate is only 3.9 MPa/d.
Other mechanical parameters exhibit similar variation trends. At 100 °C, compared to sample MD-1, sample MD-3 after 5 d of hydration shows an average decrease rate of 0.001 4 d−1 in peak strain, 23 MPa/d in residual strength and 2.8 GPa/d in elastic modulus, and an average increase rate of 0.024 d−1 in Poisson’s ratio. Compared to sample MD-3, sample MD-6 after 30 d of hydration shows an average decrease rate of only 0.000 09 d−1 in peak strain, 3.1 MPa/d in residual strength and 0.2 GPa/d in elastic modulus, and an average increase rate of 0.007 d−1 in Poisson’s ratio. These results indicate that the mechanical behaviors of different shale samples tend to be stable after 5 d of hydration. The weaker the mechanical strength is after hydration, the easier to induce micro-fractures, therefore enhancing the stimulated reservoir volume and the shale gas recovery. Considering fracturing cost, the shut-in duration is recommended to be 5 d after which shale strength begins to be stable.
2.3. Influence of horizontal stress difference
2.3.1. Characteristics of stress-strain curve
As shown in Fig. 12 and Fig. 13, a larger horizontal stress difference causes shale to yield earlier and more pronounced plastic failure. For example, sample MD-8 (at a stress difference of 5 MPa) exhibits an inflection point at 66.9% of the peak stress, and the yield stage accounts for 39.0% of the pre-peak stage; sample MD-6 (at a stress difference of 15 MPa) shows an inflection point at 50.8% of the peak stress, and the yield stage accounts for 44.3% of the pre-peak stage. Sample MG-8 (at a stress difference of 5 MPa) shows an inflection point at 53.2% of the peak stress, and the yield stage accounts for 46.8% of the pre- peak stage; sample MG-6 (at a stress difference of 15 MPa) shows an inflection point at 40.7% of the peak stress, and the yield stage accounts for 55.9% of the pre-peak stage. These results indicate that when the horizontal stress difference is large, hydration causes more severe damage in shale, thereby causing it to enter the yield stage earlier.
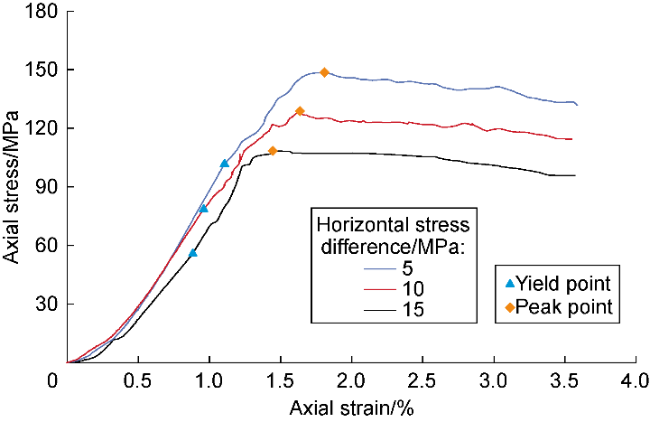
Fig. 12. Axial stress-strain curves of deep shale samples at different stress differences under 100 °C (after hydrated for 30 d). |
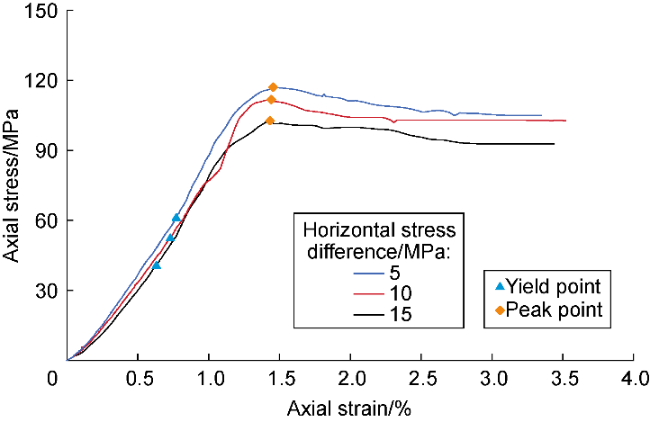
Fig. 13. Axial stress-strain curves of deep shale samples at different stress differences under 130 °C (after hydrated for 30 d). |
It is considered that as the horizontal stress difference increases, the minimum horizontal principal stress decreases accordingly, making the confinement on shale reduce in the corresponding direction. As a result, more microfractures may be induced by hydration and propagate in a large scale, plastic deformation becomes more apparent and shale yields earlier. After reaching the peak stress, continuing axial loading causes these microfractures to coalesce and penetrate the sample to form macroscopic fractures and resulting in a gradual drop in the stress-strain curve beyond the peak stress.
2.3.2. Characteristics of changes in shale mechanical strength
As shown in Fig. 14a, the larger the horizontal stress difference, the lower the peak strength of the shale. At hydration temperature of 100 °C, the peak strength of the sample is 148.574 MPa under a stress difference of 5 MPa, 128.795 MPa under 10 MPa, showing a decrease of 13.31%; under 15 MPa, the peak strength is 108.445 MPa, corresponding to a decrease of 15.80% compared to 10 MPa. At hydration temperature of 130 °C, the peak strength is 117.082 MPa under 5 MPa, 111.739 MPa under 10 MPa, showing a decrease of 4.56%; under 15 MPa, the peak strength is 102.719 MPa, corresponding to a decrease of 8.07% compared to 10 MPa. It can be seen that as the horizontal stress difference increases, the amplitude of the decrease in peak strength also increases.

Fig. 14. Mechanical parameters of deep shale after hydration under different horizontal stress differences. |
The larger the horizontal stress difference, the smaller the peak strain of the shale, and the higher the temperature, the smaller the impact of stress difference on peak strain (Fig. 14b). At hydration temperature of 100 °C, the peak strain of the sample is 1.807% under a stress difference of 5 MPa, 1.635% under 10 MPa, with a reduction of 9.52%; under 15 MPa, the peak strain is 1.445%, corresponding to a reduction of 11.62% compared to 10 MPa. At hydration temperature of 130 °C, the peak strain is 1.454% under 5 MPa, 1.442% under 10 MPa, with a reduction of 0.83%; under 15 MPa, the peak strain is 1.433%, corresponding to a reduction of 0.62% compared to 10 MPa.
As shown in Fig. 14c, the larger the horizontal stress difference, the smaller the residual strength of the shale. At hydration temperature of 100 °C, the residual strength of the sample is 131.944 MPa under a stress difference of 5 MPa, 114.387 MPa under 10 MPa, with a reduction of 13.31%; under 15 MPa, the residual strength is 95.812 MPa, corresponding to a reduction of 16.24% compared to 10 MPa. At hydration temperature of 130 °C, the residual strength is 105.737 MPa under 5 MPa, 102.617 MPa under 10 MPa, with a reduction of 2.95%; under 15 MPa, the residual strength is 92.023 MPa, corresponding to a reduction of 10.32% compared to 10 MPa.
As shown in Fig. 14d, the larger the horizontal stress difference, the smaller the elastic modulus of the shale. Moreover, as the horizontal stress difference increases, the reduction amplitude of the elastic modulus after hydration decreases. At hydration temperature of 100 °C, the elastic modulus is 20.6 GPa under a stress difference of 5 MPa, 19.9 GPa under 10 MPa, with a reduction of 3.4%; under 15 MPa, the elastic modulus is 19.8 GPa, corresponding to a reduction of 0.5% compared to 10 MPa. At hydration temperature of 130 °C, the elastic modulus is 20.0 GPa under 5 MPa, 19.2 GPa under 10 MPa, with a reduction of 4.0%; under 15 MPa, the elastic modulus is 19.0 GPa, corresponding to a reduction of 1.0% compared to 10 MPa.
As shown in Fig. 14e, under the same hydration temperature and time, the larger the horizontal stress difference, the higher the Poisson’s ratio of the shale. Moreover, as the horizontal stress difference increases, the increment amplitude of the Poisson’s ratio after hydration decreases. At hydration temperature of 100 °C, the Poisson’s ratio of the sample is 0.395 under a stress difference of 5 MPa, 0.415 under 10 MPa, showing an increase of 5.1%; under 15 MPa, the Poisson’s ratio is 0.429, corresponding to an increase of 3.3% compared to 10 MPa. At hydration temperature of 130 °C, the Poisson’s ratio is 0.402 under 5 MPa, 0.436 under 10 MPa, showing an increase of 8.5%; under 15 MPa, the Poisson’s ratio is 0.455, corresponding to an increase of 4.3% compared to 10 MPa.
3. Prediction method for mechanical strength of deep shale after hydration
Based on the experimental data of the mechanical properties of deep shale after hydration obtained in this study, a predictive model for shale mechanical strength after hydration was developed using a nonlinear regression method. This model enables real-time calculation of the mechanical strength of hydrated deep shale, shortens the response time for adjusting shut-in and production plans, reduces unplanned downtime losses, and improves the efficiency of deep shale gas development. Three factors influencing the mechanical strength of shale samples during experiment include temperature, hydration time and horizontal stress difference. For 16 groups of mechanical experiments under different conditions, a ternary quadratic equation was used to perform nonlinear fitting of the mathematical relationships between different mechanical strength parameters and temperature, hydration time, and horizontal stress difference (Eq. (1)), and the fitted parameters are shown in Table 6.
$\sigma=a T+b t+c p+d T^{2}+e t^{2}+f p^{3}+g T t+h T p+i t p+j$
Table 6. Nonlinear fitting parameters between mechanical strength and temperature, hydration time, and horizontal stress difference |
| Parameters | a | b | c | d | e | f | g | h | i | j |
|---|---|---|---|---|---|---|---|---|---|---|
| σm | 120.25 | 10.408 | 43.366 | −0.532 64 | 0.323 09 | 0.089 438 | 0.023 262 | 0.100 16 | −1.958 | −7 198.4 |
| εm | 0.128 67 | 0.013 04 | −9.1×10⁻⁵ | −6.4×10⁻⁴ | 0.001 404 | 5.11×10⁻⁴ | 2.17×10⁻⁵ | 1.153×10⁻³ | −5.26×10⁻³ | −6.180 2 |
| σr | 24.794 | −3.202 5 | 10.878 | −0.116 22 | 0.252 16 | 0.020 327 | 0.020 749 | 0.090 35 | −0.788 03 | −1 360.3 |
| E | −6.62×10⁻² | −0.019 98 | −0.010 31 | 2.83×10⁻⁴ | 3.46×10⁻⁴ | 2.84×10⁻⁴ | 2.94×10⁻⁵ | 1.02×10⁻⁵ | 1.13×10⁻⁴ | 4.22 |
| υ | −0.213 | −0.013 57 | −0.071 07 | 9.31×10⁻⁴ | −4.18×10⁻⁴ | −0.000 31 | −2.46×10⁻⁵ | 4.82×10⁻⁵ | 2.52×10⁻³ | 13.232 |
Using the experimental method established in this study, mechanical experiments on hydrated deep shale samples were designed. For experiment MY-1, the temperature was 120 °C, the horizontal stress difference was 15 MPa, and the hydration duration was 4 d. For experiment MY-2, the temperature was 110 °C, the horizontal stress difference was 12 MPa, and the hydration duration was 6 d. The mechanical strength prediction model for hydrated deep shale proposed in this study was validated by the experimental results. Fig. 15 presents the stress-strain curves of MY-1 and MY-2 experiments. The mechanical strength parameters after hydration were obtained from these experimental curves, and the predicted values were calculated using Eq. (1) under the corresponding experiment conditions. As shown in Table 7, the correlation coefficients between the measured and the predicted results of MY-1 and MY-2 are both as high as 0.999, indicating that the mechanical strength prediction model for hydrated deep shale developed in this study exhibits high accuracy.
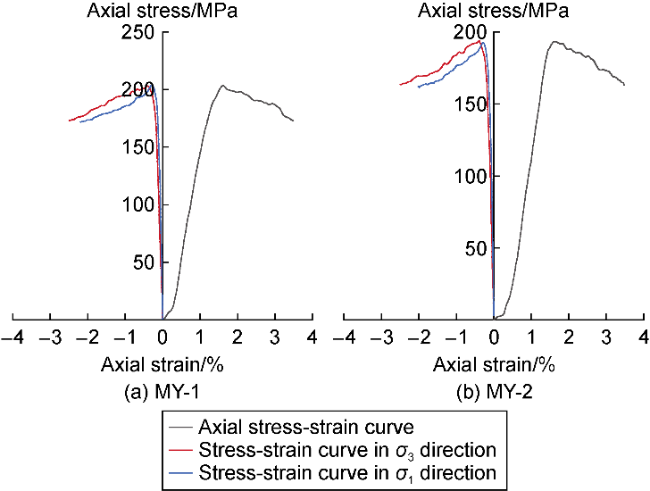
Fig. 15. Stress-strain curves of MY-1 and MY-2 experiments. |
Table 7. Measured and predicted mechanical strengths of hydrated deep shale samples |
| Mechanical parameters | MY-1 | MY-2 | ||
|---|---|---|---|---|
| Measured | Predicted | Measured | Predicted | |
| σm/MPa | 206.337 | 215.765 | 195.274 | 198.289 |
| εm/% | 1.635 | 1.638 | 1.603 | 1.584 |
| σr/MPa | 173.852 | 173.046 | 163.444 | 160.248 |
| E/GPa | 22.0 | 21.2 | 19.0 | 19.5 |
| υ | 0.254 | 0.245 | 0.246 | 0.268 |
| Correlation coefficient | 0.999 | 0.999 | ||
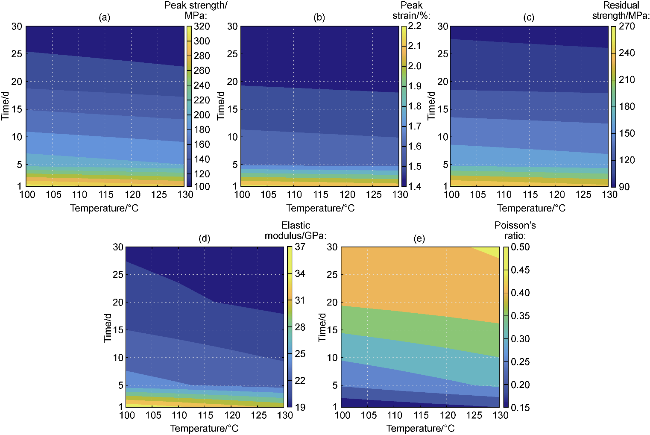
Based on the experimental data of this study, mechanical strength chart of deep shale under high stress difference (15 MPa) were plotted through interpolation method (Fig. 16). These charts can be used to real-time monitor the post-fracturing behaviors of deep shale gas reservoirs, and timely adjust production plans. According to the charts, the lower the temperature and the shorter the hydration time, the higher the mechanical strength; conversely, the higher the temperature and the longer the hydration time, the lower the mechanical strength.
Fig. 16. Mechanical strength charts of deep shale under high stress difference. |
4. Conclusions
With increasing hydration temperature, time and horizontal stress difference, the peak strength, peak strain, residual strength and elastic modulus of deep shale tend to decrease, while the Poisson’s ratio increases. The longer the hydration time, the smaller the influence of the temperature on the mechanical strength of deep shale is. Meanwhile, with increasing horizontal stress difference, the weakening of peak strength and residual strength becomes more pronounced, whereas the deterioration trends of peak strain, elastic modulus and Poisson’s ratio tend to slow down. The mechanical strength of deep shale decreases significantly within the first 5 d of hydration and then gradually becomes stable with increasing time. It is recommended that the shut-in duration to be 5 d. The mechanical strength prediction model for hydrated deep shale exhibits high accuracy, enabling real-time calculation of the mechanical strength of hydrated deep shale and shortening the response time for adjusting shut- in and production plans. Additionally, the visualized chart for mechanical strength facilitates real-time understanding of the post-fracturing reservoir dynamics in field, and enables timely adjust the shut-in and production plans.
Due to significant differences in clay mineral types, contents and cementing characteristics in different shale formations, and given that clay is a key factor influencing shale mechanical behavior, future work should aim to improve high-temperature, high-pressure, high-stress true triaxial rock mechanics systems. Advanced technology such as high-resolution SEM and CT scanning should be employed to investigate the clay mineral distribution which affects the macro- and micro-mechanical behaviors of deep shale. These efforts will provide scientific and practical guidance for designing post-fracturing shut-in time for developing new shale reservoir.
Nomenclature
a, b, c, d, e, f, g, h, i, j—fitting coefficients;
E—elastic modulus, GPa;
p—horizontal stress difference, MPa;
t—time, d;
T—temperature, °C;
εm—peak strain, %;
σ—mechanical strength parameters;
σi—initial stress, MPa;
σm—peak strength, MPa;
σr—residual strength, MPa;
σ1—maximum horizontal principal stress, MPa;
σ2—vertical stress, MPa;
σ3—minimum horizontal principal stress, MPa;
υ—Poisson’s ratio, dimensionless.