

Introduction
Effective exploitation of unconventional oil and gas resources relies on advances in reservoir stimulation technology [1-2]. Unconventional reservoirs are generally tightly cemented with high fracture pressure, so the effect of hydraulic fracturing may be affected [3-4]. Deflagration fracturing has concentrated breakthrough stress and is able to form multiple deflagration fractures, but its range of reservoir stimulation is limited [5-6]. Deflagration-hydraulic composite fracturing serves as a methodology in reservoir stimulation, which integrates deflagration fracturing with hydraulic fracturing. It uses deflagration fracturing first to make multiple fractures near the well, and then applies hydraulic fracturing to make fractures propagate further to obtain multiple long fractures with deep penetration. This achieves a combined effect of multiple fractures near the well and several main fractures far from the well [7-9].
Dating back to the end of the 20th century, deflagration-hydraulic composite fracturing technology was originally put forward, and field practice has proven its effectiveness in boosting production [8-9]. Xu [10] conducted a simple analysis of the mechanism of composite fracturing. Wu et al. [11] and Wei et al. [12] analyzed deflagration fractures effects on hydraulic fracture initiation pressure and stress distribution. Qiu et al. [13] investigated hydraulic fracture initiation laws with small pre-existing fractures. Current studies only cover stress changes and fracture initiation laws during hydraulic fracturing with pre-existing fractures. An integrated theoretical research system and simulation method for the entire fracture propagation process in deflagration-hydraulic composite fracturing are still absent, and the mechanism and controlling factors of fracture propagation are still unclear.
Rock fracture in deflagration fracturing is caused by two sequential processes: stress wave impact fracturing, followed by gas driven fracture propagation from deflagration. Wu et al. [14] developed a coupled dynamic model of deflagration fracture theoretically, but it didn’t account for the deflagration stress wave. Wang et al. [15] adopted the continuous-discontinuous element method (CDEM) for analyzing deflagration fracture propagation under methane deflagration stress impact. Wang et al. [16] examined stress impact and gas expansion effects on the propagation of deflagration fractures, but high-pressure gas flow during the gas stage was not considered. Previous researches primarily focused on the individual rock-breaking effects of stress impact fracturing or gas driven fracture propagation, with few the simulation of deflagration fracture propagation considering both stages.
CDEM is an explicit dynamic numerical analysis method in which the finite element and discrete element are coupled with each other [17-18]. Based on this method, the numerical simulation framework for fracture propagation during deflagration-hydraulic composite fracturing was established, which takes into account the combined effects of deflagration stress impact fracture creation, deflagrating gas driven fracture propagation, and hydraulic fracture propagation. In addition, the model was used to investigate the influences of in-situ stress difference, deflagration peak pressure, deflagration pressurization rate, hydraulic fracturing displacement and hydraulic fracturing fluid viscosity on fracture propagation in deflagration-hydraulic composite fracturing. This study seeks to offer a methodological and theoretical foundation for predicting the effectiveness of deflagration-hydraulic composite fracturing, as well as references for the design of field operation schemes.
1. Mathematical model
1.1. Simulation process
The numerical simulation of deflagration-hydraulic composite fracturing consists of three stages: deflagration stress impact, deflagration gas drive, and hydraulic fracturing. In this simulation, the same initial mesh and boundary conditions are used throughout. First, the deflagration stress impact phase is simulated, and the fracture morphology formed are recorded and used as initial fractures for the next phase, ensuring smooth transition between phases. The initial pressure for the gas drive phase is obtained from the equilibrium pressure during the stress impact phase. After simulation of both phases, deflagration fractures are formed. The hydraulic fracturing phase is linked to the prior stage in the same way, with the deflagration fractures as initial fractures, thus completing the entire numerical simulation process.
1.2. Basic principles of the CDEM
The CDEM divides the rock matrix into two basic elements: blocks and interfaces (Fig. 1). Block elements consist of one or more finite elements. The interface element is composed of actual interfaces between block elements and imaginary interfaces between finite elements inside the blocks (Fig. 1a), which correspond to pre-existing fractures within the rock matrix and potential fracture propagation paths, respectively. Adjacent block units are connected via a normal spring and a tangential spring (Fig. 1c). Rock matrix fracturing is characterized as rupture of normal and tangential springs at interface elements.
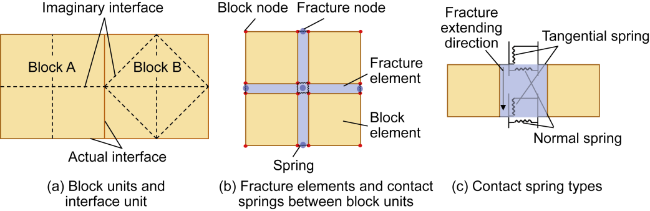
Fig. 1. Basic principle of CDEM. |
1.3. Solid constitutive model
The linear elastic-fracture constitutive model serves to characterize the mechanical properties of rock matrix, and incremental method is used to characterize the linear elastic constitutive [18]:
The block elements within the rock matrix all follow the stress equilibrium equation, whose element matrix is expressed as [19]:
Nodal strain is obtained through geometric relationships:
Nodal stress is obtained through the stress-strain relationship:
Element node accelerations are computed from their respective unbalanced forces at the previous timestep. Subsequently, the explicit Euler difference method is utilized to iteratively determine the displacement field for following timestep. The iteration format is:
1.4. Interface model and fracture propagation criterion
Adjacent finite elements are interconnected through contact points, whose relative displacement and spring force relationship adhere to Hooke’s law [20].
$\begin{matrix} {{F}_{\text{n}}}=\frac{EA}{L}\Delta {{u}_{\text{n}}}={{K}_{\text{n}}}\Delta {{u}_{\text{n}}} \\ {{F}_{\text{t}}}=\frac{GA}{L}\Delta {{u}_{\text{t}}}={{K}_{\text{t}}}\Delta {{u}_{\text{t}}} \\ \end{matrix}$
When either the normal or tangential spring between two elements breaks, a fracture occurs. Below are the criteria for determining interface fracture:
Maximum tensile stress criterion:
Mohr-Coulomb criterion:
When Eq. (7) is satisfied, tensile spring failure occurs with Fn=0. If Eq. (8) is satisfied, shear spring failure occurs with . The fracture width is equivalent to the displacement difference between the two nodes at the ends of the spring after the spring fails.
1.5. Seepage calculation model
The fracture elements between block elements, assumed as parallel plates with certain widths, are used to depict fluid flow, and the flow obeys the cubic law. The basic control formulas and solution methods for the seepage fields of gases and liquids are the same. When gas seepage occurs, it is assumed to be an ideal gas and the viscosity change of the gas is not considered. When liquid seepage occurs, it is assumed to be a slightly compressible fluid.
The fundamental differential equation for fracture seepage is as follows [21]:
The unbalanced flow at fracture element nodes is determined by the flow through fracture nodes and the source/sink terms imposed on fracture nodes [22].
${{p}^{(n+1)}}={{p}^{(n)}}+\frac{\Delta t}{{{C}_{\text{f}}}{{V}^{n}}}\left[ {{q}^{(n)}}+q_{\text{in}}^{(n)} \right]$
1.6. Deflagration source model
The stress wave impact phase: as deflagration lasts only milliseconds, heat exchange is neglected, and the process is regarded as adiabatic expansion. Pressure variation is calculated using the Landau and Stanyukovich formula [23]:
Gas driven phase: A significant quantity of high-pressure gas remains confined within the deflagration source space after the stress wave impact. The pressure of the high-pressure gas is applied as the pressure boundary condition at fracture element nodes around wellbore, enabling computation of flow of gas into the formation. Assuming that gas temperature of deflagration source space remains constant, state equation for an ideal gas indicates that:
The gas pressure in deflagration source space after Δt:
1.7. Model coupling relationship
The simulation process of deflagration fracturing involves solid constitutive model, interface model, seepage model and deflagration source model. The simulation process of hydraulic fracturing involves the coupling of solid constitutive model, interface model and seepage model.
The model coupling relationship of the gas expansion stage in deflagration fracturing is shown in Fig. 2. The solid constitutive model computes stress and strain at nodes, while the resulting nodal displacements serve as the basis for the interface model to determine contact forces. The interface model computes tensile and shear stresses on springs. Based on these stresses, it determines whether interface elements undergo tensile failure or shear failure. The resulting spring forces from interface elements are applied to the solid model, while the distance between the two sides of the contact surface governs the fracture width in the seepage model. The seepage model calculates fluid flow processes within the reservoir. Fluid pressure in fractures acts as an external load that affects computation in both the solid model and the interface model. Deflagration source pressure determined through the deflagration source model is applied to both the solid model and the seepage model. During the stress impact phase, only the mutual coupling among solid constitutive model, interface model and deflagration model is considered. For the hydraulic fracturing stage, except for the deflagration source model, the remaining coupling relationships are consistent with Fig. 2.
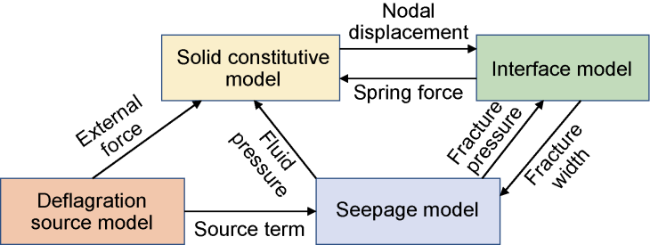
Fig. 2. Model coupling relationship in the gas driven stage of deflagration fracturing. |
2. Model solution and verification
2.1. Model solution
In CDEM, the dynamic relaxation technology is used for explicit iterative solving. In this method, a damping term is introduced into dynamic calculations to damp the vibration system from initial imbalance to equilibrium position. Its basic calculation process is shown in Fig. 3.
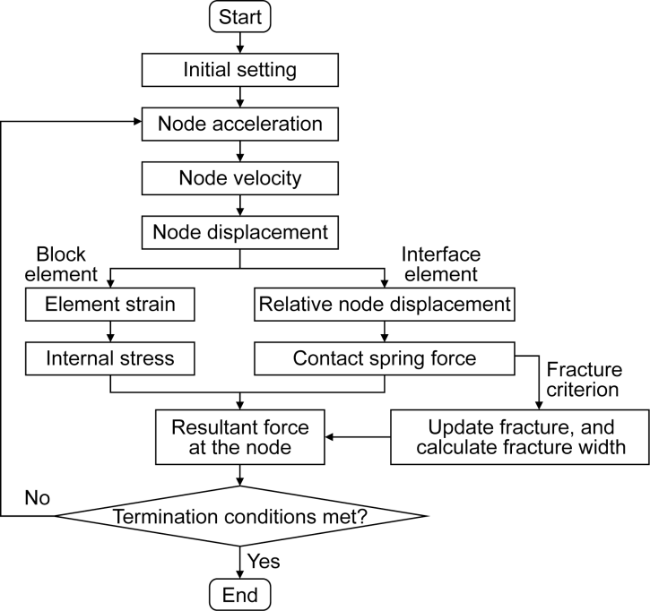
Fig. 3. Basic calculation process of CDEM. |
2.2. Model verification
2.2.1. Verification with physical simulation experiments
To validate the reliability of the simulated deflagration stress impact phase, the simulation results were compared with experiment of cement rock specimen explosive fracturing [24]. The experimental sample used was a cylindrical rock with a diameter of 800 mm, featuring a central cylindrical borehole of 15 mm radius, with explosives positioned within it. The parameters for the numerical simulations aligned with the experimental setup. The comparison of the numerical simulation with experimental results (Fig. 4) indicates that the deflagration impact creates a complex network of multiple fractures around the hole. The fracture morphology characteristics from the simulation align well with those from the physical simulation experiment.
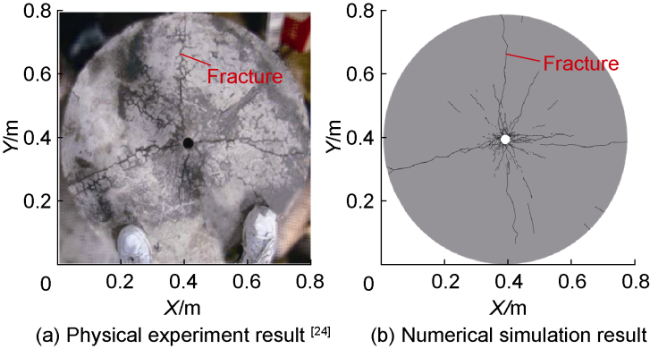
Fig. 4. Comparison of the fracture morphology of the fractured rock samples in the experiment and numerical simulation. |
2.2.2. Verification with gas seepage model
To validate the gas seepage calculations of the model, the simulation results were compared with the theoretical solutions of gas flow in classical situation. For steady- state one-dimensional flow, theoretical expression of pressure distribution is presented as Eq. (18). For unsteady state gas flow, the theoretical solution for the infinite formation with a central well at constant injection rate is approximated by Eq. (19). The one-dimensional model is 100 m long with pressures at the two ends set at 50 MPa and 20 MPa, and an initial pressure of 20 MPa. Gas viscosity is 1×10⁻⁵ Pa·s, and formation permeability is 1×10⁻³ μm2. Fig. 5a compares the simulated pressure distribution for steady flow with the theoretical solution. Fig. 5b compares the simulation results for unsteady flow with the analytical solution. The numerical solution and the analytical solution basically coincide at the same time.
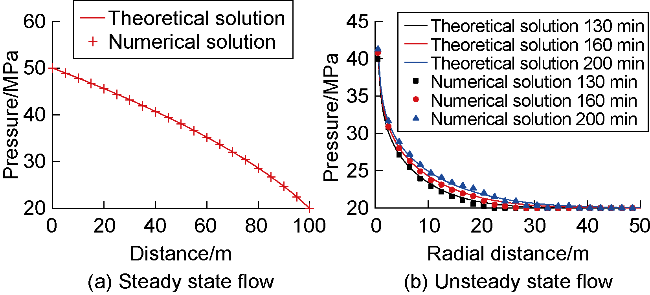
Fig. 5. Comparison between the numerical solution of pressure by the gas seepage model and the theoretical solution. |
2.2.3. Verification with the KGD theoretical solution
The accuracy of the fracture propagation in this study was verified using the classic theoretical solution of KGD model [25]. The two-dimensional reservoir model is 100 m×100 m, having an elastic modulus of 40 GPa and a Poisson ratio of 0.2. A central injection point operates at a rate of 0.02 m3/s, with the fluid viscosity being 1 mPa·s and the injection duration set to 100 s. As shown in Fig. 6, simulated temporal evolution of fracture length and fracture width variation with radial distance are basically accordant with the variation trends of theoretical solutions. Respective average errors are 4.3% for length and 3.1% for width. These errors are acceptable for engineering calculations.
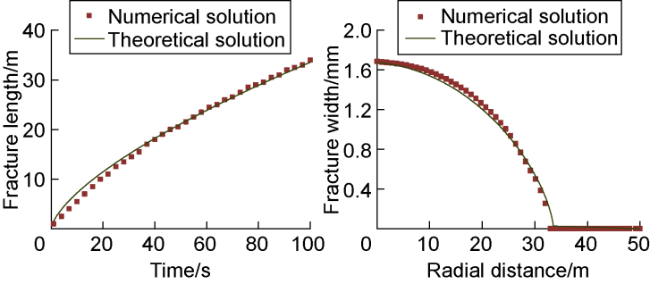
Fig. 6. Comparison between the numerical solution by the KGD model and the theoretical solution. |
Through comparison with physical simulation experiment result, gas flow model simulation result and KGD theoretical solution, it is fully demonstrated that the model established in this study is reliable.
3. Numerical simulation of deflagration-hydraulic composite fracturing
3.1. Geological model for vertical well fracturing
According to the above mathematical model, a small-size two-dimensional vertical well fracturing model with dimensions of 20 m×20 m is established to conduct numerical simulations of the in-situ stress distribution after deflagration fracturing and analyze hydraulic fracture initiation and propagation mechanisms. A large-scale two-dimensional vertical well fracturing model of 100 m×40 m is also established for simulating deflagration-hydraulic composite fracturing and analyzing the propagation law and influencing factors of composite fractures. Both models feature a central 0.16 m diameter circular hole serving as the wellbore and explosion source. Triangular meshes are used, with finer meshes near the wellbore that gradually coarsen outward. The model parameters are based on actual shale gas reservoir data from 2 000-3 000 m depths, while the deflagration source parameters refer to methane gas data (Table 1).
Table 1. Parameter of deflagration-hydraulic composite fracturing model |
| Category | Parameter | Value |
|---|---|---|
| Rock Matrix | Density | 2 600 kg/m3 |
| Tensile strength | 5 MPa | |
| Elastic modulus | 40 GPa | |
| Poisson’s ratio | 0.2 | |
| Angle of internal friction | 30° | |
| Cohesion | 10 MPa | |
| Original formation pressure | 30 MPa | |
| Permeability | 0.1×10⁻³ μm2 | |
| In-situ stress | Maximum horizontal principal stress | 48 MPa |
| Minimum horizontal principal stress | 40 MPa | |
| Deflagration source parameters | Explosive speed | 400 m/s |
| Explosive heat | 5×10⁷ J/kg | |
| Density of deflagration source | 50 kg/m3 | |
| Pumping parameters | Density | 1 000 kg/m3 |
| Viscosity | 1 mPa·s | |
| Displacement | 3 m3/min |
3.2. In-situ stress distribution after deflagration fracturing
Fig. 7 depicts the minimum horizontal principal stress and horizontal stress difference distribution of the formation resulted from the complete entry of fracturing fluid into deflagration fractures during the early hydraulic fracturing phase after deflagration fracturing as simulated with the small-size model. Fig. 7a shows that near the fracture tip where the fracture propagation direction is close to σH, the minimum horizontal principal stress decreases the most. Hence, deflagration fractures here initiate and propagate first during hydraulic fracturing. Fig. 7b shows that near fractures whose propagation direction is close to σh, there is mainly a low stress difference region. Near fractures whose propagation direction is close to σH, there’s predominantly a high stress difference region. Results indicate that during early hydraulic fracturing, deflagration fractures whose propagation direction is close to the σH direction will expand along the σH direction, while the deflagration fractures that are oriented at a defined angle to σH will initially propagate in their original orientation before progressively deflecting toward σH. This shows that performing hydraulic fracturing after deflagration fracturing can simultaneously initiate and extend deflagration fractures in multiple directions, achieving more effective reservoir stimulation.
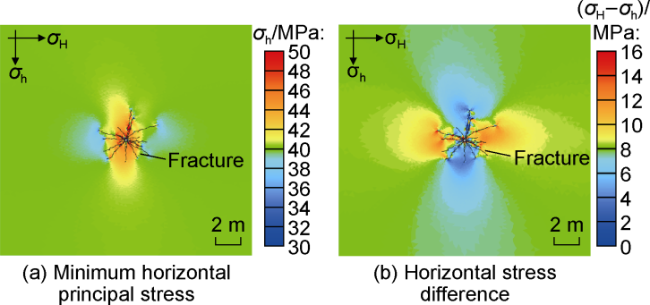
Fig. 7. In-situ stress field distribution after complete entry of the fracturing fluid into deflagration fractures. |
3.3. Fracture distribution law of deflagration-hydraulic composite fracturing
The large-scale model is adopted to simulate deflagration-hydraulic composite fracturing and analyze fracture distribution law. Fig. 8 presents the deflagration fracturing pressure curve, and Fig. 9 illustrates the deflagration fracture morphology. Under the impact of deflagration stress wave, deflagration pressure surges to maximum within an extremely short time during deflagration fracturing. This intense peak pressure, combined with the high pressurization rate, leads to the failure of the rock mass around wellbore, generating multiple radial fractures that propagate in all directions. However, these fractures have limited extension length and a small stimulation range. In the subsequent gas driven phase, as gas enters the formation, pressure drops, and the fractures propagate further under the action of high-pressure gas, eventually forming deflagration fractures with a certain range of reservoir stimulation.

Fig. 8. Pressure during deflagration fracturing stage. |
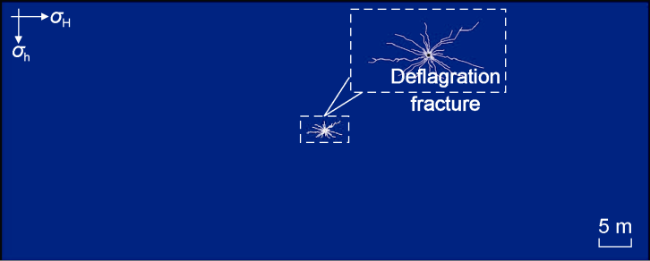
Fig. 9. Morphology of deflagration fracture. |
Fig. 10 depicts temporal evolution of fracture morphology during deflagration-hydraulic composite fracturing, and Fig. 11 presents the pressure curve during the hydraulic fracturing stage. At 90 s of hydraulic fracturing time, hydraulic fractures begin to propagate along deflagration fractures, so the pressure curve shows no breaking point. As the fracturing time extends (e.g., to 280 s and 360 s), intra-fracture frictional resistance drives gradual pressure-curve ascent. Under the control of in-situ stress, fractures oriented orthogonally to σh exhibit heightened propagation potential. The advancing hydraulic fractures experience continuous deflection and nearby fractures may coalesce, ultimately forming several long fractures propagating along the σH direction.
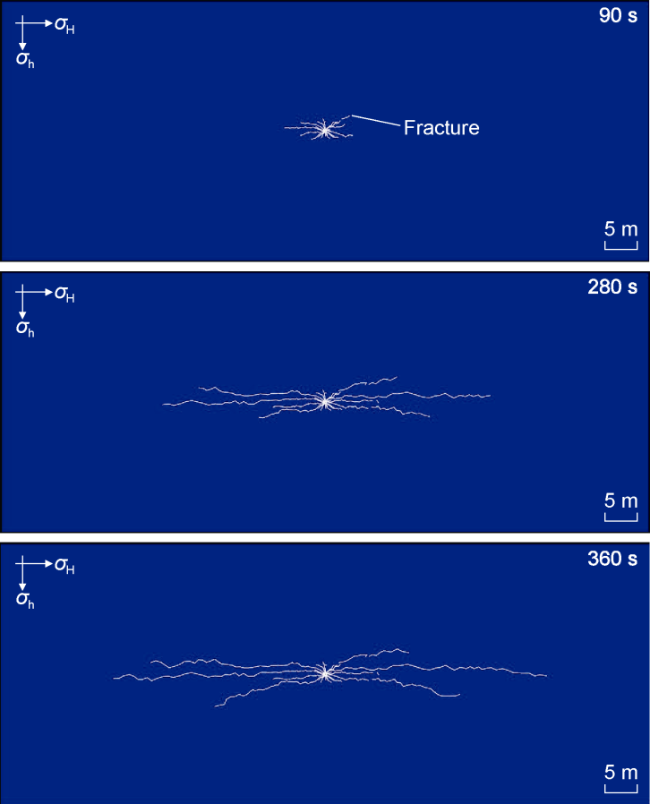
Fig. 10. Fracture morphology at different moments of deflagration-hydraulic composite fracturing. |
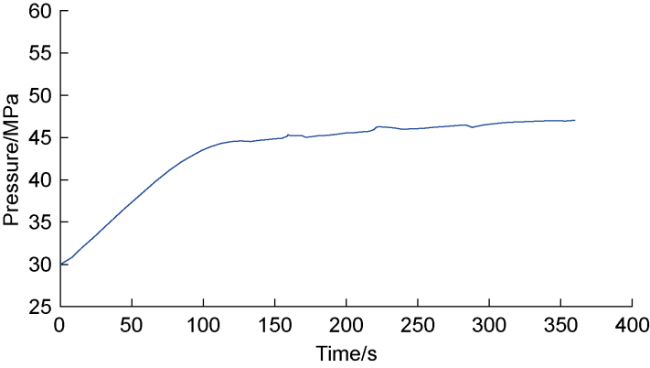
Fig. 11. Pressure during the hydraulic fracturing stage. |
The stimulation scope of deflagration fracturing is relatively small, with fracture morphology illustrated in Fig. 9. Hydraulic fracturing in vertical wells can only generate a single bi-wing fracture propagating along the σH direction. Fig. 10 presents fracture morphology formed by deflagration-hydraulic composite fracturing, which generates multiple long fractures with deep penetration. This process creates highly complex fractures and achieves more thorough reservoir stimulation. This demonstrates that the deflagration-hydraulic composite fracturing for reservoir stimulation has obvious advantages.
4. Analysis of influencing factors
To quantify reservoir fracturing extent following deflagration-hydraulic composite stimulation, the maximum fracture length in the σH and σh directions and the stimulated area are used as evaluation indexes of reservoir stimulation. Meanwhile, fracture morphology from deflagration fracturing is assessed using parameters: the maximum fracture length in the σH and σh directions and the broken degree. The maximum fracture length denotes the longest fracture extension in a certain direction. The stimulated area is defined as the area of an ellipse with the maximum fracture lengths in the σH and σh directions as the major and minor axes, respectively. Broken degree is the ratio of the broken element area to the total area of all elements.
Using primary data in Table 1, we performed single-factor analysis on five parameters: in-situ stress difference, deflagration peak pressure, deflagration pressurization rate, hydraulic fracturing displacement and fracturing fluid viscosity, to explore the influence of different factors on fracture propagation in deflagration-hydraulic composite fracturing. For ease of single-factor analysis, the simulation comparison reference values are set as follows: peak pressure of 200 MPa, pressurization rate of 720 GPa/s, displacement of 3 m3/min, viscosity of 1 mPa·s, and in-situ stress difference of 8 MPa. During single-factor simulations, only one parameter is varied at a time.
4.1. In-situ stress difference
The in-situ stress differences were changed to 2, 8, 14 and 20 MPa to simulate fracture morphology of deflagration-hydraulic composite fracturing at different in-situ stress differences (Fig. 12). It indicates that with increasing in-situ stress difference, σh-directional fracture initiation resistance intensifies, and deflagration-hydraulic composite fractures exhibit stronger preferential propagation along σH direction, with fracture length increasing in σH direction while decreasing significantly in σh direction. As a result, the overall shape of the fracture becomes narrower.
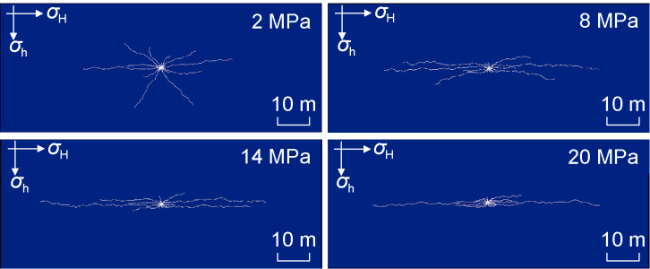
Fig. 12. Morphology of composite fracturing fracture at varying in-situ stress differences. |
As shown in Fig. 13, the stimulated area of deflagration-hydraulic composite fracturing decreases significantly with increasing in-situ stress difference. With in-situ stress difference increasing from 2 MPa to 20 MPa, the maximum fracture length in the σh direction drops from 23.8 m to 3.9 m, while in the σH direction, it increases from 46.5 m to 70.5 m. The stimulated area is reduced from 869 m2 to 215 m2. Deflagration fracturing shows relatively low sensitivity to in-situ stress difference. As stress difference increases, the trend of maximum fracture length variation is basically consistent with that of deflagration-hydraulic composite fracturing, but this change is much less dramatic. The reason is that deflagration fracturing, with its short duration and high instantaneous energy, can suppress the controlling effect of in-situ stress differences within an extremely short time, thus making the impact of in-situ stress difference relatively small. When performing deflagration-hydraulic composite fracturing with a small in-situ stress difference, deflagration fracturing creates many fractures in the σh direction and broken degree is also higher. During hydraulic fracturing, hydraulic fractures then propagate along the ends of these deflagration fractures. Fractures in different directions are less likely to connect, resulting in multiple composite fractures along various paths. However, with a large in-situ stress difference, both fracture length in the σh direction and broken degree decrease in deflagration fractures, the hydraulic fracture length in the σh direction is limited, hydraulic fractures near the wellbore quickly deflect under in-situ stress and merge into a single main fracture along the σH direction. This significantly reduces the stimulated area of the composite fracturing.
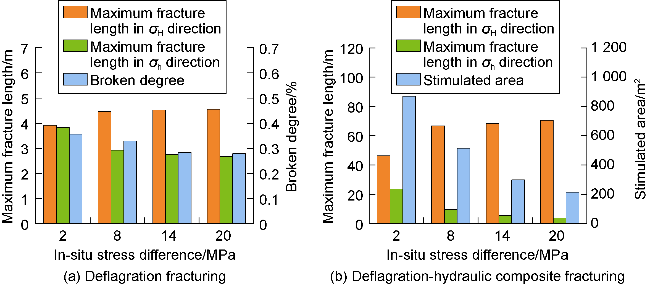
Fig. 13. Influence of in-situ stress difference on the fracturing effect. |
4.2. Deflagration peak pressure
Deflagration peak pressures were set to 90, 200, 310, and 420 MPa to simulate their effects on fracturing effectiveness (Fig. 14, Fig. 15). The figures illustrate that increasing peak pressure enhances both σh-directional fracture length and σH-directional fracture count during deflagration fracturing. This means higher peak pressure create longer radial fractures and more micro-fractures around the wellbore, which is great for forming complex fracture networks during subsequent hydraulic fracturing. At low peak pressure, due to limited near-wellbore fracture number and length from deflagration, the deflagration-hydraulic composite fracturing only forms one main fracture extending along the σH direction, and the effect is poor. When peak pressure is high, deflagration fracturing creates more and longer fractures near the wellbore, and hydraulic fractures propagate along these deflagration fractures. Although they deflect due to the in-situ stress difference, they still provide a large stimulation range in the σh direction, resulting in better reservoir stimulation.
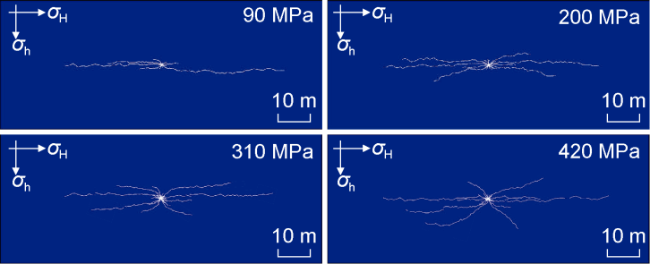
Fig. 14. Composite fracturing fracture morphology at varying peak pressures. |
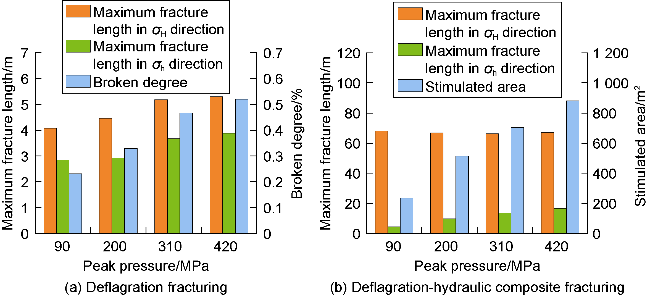
Fig. 15. Influence of peak pressure on the fracturing effect. |
Fig. 15 demonstrates that elevated peak pressure during deflagration fracturing enhances maximum fracture length in both σH and σh directions and broken degree, which is beneficial for subsequent hydraulic fracturing stimulation. During deflagration-hydraulic composite fracturing, elevated peak pressure enhances maximum fracture length in the σh direction. As peak pressure rises from 90 MPa to 420 MPa, the maximum fracture length in the σh direction increases from 4.4 m to 16.7 m, a 279% increase. In contrast, the peak pressure has little effect on the maximum fracture length in the σH direction. As peak pressure rises from 90 MPa to 420 MPa, the simulated area increases by 275% from 235 m2 to 881 m2.
4.3. Deflagration pressurization rate
The pressurization rate of deflagration fracturing were changed to 120, 420, 720, and 1020 GPa/s to simulate the influence of the pressurization rates on the fracturing effect (Fig. 16, Fig. 17). During deflagration fracturing, as the pressurization rates increases, the maximum fracture length in both σH and σh directions shows a slight increase. From the perspective of stimulation effect, the broken degree of deflagration fracturing increases significantly with the increasing pressurization rate. This demonstrates that higher pressurization rate generates more complex fracture network in deflagration fracturing, and hydraulic fractures can more easily propagate in different directions, achieving a larger stimulated area. During deflagration-hydraulic composite fracturing, as the pressurization rate increases, the maximum fracture length in the σH direction increases slightly. However, beyond 420 GPa/s pressurization rates, the maximum fracture length in the σH direction declines, while that in the σh direction still shows a slight upward trend. From the perspective of fracture complexity, the higher the pressurization rate, the larger the fracture stimulated area and the more complex the fracture network. From Fig. 17b, as the pressurization rate increases from 120 GPa/s to 1 020 GPa/s, the maximum fracture length drops by 2.1 m in the σH direction but rises by 2.2 m in the σh direction. The stimulated area increases by 99 m2, a 21% rise. This increase is relatively limited, and its impact is significantly less than that of peak pressure.
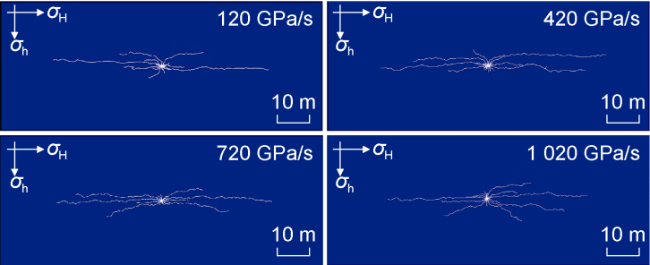
Fig. 16. Composite fracturing fracture morphology at varying pressurization rates. |
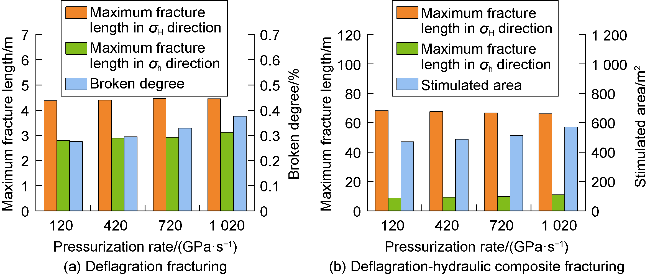
Fig. 17. Influence of pressurization rate on the fracturing effect. |
4.4. Hydraulic fracturing displacement
The hydraulic fracturing displacement was changed to 1, 3, 6, and 9 m3/min to simulate the influence of the displacement on the fracturing effect (Fig. 18, Fig. 19). From the figures, greater displacement lengthens the maximum fracture in the σh direction but shortens that in the σH direction. A higher displacement enlarges the deflection radius, and the high intra-fracture net pressure can further extend deflagration fractures that are less likely to initiate. This leads to more balanced fracture propagation in different directions. When the displacement is 1 m3/min, 4 long fractures are produced. When the rate increases to 9 m3/min, 12 long fractures are formed. This indicates that at high displacement, more deflagration fractures extend under the action of hydraulic fracturing fluid, producing more long fractures. Compared to the displacement of 6 m3/min, at 9 m3/min, fractures propagate more evenly in all directions, and increased fracture length and width in the σh direction, along with decreased length in the σH direction, lead to overall reduced stimulated area. This indicates that there is an optimal displacement when maximizing the stimulated area. Under the given conditions, the optimal displacement is 6 m3/min.
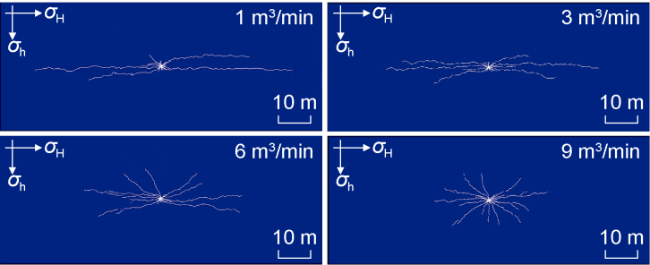
Fig. 18. Composite fracturing fracture morphology at varying displacements. |
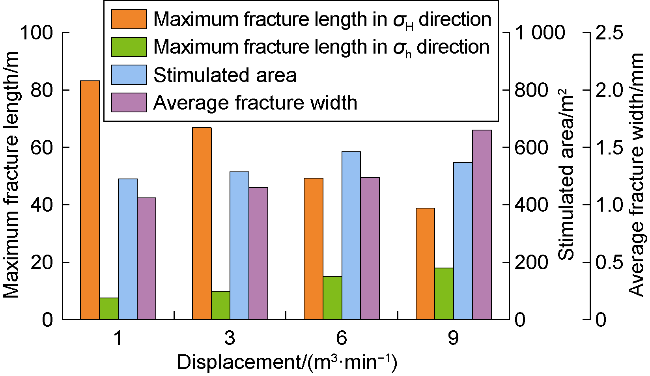
Fig. 19. Influence of displacement on the fracturing effect. |
4.5. Hydraulic fracturing fluid viscosity
The hydraulic fracturing fluid viscosity was changed to 1, 5, 15, and 25 mPa·s to simulate the influence of the fracturing fluid viscosity on the fracturing effect (Fig. 20, Fig. 21). Increasing viscosity enhances maximum fracture length in the σh direction while reducing σH-directional length. As viscosity increases, the intra-fracture net pressure rises, and the deflection radius of the fracture increases, facilitating uniform fracture propagation along initial orientations, thereby expanding stimulated reservoir area. However, the viscosity and the stimulated area are not completely positively correlated. When the viscosity exceeds 15 mPa·s, the stimulated area no longer continues to increase. The analysis shows that at higher intra-fracture net pressure, the fracture width increases significantly. For instance, as viscosity rises from 15 mPa·s to 25 mPa·s, the average fracture width grows from 1.45 mm to 1.95 mm. At the same simulation time, the fracturing fluid volume is constant. Thus, the increase in fracture width affects the fracture propagation distance.
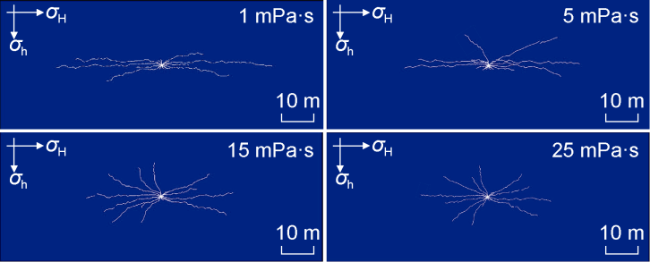
Fig. 20. Composite fracturing fracture morphology at varying viscosity. |

Fig. 21. Influence of viscosity on the fracturing effect. |
5. Conclusions
Deflagration-hydraulic composite fracturing combines the near-well complexity of deflagration fracturing and the far well deep penetration of hydraulic fracturing, which creates multiple long fractures with deep penetration, significantly enhancing stimulation effectiveness compared to either deflagration fracturing or hydraulic fracturing alone.
Elevated in-situ stress difference reduces the stimulated area from deflagration-hydraulic composite fracturing, and reservoirs with lower in-situ stress differences exhibit enhanced stimulation outcomes. Elevated peak pressure and pressurization rate help increase the maximum fracture length and broken degree of deflagration fractures, thus enlarging the stimulated area and boosting stimulation effectiveness of deflagration-hydraulic composite fracturing. Of these two factors, peak pressure has a more significant impact.
Increasing hydraulic fracturing displacement and hydraulic fracturing fluid viscosity will enhance the intra-fracture net pressure, which is conducive to activating deflagration fractures distributed in all directions, increasing the deflection radius of the fractures, generating more long fractures, and effectively increasing the stimulated reservoir area. However, the stimulated reservoir area is not completely positively correlated with the displacement and viscosity, and there is a critical value. When the critical value is exceeded, the stimulated area decreases.
Nomenclature
A—spring area, m2;
c—cohesion, Pa;
C—element damping matrix, kg/s;
Cf—fluid compression coefficient, Pa−1;
D—explosive speed, m/s;
D—Elastic matrix, Pa;
E—Elastic modulus, Pa;
F—node external force array, N;
Fn, Ft—the spring’s normal force and tangential force, N;
G—shear modulus, Pa;
h—formation thickness, m;
i, j—component number;
k—fracture element number;
K—volume modulus, Pa;
K—element stiffness matrix, kg/s2;
Kn, Kt—normal and tangential stiffness, Pa/m;
Ks—permeability, m2;
l—model length, m;
L—interface equivalent thickness, m;
M—molar mass, kg/mol;
M—element mass matrix, kg;
n—iteration steps;
n12—contact-surface unit normal vector, dimensionless;
Ne—number of fracture elements connected with nodes;
p—fluid pressure, Pa;
p0—average deflagration pressure, Pa;
pa—atmospheric pressure, Pa;
pb—the real-time pressure of deflagration gas, Pa;
pc—critical pressure, Pa;
pf0—gas pressure in initial deflagration source space, Pa;
pf1—the gas pressure in deflagration source space after Δt, Pa;
pg—gas pressure, Pa;
pi—original formation pressure, Pa;
pin—inlet pressure, Pa;
pout—outlet pressure, Pa;
q—the flow rate at fracture node, m3/s;
qin—the inflow flow rate of element, m3/s;
Q—source/sink term, s−1;
Qf—flow rate, m3/s;
Qw—the explosive heat of a substance per unit mass, J/kg;
Qw0—wellbore-peripheral fracture element flow summation, m3/s;
r—radial distance, m;
R—gas constant, J/(mol·K);
t—time, s;
Δt—interval time, s;
T—tensile strength, Pa;
Tfa—average formation temperature, K;
Tf—formation temperature, K;
Tg—gas temperature, K;
u—displacerment matrix, m;
u1, u2—the nodal displacement at both ends of the spring, m;
—node velocity array, m/s;
—node acceleration array, m/s2;
Δun—normal displacement, m;
Δut—tangential displacement, m;
V—element volume, m3;
V0—initial volume of gas, m3;
Vb—the volume of explosive gas, m3;
Vc—critical volume, m3;
Vf—the spatial volume of the deflagration source, m3;
w—fracture width, m;
x—the distance from the starting point along the seepage direction to the calculation point, m;
X—the length in the horizontal coordinate direction, m;
Y—the length in the vertical coordinate direction, m;
—gas compression factor, dimensionless;
γ—high-pressure adiabatic index, dimensionless;
γ1—low-pressure adiabatic index, dimensionless;
δij—kronecker delta, dimensionless;
ε—node strain, dimensionless;
Δεij—incremental strain tensor, dimensionless;
η—gas pressure conductivity coefficient, m2/s;
Δθ—volumetric strain increment, dimensionless;
μ—fluid viscosity, Pa·s;
ρg—gas density, kg/m3;
ρw—the charge density within the deflagration source space, kg/m3;
σ—node stress, Pa;
σh—minimum horizontal principal stress, MPa;
σH—maximum horizontal principal stress, MPa;
σij—stress tensor, Pa;
Δσij—increment of stress tensor, Pa;
σij(t0), σij(t1)—stress tensors at times t0 and t1, Pa;
σn—normal stress, Pa;
σt—tangential stress, Pa;
φ—angle of internal friction, (°).