

Introduction
The hot dry rock (HDR) resource potential of China is estimated at 2.5×1025 J, located at depths of 3-10 km. Significantly, HDR resources within the 3-5 km depth range alone represent approximately 80 times the total fossil energy reserves of China, indicating substantial development potential [1-2]. Establishing efficient heat exchange channels via drilling technology is therefore critical for effective HDR resource extraction. However, the high temperature, high strength, and high abrasiveness of HDR formations present major challenges to conventional drilling methods. These include low drilling efficiency, severe bit wear, and prolonged well construction cycles [3-4]. Research indicates that percussive drilling technology can significantly improve the rate of penetration (ROP) in hard geothermal reservoirs, and it has been widely applied in HDR development [5-7]. For instance, during operations at the GH-01 geothermal well in China, the technology achieved an average ROP of 5.13 m/h— over five times that of conventional rotary drilling [8]. Likewise, successful implementation for efficient rock breaking has been reported in countries such as the United States, Germany, Switzerland, and Finland [9].
Percussive drilling primarily employs three impact modes: axial, torsional, and axial-torsional coupled impact [10]. Among these, axial impact rock breaking is the most widely applied method [11]. Current research on axial impact rock-breaking mechanisms focuses mainly on the following aspects [12-17]: Revealing stress wave propagation paths, energy dissipation mechanisms, and dynamic crack propagation laws through numerical simulations and theoretical analysis; Analyzing dynamic rock fragmentation characteristics via rock-breaking experiments; Optimizing dynamic parameters (e.g., impact load amplitude, waveform, frequency) using specific rock-breaking energy as the evaluation metric. Although the rock-breaking mechanism under impact loading has received considerable attention, existing studies are predominantly confined to ambient temperature rocks. Consequently, a systematic understanding of the impact rock-breaking mechanism in high-temperature hard rocks remains lacking. This knowledge gap significantly hinders the wider adoption of this technology and the optimization of drilling parameters.
Regarding energy utilization during impact, the current evaluation system primarily relies on the single metric of rock-breaking specific energy (RSE) [18]. Impact tests indicate that conical tooth outperforms spherical tooth in reducing RSE [19-21]. However, conventional experiments cannot dynamically analyze the real-time transfer characteristics of RSE during the impact process. To address this limitation, researchers have developed coupled hammer-bit-rock dynamic models, and analyzed energy transfer and component-level energy absorption during dynamic impact. It reveals that rectangular waves exhibit optimal energy transfer efficiency [22], while thermo-mechanical coupling can reduce energy utilization efficiency [23]. Although existing research has explored energy transfer in percussive drilling, a significant limitation persists: the impact system is often treated as a single energy unit in calculations. Consequently, the detailed energy composition within individual components remains inadequately resolved. Furthermore, the magnitude and evolution of individual energy components during transfer lack systematic investigation. This gap fundamentally hinders a deeper understanding of the complex internal interactions within the percussive drilling system.
This study focuses on HDR as the research subject. Based on the Finite-Discrete Element Method (FDEM), a three-dimensional numerical model is developed to simulate axial impact rock breaking. Furthermore, a novel energy calculation scheme is proposed specifically for the impact rock-breaking system. The reliability of the numerical model and the energy calculation method is validated through Split Hopkinson Pressure Bar (SHPB) impact experiments. Building on this validated foundation, the research investigates the effects of forward rake angle of the conical tooth, rock temperature, and impact velocity on rock-breaking mechanisms and energy transfer. The primary objectives are to provide a theoretical foundation and engineering optimization strategies for efficient percussive drilling in HDR formations.
1. Mathematical model
1.1. Fundamental theories of rock damage and failure
Axial impact rock fracturing was simulated using the FDEM. This hybrid approach integrates the Finite Element Method (FEM) with the Discrete Element Method (DEM) to simulate the behaviors of materials in the process of failure and deformation [24]. The FEM is used for characterizing elastic behaviors of materials while the DEM models fracture and failure of materials. Within the FDEM model, cohesive elements (discrete units) are embedded between matrix elements. Initially, matrix elements share identical nodes at coplanar interfaces (Fig. 1a). Upon insertion of cohesive elements, matrix elements are assigned distinct node numbers at shared interfaces, while cohesive elements share node numbers with adjacent matrix elements (Fig. 1b). This configuration enables the simulation of rock deformation, fracturing and failure through damage evolution within the cohesive elements. The fracture behavior of these elements is governed by a bilinear traction-separation constitutive law [25], with damage initiation determined by a quadratic stress criterion [26].
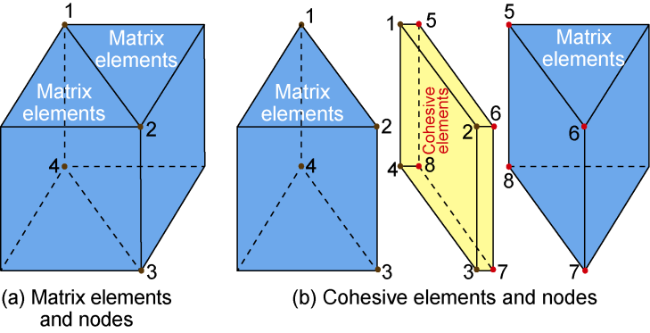
Fig. 1. Schematic diagram of cohesive elements embedding. |
1.2. Principles for energy analysis
Under impact loading, rock-breaking is fundamentally the deformation and fracture caused by impact energy. Building upon prior studies on energy classification during impact [27-28], this work subsequently analyzed the energy composition of system components. Specifically, it investigated interactions among the impact rod, anvil, drill bit, and rock, along with the dynamic evolution of key energies: kinetic, strain, contact, friction, and fracture energy.
In the dynamic analysis of axial impact systems, kinetic energy reflects the energy possessed by moving components of the system, and its variation is closely related to the application of external impact loads. Here, by analyzing the velocity and mass of each node in the model, the overall kinetic energy change can be accurately quantified. The calculation formula is as follows [29]:
${{E}_{\text{k}}}=\frac{1}{2}\underset{i=1}{\overset{n}{\mathop{\mathop{\sum }^{}}}}\,{{m}_{i}}v_{i}^{2}$
When impact loading is applied to the system, it causes elastic deformation in the impact rod, anvil, and rock, thereby converting to elastic strain energy. The magnitude of this energy is closely related to the material's elastic modulus, strain magnitude, and volume. The calculation formula is as follows [30]:
${{E}_{\text{e}}}=\frac{1}{2}\underset{V}{\mathop \int }\,\sigma :\varepsilon \text{d}V$
In percussive drilling, contact energy is fundamentally associated with interaction forces between contact surfaces, friction, along with elastic and plastic deformation of materials. This energy component is primarily defined as elastic energy stored within overlapping regions of separated tetrahedral elements. It is quantified based on work performed by contact forces, using the following expression [27]:
${{E}_{\text{c}}}=\underset{i=1}{\overset{n}{\mathop{\mathop{\sum }^{}}}}\,{{F}_{\text{c}}}{{d}_{i}}$
Fracture energy is defined as the energy required for material fracture, and it is typically used to characterize a material's resistance to crack propagation. During impact rock breaking, fracture energy represents a critical parameter for evaluating rock fragmentation characteristics and drilling efficiency. It significantly influences both the bit-rock interaction and the effective utilization of energy throughout the drilling process. The calculation is given by [27]:
${{E}_{\text{fr}}}=\underset{i=1}{\overset{n}{\mathop{\mathop{\sum }^{}}}}\,{{F}_{\text{fr}}}{{d}_{i}}$
Frictional energy is a key factor determining interactions at the bit-rock interface and within the rock. This energy is crucial for assessing drilling efficiency, controlling drilling parameters, and optimizing bit design. It is defined as the energy dissipated by frictional forces acting on contact surfaces, typically calculated using the friction force and relative displacement at the interface. The calculation is given by [31]:
${{E}_{\text{fc}}}=\underset{i=1}{\overset{n}{\mathop{\mathop{\sum }^{}}}}\,{{F}_{\text{f,}i}}{{d}_{i}}$
1.3. Parameter calibration
Establishing an axial impact rock-breaking numerical model requires determining both macroscopic physical-mechanical parameters and micromechanical parameters. Currently, parameter calibration is primarily conducted using a trial-and-error approach [32]. In this study, numerical simulations were performed to match experimental data from uniaxial compression tests and Brazilian splitting tests on granite samples, thereby calibrating the rock mechanical parameters.
This study utilized granite outcrops from the Biyang area in the North China Plain. Core samples comprising 25 mm × 50 mm cylinders and 50 mm × 25 mm discs were drilled. The samples were heated to target temperatures of 25, 100, 200, 300, and 400 °C at a constant rate of 5 °C/min. Following thermal treatment, uniaxial compression tests and Brazilian splitting tests were conducted. Based on the experimental results, numerical models simulating the uniaxial compression and Brazilian splitting tests were developed. Rock mechanical parameters at each temperature were then calibrated using a trial-and-error method to achieve consistency between the numerical simulations and experimental data (Fig. 2). This calibration process yielded the input parameters required for the axial impact rock-breaking numerical model across the investigated temperature range. Parameters corresponding to 300°C are presented in Table 1.
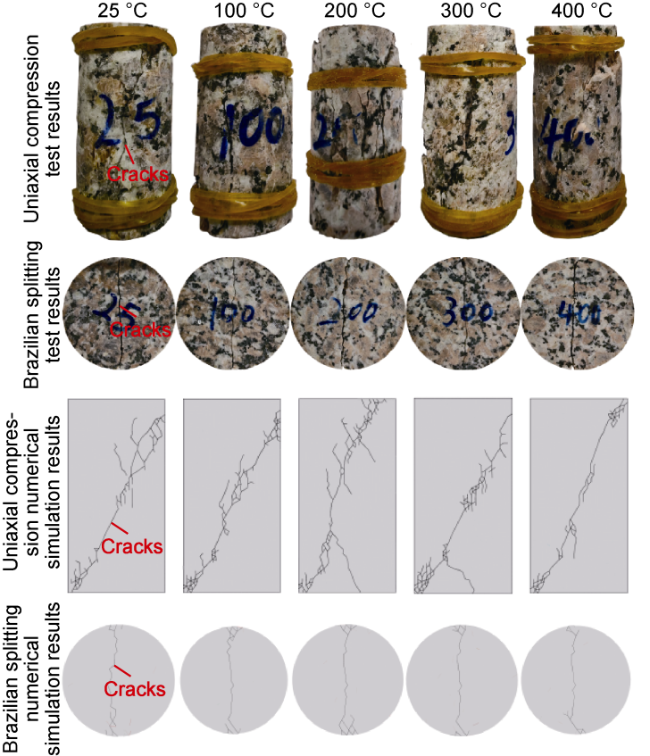
Fig. 2. Comparison of experimental and numerical simulation results. |
Table 1. Input parameters for the numerical model at 300 °C |
| Parameter name | Value | Parameter name | Value |
|---|---|---|---|
| Density | 2.65 g/cm3 | Sliding friction coefficient | 0.6 |
| Elasticity modulus | 33.1 GPa | Type I fracture energy | 80 J/m2 |
| Poisson’s ratio | 0.22 | Type II fracture energy | 340 J/m2 |
| Normal stiffness | 125 N/mm | Peak tangential strength | 35 MPa |
| Tangential stiffness | 62.5 N/mm | Peak normal strength | 5.11 MPa |
| Internal friction coefficient | 1 |
2. Model verification
2.1. Verification of rock failure behavior and stress wave propagation
To verify the reliability of the impact rock breaking numerical model based on FDEM theory in simulating dynamic damage/fracture processes and stress wave propagation, matching impact rock breaking experiments were designed and conducted. The consistency between the numerically predicted final failure patterns and experimental outcomes under identical impact conditions was compared to validate the capability of the model in capturing rock damage evolution and macroscopic failure. Additionally, stress wave curves at monitored locations were compared between experiments and simulations to verify the accuracy of the model in simulating elastic wave propagation, reflection, and interaction within the structure.
Impact tests were conducted using a modified Split Hopkinson Pressure Bar (SHPB) device, as illustrated in Fig. 3. Different initial velocities are set up by adjusting the air compressor pressure and striker length. Subsequently, the striker impacts the incident bar, transmitting dynamic loads. Stress waves propagate along the incident bar and are applied to a specialized drill bit, penetrating the rock sample and inducing damage. The physical and mechanical properties of the striker, incident bar, and transmission bar are listed in Table 2.
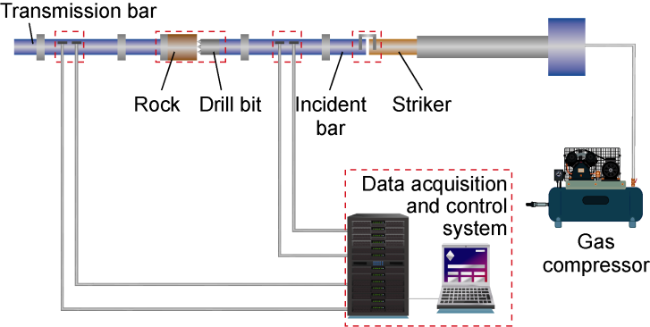
Fig. 3. Schematic diagram of SHPB experimental device. |
Table 2. Physical and mechanical parameters of SHPB device |
| Component | Diameter/mm | Length/ mm | Density/ (kg•m−3) | Elasticity modulus/ GPa | Poisson ratio |
|---|---|---|---|---|---|
| Striker | 50 | 400 | 7 850 | 198.6 | 0.288 |
| Incident bar | 50 | 2 000 | 7 850 | 198.6 | 0.288 |
| Transmission bar | 50 | 2 000 | 7 850 | 198.6 | 0.288 |
Micro-bits with the same diameter as incident bar were designed and fabricated (Fig. 4). Each bit was incorporated with three conical teeth (Ø13.52 mm) in two patterns of forward rake angles, i.e., 0° and 20°. The tooth tips were positioned within a 31-mm diameter circle. Granite specimens (100 mm × 100 mm × 100 mm) from the same batch used in the high-temperature rock mechanics experiments of Fig. 2 were prepared. To simulate the high temperature environment of hot dry rock, specimens were heated from 25 °C to 300 °C at 5 °C/min, followed by a 10 h isothermal hold at target temperature.
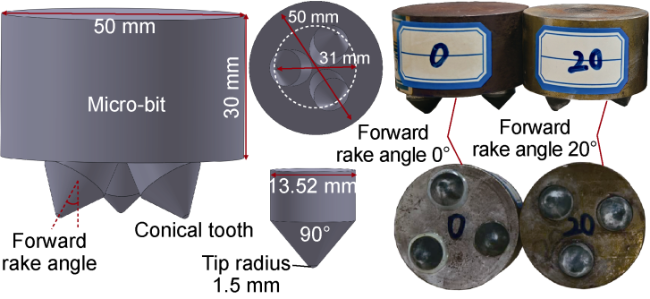
Fig. 4. Schematic structure and physical picture of the experimental micro-bit. |
A geometric model for the SHPB impact rock breaking simulation was established (Fig. 5). The model comprises four primary components: the striker, incident bar, drill bit, and rock, with dimensions matching the experimental apparatus. All nodes at the rock base were constrained in all degrees of freedom. To ensure model reliability while enhancing computational efficiency, the following assumptions were adopted: (1) The rock behaves as an isotropic material; (2) The drill bit is treated as a rigid body without considering wear; (3) Lateral displacements of moving components are neglected during impact.
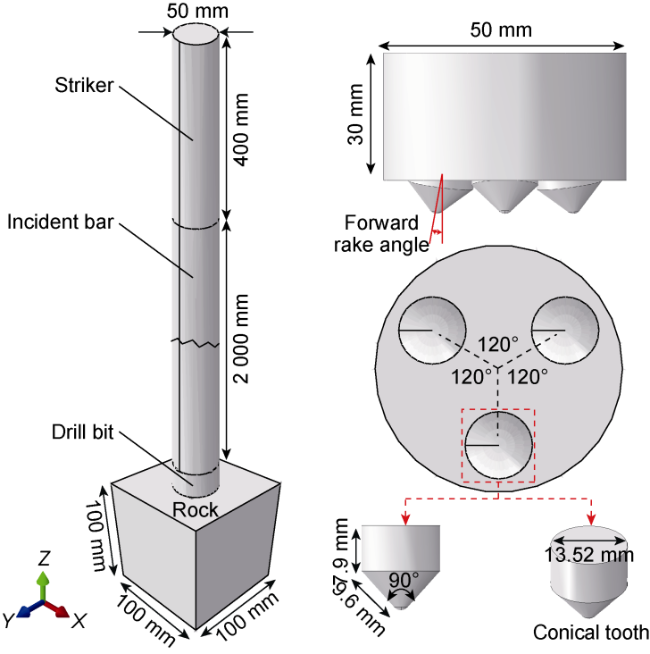
Fig. 5. Geometric model for SHPB impact rock breaking simulation. |
To ensure consistency between simulation and experimental conditions, the initial velocity of the striker was set at 6 m/s. The results demonstrate that compared to the 0° forward rake angle bit, the 20° forward rake angle bit generated crushing pits and radially propagating cracks simultaneously on the rock surface post-impact (Fig. 6). Numerical simulations show close agreement with experimental failure patterns, validating the model’s accuracy in capturing rock failure mechanisms under impact loading.
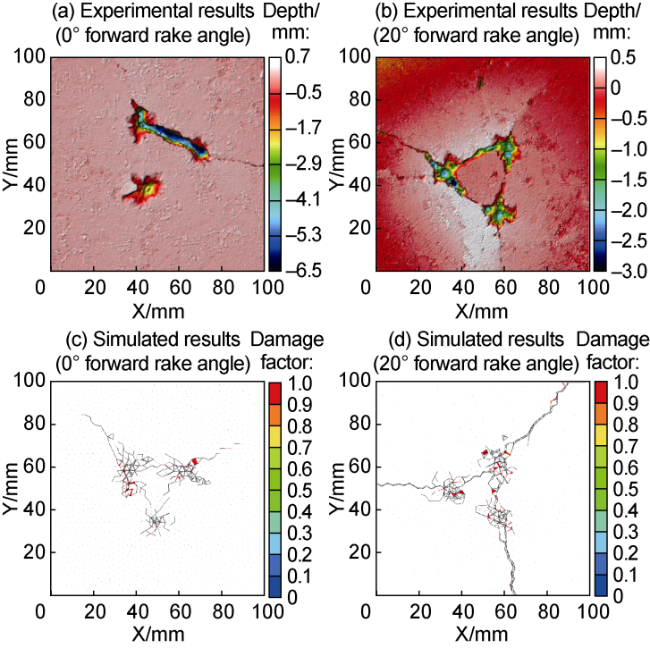
Fig. 6. Comparison of experimental and simulated rock failure patterns. |
Taking the conical bit with 20° forward rake angle as an example, stress wave transfer laws during impact rock- breaking was analyzed. The results demonstrated that both incident and reflected waves exhibited rectangular waveforms (Fig. 7). Experimental and numerical results showed similar evolutionary trends, with nearly identical peak magnitudes for incident and reflected waves, confirming the accuracy of the numerical model established in this study.
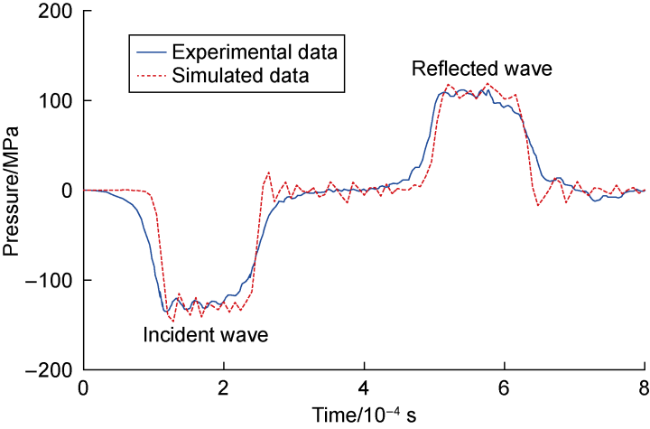
Fig. 7. Comparison of experimental and simulated stress wave transmission law. |
2.2. Verification of energy computation methodology
The impact system’s total energy remains constant under the energy conservation principle. In the impact process, the initial kinetic energy of the striker dynamically converts to five components: impact tool kinetic energy (non-rock components), rock strain energy, rock contact energy, rock fracture energy, and comprehensive friction energy (bit-rock interface and internal friction). We computed these energies at each timestep using formulas above, accumulating them into total calculated energy. Verification of the energy methodology relied on comparing this calculated total against actual input energy.
Taking the impact rock breaking of conical bit with initial velocity of 6 m/s and forward rake angle of 20° as an example, the dynamic evolution of calculated energy components and their summation (total calculated energy) are shown in Fig. 8. The actual total energy, defined as the striker's kinetic energy at initial velocity, remained constant at 111 J. Error represents the difference between calculated and actual total energy. Results indicate a maximum 3.3% error throughout the impact process, validating the energy computation methodology.
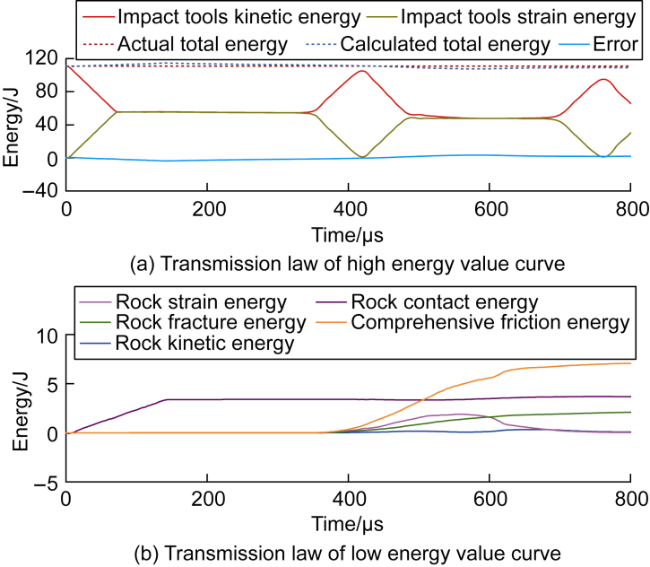
Fig. 8. Energy distribution law of SHPB impact simulation. |
3. Numerical simulation of axial impact rock breaking
3.1. Simulation scheme
Following validation of the numerical simulation approach for impact rock breaking and the associated energy calculation method, an axial impact rock breaking system model was established (Fig. 9). Building upon the SHPB impact model, the impact rod diameter was adjusted to 25 mm with a length of 300 mm, while the anvil diameter was set to 50 mm with a length of 400 mm; all other parameters remained unchanged. The impact rod and anvil were modeled as elastic deformable bodies. Conversely, the drill bit was assumed to be rigid. Structured meshing using hexahedral elements was applied to the impact rod and anvil. In contrast, the drill bit and rock were discretized with unstructured tetrahedral meshes. The rock element size was specified as 1.5 mm, with cohesive elements globally embedded throughout. The rock bottom was set as the fixed boundary conditions. The impact rod impacted the anvil at the initial velocity, then the anvil impacted the bit, and eventually the bit broke the rock.
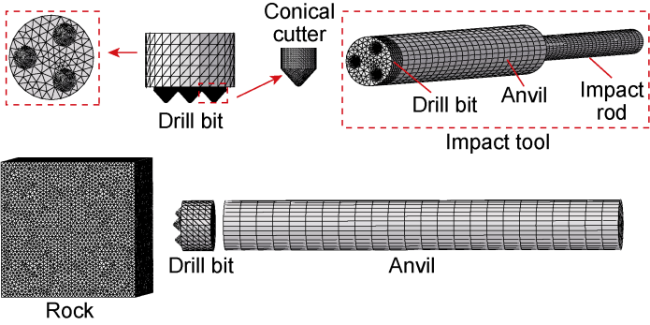
Fig. 9. Meshing of the axial impact rock breaking system. |
Based on the established 3D numerical model for axial impact rock breaking, simulations were conducted with varying conical cutter forward rake angles, rock temperatures, and impact velocities to investigate their effects on rock breaking mechanisms and energy transfer patterns. Three simulation schemes were implemented: (1) Impact velocity fixed at 6 m/s and rock temperature at 300 °C, while varying the forward rake angle: 0°, 10°, 20°, 30°, 40°. (2) Impact velocity fixed at 6 m/s and rake angle at 20°, while varying rock temperature: 25, 100, 200, 300, 400 °C. (3) Rock temperature fixed at 300 °C and rake angle at 20°, while varying impact velocity: 4, 5, 6, 7 m/s.
3.2. Simulation results
3.2.1. Energy transfer and partitioning analysis
Utilizing the simulation case with a conical cutter forward rake angle of 40°, rock temperature of 300 °C, and impact velocity of 6 m/s, the energy transfer pattern during axial impact were analyzed. As illustrated in Fig. 10, this process comprises four distinct phases: (1) 0-65 μs: The majority of the impact rod’s energy is converted into kinetic and strain energy of the anvil, along with kinetic energy of the drill bit. (2) 65-325 μs: Energy from the anvil (kinetic/strain) and drill bit (kinetic) is transferred to the rock, manifesting as rock strain energy, fracture energy, and comprehensive frictional energy. (3) 325-780 μs: Drill bit rebound occurs, whereby stored strain energy in the rock is primarily reconverted into kinetic energy of the drill bit and anvil. (4) 780-1 000 μs: The anvil impacts the impact rod, transferring its kinetic energy back to the impact rod.
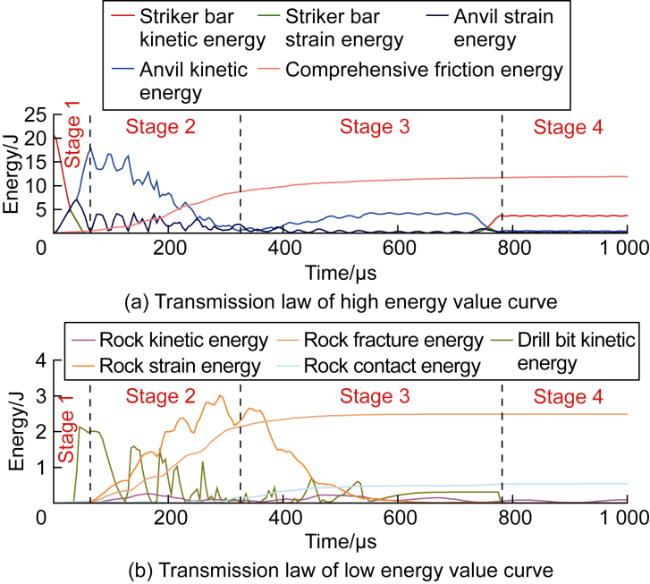
Fig. 10. Energy transfer laws in axial impact process. |
In impact rock-breaking processes, enhancing the proportion of rock fracture energy is critical for improving effective energy utilization. Conversely, frictional dissipation detrimentally affects rock breakage efficiency and should be minimized. Statistical analysis was performed on the percentages of rock fracture energy versus system frictional dissipation across varying conical cutter forward rake angles, rock temperatures, and impact velocities (Table 3). It shows that throughout the impact process, the fracture energy for rock breaking accounted for 7.52%-12.51%, while the proportion of comprehensive frictional dissipation was high up to 57.26%-78.10%, indicating low effective utilization efficiency of impact energy. The future researches will integrate with digital image technology (DIC) and acoustic emission three-dimensional positioning to deeply reveal the energy dissipation paths, so as to reduce the noneffective energy loss.
Table 3. Percentages of rock fracture energy and comprehensive friction energy under different simulation conditions |
| Simulation parameter | Value | Proportion of rock fracture energy/% | Proportion of comprehensive frictional energy/% |
|---|---|---|---|
| Forward rake angle | 0° | 7.52 | 78.10 |
| 10° | 9.77 | 71.38 | |
| 20° | 12.51 | 73.82 | |
| 30° | 12.03 | 73.48 | |
| 40° | 11.95 | 57.26 | |
| Rock temperature | 25 °C | 8.68 | 64.17 |
| 100 °C | 8.53 | 68.21 | |
| 200 °C | 10.39 | 71.75 | |
| 300 °C | 12.51 | 73.82 | |
| 400 °C | 11.87 | 73.82 | |
| Impact velocity | 4 m/s | 9.35 | 64.74 |
| 5 m/s | 11.78 | 68.38 | |
| 6 m/s | 12.51 | 73.82 | |
| 7 m/s | 10.28 | 74.64 |
3.2.2. Effect of conical tooth forward rake angle
Damaged rock elements at different impact angles were extracted from Scheme ① to characterize fracture morphology (Fig. 11). The darker the color in the figure, the more significant the degree of overlap and embedding of the damage element is. Results demonstrate that: (1) At low forward rake angles, rock failure primarily localized at the cutter base, with damage confined within one bit diameter; (2) Increasing the forward rake angle expanded damage propagation outward, reaching maximum spatial extent at 20°; (3) As the forward rake angle further increased to 30°, rock fracture intensity and damage area progressively diminished. The nodes of damaged elements were extracted further and projected onto the bottomhole plane (Fig. 12). With the bottomhole center as the circle center, the zone in the range of bit radius (less than or equal to 1.0R) was assumed as the bottomhole zone and greater than 1.0R as the wellbore periphery. At 0° forward rake angle, rock damage concentrated entirely within 1.0R. As forward rake angles increased, impact energy redirected from axial to radial components, driving peripheral damage expansion (e.g., 2.0R at 20°). However, angles exceeding this threshold reduced damage extent.
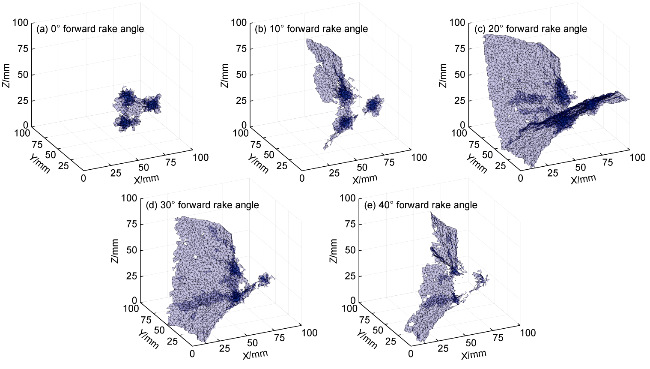
Fig. 11. Effect of cutter forward rake angle on rock damage range (3D view). |
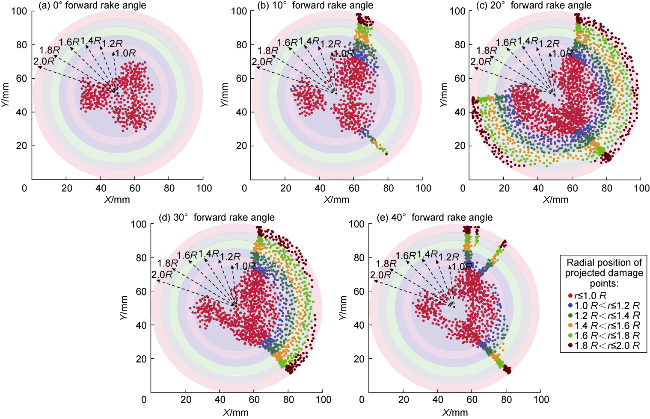
Fig. 12. Projection of rock damage extent under different conical cutter forward rake angles. |
Quantitative analysis of the influence of the forward rake angle on penetration depth and contact area (Fig. 13), combined with the 3D visualization of rock damage extent (Fig. 11), reveals that variations in the forward rake angle significantly influence the transition in rock failure modes. Specifically, the penetration depth at a 0° forward rake angle is 2.2 times that at 40°. Increased forward rake angle reduces the penetration capability of conical teeth. However, it promotes decomposition of axial force into radial components, enhancing tensile fracture and expanding the rock damage zone. Conversely, conical teeth with low forward rake angles predominantly induce shear failure within a limited area. Furthermore, the contact area between conical teeth and rock dictates stress per unit area. The minimum contact area occurs at 20° forward rake angle. Consequently, this configuration yields the highest unit-area stress, causing the most severe rock damage.
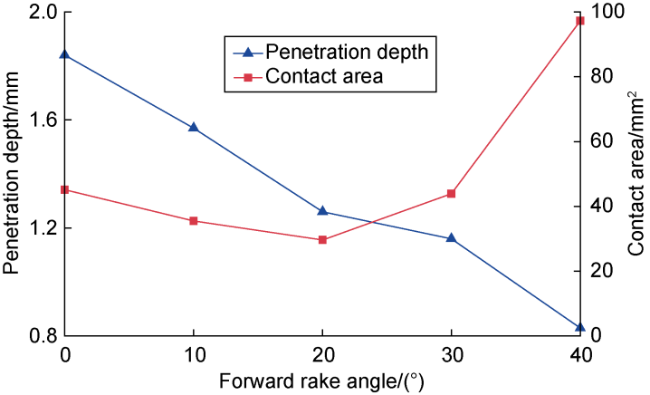
Fig. 13. Influence of forward rake angle on penetration depth and contact area of conical teeth. |
Energy allocation patterns were calculated and plotted according to energy types within the impact system (Fig. 14). Combined with Fig. 11, it shows that when the forward rake angle is below 20°, rock-breaking primarily occurs locally around the conical teeth with minor damage. Insufficient energy absorption results in substantial residual energy in the anvil. At forward rake angles between 20° and 30°, the rock breaking zone expands radially with intensified damage, significantly increasing energy absorption by the rock. Conversely, at a 40° forward rake angle, inadequate penetration capability of the bit reduces rock damage, leading to decreased overall energy absorption. Simultaneously, significant energy accumulation occurs in the impact rod due to bit rebound.
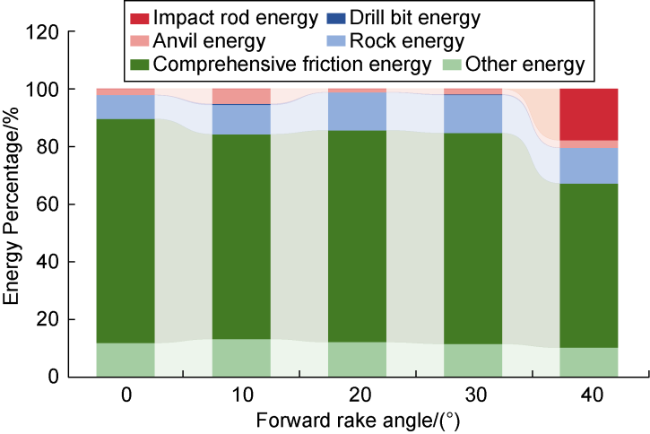
Fig. 14. Effect of forward rake angle of conical teeth on energy allocation. |
3.2.3. Effect of rock temperature
According to the parameters set in scheme ②, penetration depth of conical teeth and damaged element count in rock were calculated (Fig. 15). The results demonstrate that both metrics change gradually when rock temperature remains below 200 °C. At 400 °C rock temperature, however, the damaged element count reaches 11.2 times that at ambient temperature (25 °C), while penetration depth increases by a factor of 1.5. This pronounced enhancement confirms the significant influence of temperature on impact rock breaking.
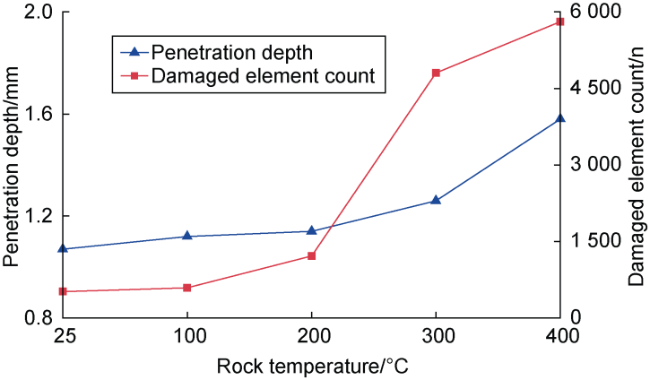
Fig. 15. Effect of rock temperature on penetration depth of conical teeth and damaged element count. |
As rock temperature increases, reduced rock strength allows equivalent macroscopic failure to be achieved with lower impact energy. Consequently, penetration capability of conical teeth is enhanced, while rebound of impact tools diminishes. This results in decreased residual energy in both the anvil and drill bit, alongside progressively elevated comprehensive friction energy (Fig. 16). Beyond 300 °C, however, the energy absorption by rock plateaus and subsequently declines. This indicates that elevated temperatures inhibit rock's capacity to absorb impact energy, impairing efficient energy transfer. These findings align with percussive test results reported by Zhao et al. [18].
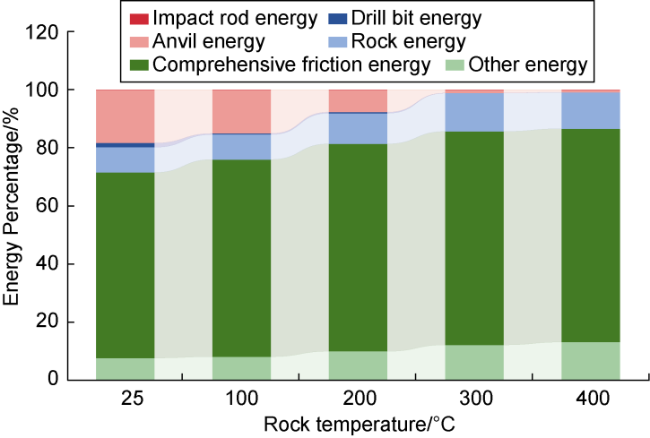
Fig. 16. Effect of temperature on energy allocation. |
3.2.4. Effect of impact velocity
According to the parameters set in scheme ③, penetration depth of conical teeth and damaged element count in rock were calculated at varying impact velocities (Fig. 17). The results demonstrate that at 7 m/s impact velocity, penetration depth reaches 2.35 mm, which is 2.8 times that of 4 m/s (0.83 mm). Additionally, damaged element count at 7 m/s registers 5 003 elements, which is 19.7 times that at 4 m/s (254). These measurements confirm that increasing impact velocity substantially enhances rock-breaking efficiency. Notably, while impact velocity escalation from 6 m/s to 7 m/s yields an 86.5% increase in penetration depth, damaged element count rises by only 4.1%. This indicates that impact velocity and rock fragmentation are not completely in a positive correlation, suggesting the existence of an optimal impact velocity.
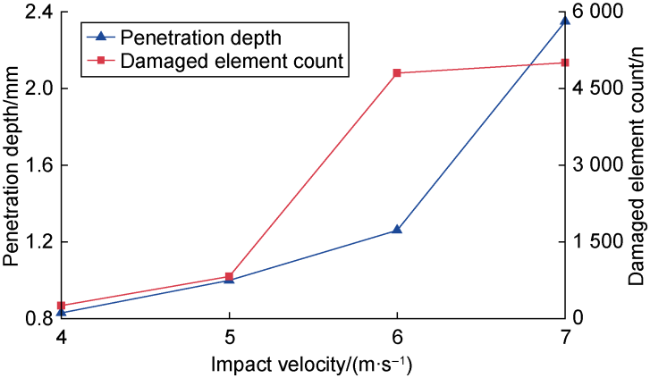
Fig. 17. Penetration depth of conical cutter and number of damaged rock elements under different impact velocities. |
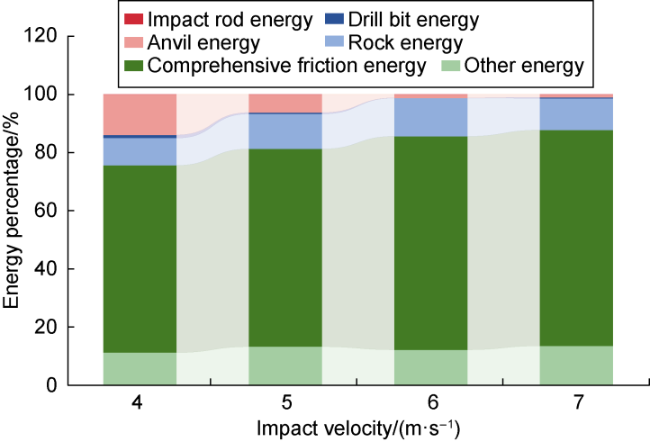
Impact velocity directly determines the initial energy of the impact system. Under low impact velocities (below 6 m/s), rock fragmentation degree is limited, resulting in less energy absorbed by rock while the anvil retains more residual energy (Fig. 18). As impact velocity increases, rock fragmentation intensifies, causing increases in both energy absorbed by rock and system frictional dissipation. However, when impact velocity exceeds 6 m/s, rock fragmentation degree tends to stabilize (Fig. 17), and the percentage of energy absorbed by rock decreases, indicating the existence of an optimal impact velocity. The optimal impact velocity in this model is 6 m/s, where energy absorption by rock and fragmentation degree achieves their optimal states. It should be noted that different cutter geometries and formation conditions (e.g., rock type, temperature) exhibit distinct energy transfer patterns and require different optimal impact velocities, so the determination of optimal values must consider specific engineering contexts.
Fig. 18. Energy allocation patterns under different impact velocity. |
4. Conclusions
During axial impact rock breaking of conical bits in hot dry rocks, energy consumption is predominantly concentrated in Stage 2 of bit-rock interaction. The proportion of energy utilized for rock fragmentation ranges merely from 7.52% to 12.51%, indicating universally low impact energy utilization efficiency. Enhancement pathways include optimizing impact parameters, tooth geometry, and percussive tool design to improve energy utilization efficiency in hot dry rock drilling.
Conical cutter forward rake angles either too large or too small are unfavorable for effective utilization of impact energy by rock, thereby reducing rock fragmentation effectiveness; an optimal forward rake angle value exists. High-temperature environments hinder rock's absorption and transfer of energy during impact fragmentation. Increasing impact velocity intensifies rock fragmentation degree, but when impact velocity is too high, frictional dissipation increases and the proportion of energy absorbed by rock decreases, preventing significant improvement in fragmentation degree, indicating that impact velocity also has an optimal value.
Nomenclature
di—displacement of node i, m;
Ec—contact energy, J;
Ee—elastic strain energy, J;
Efc—frictional energy, J;
Efr—fracture energy, J;
Ek—kinetic energy, J;
Fc—contact force, N;
Ff,i—frictional force at node, N;
Ffr—force acting on discrete element, N;
i—node index;
mi—mass of node i, kg;
n—total number of nodes;
vi—velocity of node i, m/s;
V—Volume, m3;
R—micro-bit radius, m;
r—radial position of projected damage point, m;
X, Y, Z—spatial coordinates, m;
ε—element strain tensor, Dimensionless;
σ—element stress tensor, MPa.