

Introduction
The theory of hydrocarbon genesis, involving biogenic and abiogenic gases, has important guiding significance for oil and gas exploration and production. Production practice has proved that most hydrocarbons are biogenic, namely from microbial degradation of organic matters (biogenic) [1] and/or thermal degradation/cracking of organic matters (thermogenic) [2-3]. Generally speaking, abiogenic gases refer to abiogenic alkane and carbon dioxide gases that are not dependent on biological processes, but are products of inorganic chemistry. In recent years, more and more abiogenic gas seeps have been found in hydrothermal fluids in mid-ocean ridges, ultramafic regions, the Precambrian Shield of Canada, mantle and igneous fluid inclusions, hot springs and volcanic reservoirs [4-13]. Even commercially valuable abiogenic alkane gas plays have been discovered in the Songliao Basin in China [9,11,14 -20]. Abiogenic gases are generated not only through mantle sources or magmatism in volcanic and geothermal areas at high temperature, but also gas-water-rock reactions at low temperature (lower than 100 °C) in continental environments (even at shallow depths). Their genesis is broadly categorized into two groups: magmatic process and gas-water- rock reaction [21].
Due to its simple composition, the origin and identification of natural gas depend on its composition and isotopes. The isotopic indexes include carbon, hydrogen, helium and other isotopes. Depending on the development of gas geochemistry and isotope geochemistry, as well as the research and development and application of related instruments, Chinese and foreign scholars have carried out a series of work on abiogenic alkane gas. A key focus in the study of abiogenic alkane gases involves understanding their geochemical features and genetic identification. Jenden et al. [22] believes that mantle-derived hydrocarbons in oil and gas fields have three characteristics: (1) methane (CH4) is enriched in 13C, i.e., δ13C1 is higher than −25‰; (2) methane and its homologues have negative carbon isotope series, i.e., δ13C1>δ13C2> δ13C3>δ13C4; and (3) high level of mantle-derived helium, i.e., R/Ra>0.1. Then Dai et al. [23] proposed four features of abiogenic alkane gas based on extensive geochemical data and characteristics collected in China: (1) Abiogenic methane has a relatively heavy carbon isotopic composition, generally higher than −30‰, while biogenic methane has a relatively light carbon isotopic composition, typically less than −30‰; (2) Abiogenic alkane gas (methane and its homologues) usually exhibits a negative carbon isotopic series (δ13C1>δ13C2>δ13C3>δ13C4), with δ13C1 generally higher than −30‰; (3) High percent of mantle-derived helium (R/Ra>0.5) and δ13C1 higher than δ13C2; (4) The CH4/3He≤1×106 is a general feature for abiogenic alkane gas, whereas in biogenic alkane gas, CH4/3He≥1×1011. Etiope et al. [21] noted that abiogenic methane may be enriched in 13C and D (deuterium) (δ13C1>−20‰, δD>−200‰) or depleted in 13C and D (−30‰>δ13C1>−47‰, δD<−200‰), attributing this variation to the carbon source (mantle- and crustal-derived) and carbon isotopic fractionation between CO2 and CH4.
Currently, there is relatively consistent recognition in China regarding the abiogenic origin of hot spring gases, but there are significant debates about the origin of deep alkane gases in the Songliao Basin. The popular viewpoints include high to over mature coal-derived gas [24], predominant abiogenic alkane gas [9,11,17 -19,25], mixture of abiogenic and biogenic alkane gases [14,16], and predominant coal-derived gas mixed with oil-type gas from the same layer [26]. In recent years, some studies have found that the carbon isotopic composition of inorganically synthesized methane may be much depleted in 13C (δ13C1 as low as −57‰) [27], and even a normal carbon isotopic distribution pattern (δ13C1<δ13C2<δ13C3<δ13C4) may appear among methane and its homologues [28]. Conversely, pyrolysis experiments on lignite at high temperature (500, 600, 700 °C) and high pressure (1, 2, 3 GPa) also found a reversed carbon isotopic distribution pattern (negative carbon isotopic series, i.e., δ13C1>δ13C2>δ13C3>δ13C4) [29]. This makes the identification between abiogenic and biogenic gases very difficult, and necessitates further research into the isotope fractionation of abiogenic gases. Based on previous studies, this paper comprehensively analyzes the geochemical characteristics of different types of alkane gases in China, aiming to deeply explore the isotopic fractionation of abiogenic alkane gases, providing clues for the study on the origin and identification of abiogenic alkane gases.
1. Data sources
The analytical data for this study primarily include abiogenic and biogenic alkane gas data. The abiogenic alkane gas mainly consists of abiogenic hydrothermal spring gas that has been confirmed [12-13,30 -33]. For the deep alkane gas data from the Songliao Basin, apart from the analytical data presented in this study (Table 1), the remaining data are cited from references [9,11,14-18,20,23,25,34-39]. Changling Gas Field falls within the mining right of PetroChina Company Limited (PetroChina), and Songnan Gas Field is under the mining rights of China Petroleum & Chemical Corporation (Sinopec). In fact, the two blocks are in the same gas field in the Songliao Basin. The biogenic alkane gas data are primarily natural gas data from domestic basins such as the Ordos, Sichuan, Tarim, Turpan-Hami, Ying-Qiong, Sanshui and Subei basins [23,40 -66]. For international abiogenic alkane gas data, samples were primarily collected from the Lost City hydrothermal field on the Mid-Atlantic Ridge (submarine hydrothermal system), the Milos volcanic island in Greece, the 21°N East Pacific Rise (EPR) (volcanic hydrothermal system), the Zambales ophiolite (serpentinized ultramafic rocks) in the Philippines, the Ilímaussaq igneous complex (igneous rock inclusions) in Greenland, and the Kidd Creek (igneous crystalline basement) in Canada [4-6,67 -69], all of which exhibit relatively distinct abiogenic characteristics.
Table 1. Geochemical data of deep natural gas in Xushen and Changde gas fields in Songliao Basin |
| Gas field | Well | Strata | Depth/ m | Natural gas composition content/% | δ13C/‰ | δD/‰ | R/Ra | ||||||||||||
|---|---|---|---|---|---|---|---|---|---|---|---|---|---|---|---|---|---|---|---|
| CH4 | C2H6 | C3H8 | C4H10 | CO2 | N2 | He | CH4 | C2H6 | C3H8 | C4H10 | CO2 | CH4 | C2H6 | C3H8 | |||||
| Xushen | XS1-201 | K1yc | 3 530.0- 3 540.0 | 94.46 | 2.05 | 0.48 | 0.230 | 1.38 | 1.38 | 0.012 | -27.4 | -31.8 | -33.7 | -34.4 | -6.8 | -204 | -213 | -186 | 0.82 |
| XS14 | K1yc | 3 787.5- 3 808.5 | 92.95 | 3.03 | 0.61 | 0.440 | 0.67 | 2.09 | 0.067 | -28.7 | -33.8 | -34.2 | -34.3 | ||||||
| XS1-4 | K1yc | 3 328.0- 3 358.0 | 94.56 | 2.13 | 0.36 | 0.070 | 1.53 | 1.30 | 0.011 | -28.6 | -32.2 | -34.0 | -35.1 | -7.6 | -202 | -210 | -182 | 1.15 | |
| XS2 | K1yc | 3 985.0- 4 002.0 | 88.55 | 2.75 | 1.31 | 0.620 | 4.19 | 2.41 | 0.024 | -27.2 | -31.3 | -32.6 | -33.6 | ||||||
| XS3 | K1yc | 3 800.0- 3 806.0 | 92.29 | 2.34 | 0.40 | 0.230 | 1.99 | 2.63 | 0.036 | -22.7 | -32.1 | -6.9 | |||||||
| XS4 | K1yc | 3 873.0- 3 881.0 | 94.63 | 2.23 | 0.48 | 0.130 | 0.33 | 2.14 | 0.026 | -28.9 | -29.2 | -30.2 | -30.9 | ||||||
| XS401 | K1yc | 4 182.0- 4 190.0 | 92.48 | 1.70 | 0.40 | 0.090 | 3.41 | 1.91 | 0.021 | -25.3 | -33.2 | ||||||||
| XS6 | K1sh | 3 629.0- 3 637.0 | 95.77 | 2.39 | 0.49 | 0.110 | 0.28 | 0.86 | 0.008 | -28.3 | -33.2 | -34.3 | -34.5 | -13.0 | -204 | -212 | -179 | 1.04 | |
| XS7 | K1yc | 3 874.0- 3 880.0 | 94.72 | 2.48 | 0.43 | 0.220 | 0.44 | 1.64 | 0.033 | -27.2 | -32.7 | -33.3 | -33.4 | ||||||
| XS901 | K1yc | 3 892.0- 3 911.5 | 86.05 | 2.06 | 0.37 | 0.130 | 5.85 | 5.49 | 0.042 | -22.4 | -32.0 | -32.8 | -5.6 | ||||||
| Changde | FS701 | K1yc | 3 840.0 | 93.71 | 3.11 | 0.38 | 0.140 | 1.49 | 1.12 | -26.5 | -29.9 | -31.8 | -31.1 | -5.9 | -204 | ||||
| FS9 | K1yc | 3 602.0- 3 673.6 | 8.337 | 0.171 | 0.002 | 90.79 | 0.62 | 0.014 | -22.5 | -30.3 | -31.8 | -33.2 | -3.8 | ||||||
| FS9 | K1yc | 3 685.5- 3 737.6 | 15.56 | 0.38 | 0.15 | 0.060 | 82.33 | 1.51 | 0.010 | -27.5 | -30.9 | -31.9 | -34.3 | -6.2 | -204 | ||||
| FS9-1 | K1yc | 3 642.0- 3 649.0 | 9.21 | 0.13 | 0.04 | 0.020 | 85.41 | 5.18 | 0.010 | -25.8 | -30.4 | -31.0 | -32.6 | -6.9 | 1.30 | ||||
2. Geochemical characterization of abiogenic gas
2.1. Chemical composition
The chemical composition of abiogenic gas varies significantly, with considerable differences observed across different regions both domestically and internationally. In hot springs in China, abiogenic alkane gas has a relatively low methane content, generally less than 1%, almost no C2+ heavy hydrocarbon gas, and dominant CO2 in most samples, or N2 in a few samples, and there is an inverse relationship between CO2 and N2 (Fig. 1). For example, in hot spring samples from Large and Small Boiling Springs, Pearl Spring and Huaitaijing Spring in Tengchong County, Yunnan Province; Tianchi hot springs in Changbai Mountain; Tuoba Town hot springs in Sichuan Province; and Hengjing hot springs in Jiangxi Province, the CO2 content almost exceeds 95%. The CO2 content in the Hengjing hot spring sample reaches 99.84% [33], and that in Tengchong County also records a high CO2 content of 99.92% [12]. In contrast, the hot spring sample from Reshui Town in Keshiketengqi, Inner Mongolia, has a N2 content as high as 97.84%, and the Shizui hot spring sample in Midu County, Yunnan Province, also shows a high N2 content of 87.58% [12].
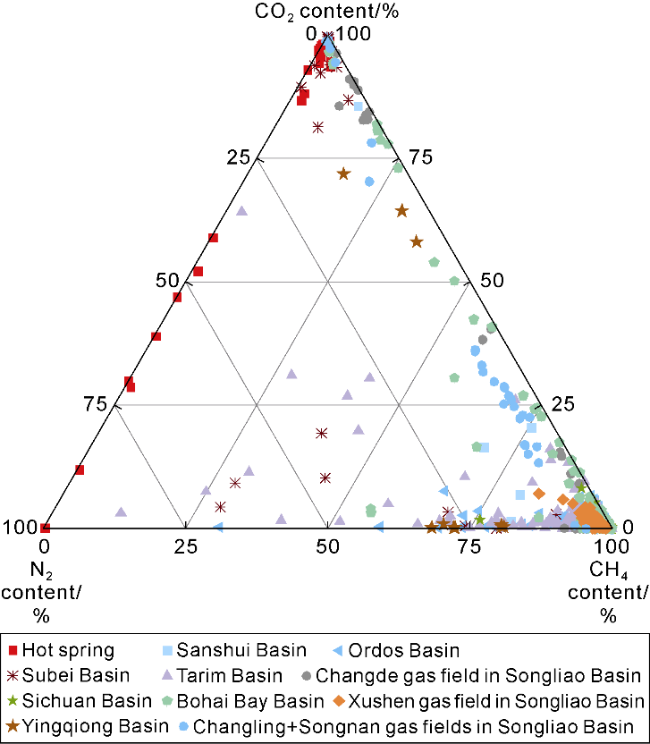
Fig. 1. Triangular diagram of CH4, CO2 and N2 contents in natural gas from different regions of China. |
The methane content in abiogenic gas from hot springs is generally below 1%, primarily plotted near N2 and CO2 endmembers in Fig. 1. Gas samples from the Songliao Basin are predominantly methane, with highly variable CO2 content and generally low N2 content. In contrast, biogenic gas samples from the Subei Basin, Ying-Qiong Basin, Bohai Bay Basin and Sanshui Basin exhibit relatively high CO2 contents, mainly distributed along the correlation line between CO2 and CH4. Some samples from the Subei Basin, Sanshui Basin and Ying-Qiong Basin show relatively high N2 contents. Biogenic gas samples from sedimentary basins such as Tarim, Sichuan and Ordos are primarily methane-dominated, with a certain amount of N2, and some samples have N2 content of over 50% (Fig. 1).
2.2. Isotopic composition of methane and CO2
The carbon isotopic composition of abiogenic methane is generally heavier, mostly higher than −30‰. There are considerable debates regarding the lower limits of carbon isotopes of abiogenic methane, primarily focusing on values higher than −30‰, such as higher than −20‰ [70], −25‰ [22] and −30‰ [23,71]. Methane found in shield rocks (i.e., Kidd Creek in Canada and Scandinavia in Scandinavia) exhibits relatively lighter carbon isotopic composition ranging from −44.9‰ to −22.4‰ [6-7], which may be related to their origin and carbon isotopic fractionation between CO2 and CH4 [21]. Gas samples from Zambales, Ilímaussaq, Lost City, EPR and Milos show heavier carbon and hydrogen isotopic compositions of methane, located in the upper right of Fig. 2, with δ13C1 values mostly higher than −20‰ and δD1 values mostly higher than −200‰ [4,5,67 -69]. The δ13C1 value of the gas sample from the Liuhuangtang hot spring in Tengchong in China is −19.9‰, and the δD1 value is −130‰, falling within the range of abiogenic alkane gas isotopic compositions, indicating an abiogenic origin [71]. The δ13C1 values of gas samples from the Tuoba Town hot spring in Ganzi, Sichuan, range from −26.6‰ to −23.8‰, and δD1 values range from −213‰ to −111‰, with hydrogen isotopic compositions showing a wide variation. The methane carbon isotopic compositions in Changling and Songnan gas fields in the deep Songliao Basin are heavier, ranging from −32.7‰ to −11.4‰, with an average of −22.0‰. Some samples from Changde gas field also exhibit relatively heavy carbon isotopic compositions, with δ13C1 higher than −20‰, close to the carbon and hydrogen isotopic distribution of the abiogenic alkane methane aforementioned (Fig. 2). In addition to becoming heavier with increasing thermal maturity of the source rock, the hydrogen isotopic composition of biogenic methane is also influenced by water salinity [3,71 -72]. For example, natural gas from the Turpan-Hami Basin, derived from freshwater lacustrine organic matter, has significantly lower methane hydrogen isotopic compositions, mostly less than −250‰ [65-66].
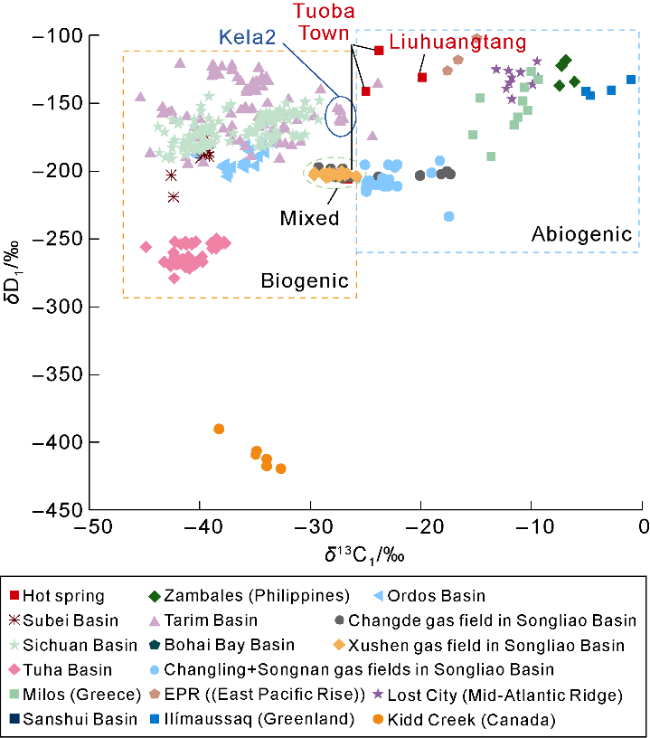
Fig. 2. Carbon and hydrogen isotopic compositions of methane of different origins from partial areas in the world (the Touba Town data is from Academician Dai Jinxing). |
The difference in carbon isotopic composition between CO2 and CH4 (δ13CCO2−δ13C1) gradually increases as the δ13C1 value decreases (Fig. 3a) and exhibits a linear relationship over a large scale. This phenomenon reflects the differences in carbon isotopic composition among natural gases of various genetic origins. When plotting (δ13CCO2−δ13C1) against δ13CCO2, a similar linear relationship is observed under certain conditions, such as in deep natural gases and hot spring gases from the Songliao Basin, as well as natural gases from the Bohai Bay Basin. This suggests that genetic differences in natural gases from different regions may influence the isotopic distribution between CO2 and CH4 to some extent (Fig. 3b).
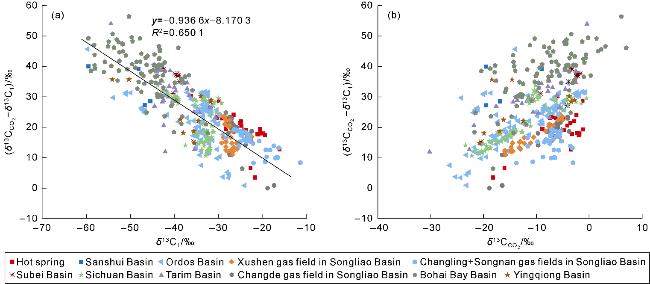
Fig. 3. Diagrams of (δ13CCO2−δ13C1) vs. δ13C1 (a) and δ13CCO2 (b) of natural gases from different regions of China (R is correlation coefficient). |
The sources of methane and carbon dioxide may be the same or different. For instance, both methane and carbon dioxide may derive from biogenic or abiogenic origins, but there may be cases where carbon dioxide is of abiogenic origin while methane is biogenic, or vice versa. Following a general trend, regardless of biogenic or abiogenic origin, as the δ13C1 value increases, the difference in carbon isotopic composition between carbon dioxide and methane becomes smaller; whereas when the δ13C1 value is smaller, the difference in carbon isotopic composition between the two gases increases. This phenomenon is closely related to the similarities and differences in their gas sources.
The δ13C values of biogenic CO2 are generally less than −10‰, while those of abiogenic CO2 typically exceed −8‰ [10,73]. The δ13C values of CO2 in hot spring gas samples are usually higher, indicating that the CO2 in these samples is primarily of abiogenic origin. In contrast, individual samples (such as those from Reshui Town, Keshiketengqi, Inner Mongolia) exhibit characteristics of biogenic origin (δ13CCO2 values below −10‰). This isotopic difference between CO2 and CH4 may reflect distinct carbon isotopic signatures from different sources. For example, in Well Fangshen-1 in Changde Gas Field, although CO2 and CH4 share the same δ13C value (−18.9‰), their carbon isotopic compositions show a decoupled relationship due to different origins. Specifically, the methane carbon isotope from the well is −18.9‰, and the carbon isotopic compositions of methane, ethane, and propane form a negative carbon isotope series (δ13C1>δ13C2>δ13C3), consistent with the characteristics of abiogenic alkane gas. However, the δ13CCO2 value is −18.9‰, so the CO2 is of biogenic origin according to Dai et al. [10]. Based on Horita’s [74] theoretical calculation of carbon isotope equilibrium fractionation in the C-H-O system (including CO, CO2, C1-C4, etc.), the theoretical equilibrium fractionation between CO2 and CH4 at 300 °C is approximately 25‰, and decreases to around 14‰ at 500 °C. These fractionation temperatures are significantly higher than actual formation temperatures, and even at 500 °C, the theoretical carbon isotope fractionation between the two remains as high as 14‰. However, in Well Fangshen-1, both CO2 and CH4 have δ13C values of −18.9‰, suggesting they are from different sources [11]. The same applies to Well Fangshen-2 in Changde Gas Field.
2.3. Carbon isotopic characteristics of methane and its homologues
2.3.1. Carbon isotopic fractionation of methane and its homologues
The formation mechanism of biogenic alkane gas involves the thermal cracking of large organic molecules into smaller hydrocarbon compounds. Due to isotopic kinetic fractionation, the 12C—12C bond breaks more readily than the 12C—13C bond, resulting in cracked products having richer 12C than the precursor. This leads to methane and its homologues (C1-C4) being enriched in 13C with increasing carbon number, and a "positive carbon isotopic series" (δ13C1<δ13C2<δ13C3<δ13C4) [2]. Conversely, the formation of abiogenic alkane gas is a polymerizing reaction where small molecules are merged into larger ones. In this case, the 12C—12C bond breaks relatively easily, causing preferential accumulation of 12C in the polymer. In the process, higher-carbon-number alkane gases become progressively depleted in 13C compared to lower-carbon- number ones, exhibiting a "negative carbon isotopic series" (δ13C1>δ13C2>δ13C3>δ13C4) [2].
Specifically, abiogenic alkane gas can be formed through various chemical reactions, such as polymerization, Fischer-Tropsch synthesis, carbonate metamorphism, or water-rock reaction associated with serpentinization [27-28,75], resulting in diverse compositional and isotopic characteristics. Lollar et al. [76] proposed that during the synthesis of ethane and hydrogen from two methane molecules, ethane becomes relatively depleted in 13C due to carbon addition but enriched in deuterium (D) due to hydrogen loss. Subsequently, the synthesis of propane, butane and pentane primarily follows simple isotopic mass balance, with negligible carbon isotopic fractionation. McCollom et al. [77] suggested that when CO and H2 combine into methylene (—CH2—) on a catalyst surface, the carbon isotopic fractionation between CO and methylene can be as high as 30‰ to 34‰, but fractionation becomes insignificant when methylene is converted into CH4. Further carbon isotopic fractionation occurs with the formation of ethane or ethylene, enriching ethane or ethylene in 13C by approximately 7‰ to 10‰ relative to methane. However, no additional fractionation occurs when these methylene units are rapidly polymerized into straight-chain alkanes[78]. Thus, the isotopic composition of the alkyl chain is primarily determined by the carbon isotopic characteristics of the Cn−1 (n is carbon number) alkyl chain and the newly added C1 methylene unit [77]. Based on the study on Hakuba Happo hot spring system in Japan, Suda et al. [79] proposed a distinct abiotic polymerization model in which, for a given alkane, the first carbon in the chain has the heaviest isotopic composition, while subsequently added carbons share the same isotopic signature and are relatively depleted in 13C compared to the first carbon.
2.3.2. Carbon isotopic series of methane and its homologues
The abiogenic alkane gases currently discovered worldwide exhibit a distinct negative carbon isotopic series. The abiogenic alkane gas in the Murchison meteorite shows a gradual lighter carbon isotopes with increasing carbon number (δ13C1>δ13C2>δ13C3), namely a typical negative carbon isotopic series [80] (Fig. 4a). Similarly, fluid inclusion samples from the Khibiny massif in Russia and abiogenic methane, ethane, and propane from the Lost City hydrothermal field at 30°N on the Mid-Atlantic Ridge also display a clear negative carbon isotopic series[67,81 -82] (Fig. 4a). In China, the currently discovered hot spring gases contain too low contents of methane and heavier hydrocarbon gases to study in-depth. The alkane gases from deep reservoirs in the Songliao Basin, such as Changling, Songnan, Changde and Xushen gas fields, all exhibit a negative carbon isotopic series (Fig. 4b). This contrasts with the biogenic alkane gases like oil-type gas and coal-derived gas found in the basin, which show a positive carbon isotopic series (δ13C1<δ13C2<δ13C3<δ13C4) [9,14,16] (Fig. 4c). Fig. 4c presents the carbon isotopic compositions of some oil-type gases and highly-overmature coal-derived gases in the Songliao Basin. For instance, the δ13C1 value of coal-derived gas reaches −26.1‰, yet methane and its homologues still follow a positive sequence. This is somewhat similar to the natural gas from the Kela 2 well block in the Kuqa Depression, Tarim Basin. For example, the carbon isotopic values of methane, ethane and propane from Well Kela 203 are −27.3‰, −18.5‰ and −19.0‰, respectively, with ethane and propane showing close or slightly reversed carbon isotopic values [57].
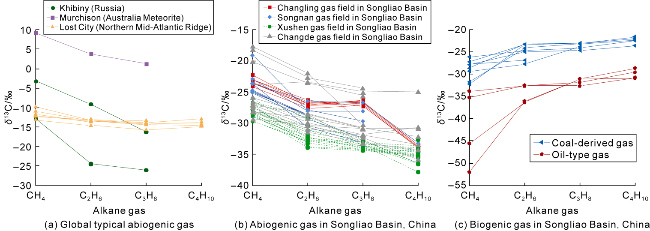
Fig. 4. Carbon isotopic distribution of methane and its homologues in natural gas of different regions. |
2.3.3. Causes for carbon isotopic reversal in methane and its homologues
Many factors cause carbon isotopic reversal, even a negative carbon isotopic series. Dai et al. [83] pointed out that abiogenic alkane gases exhibit a primary-type negative carbon isotopic series, but secondary-type negative carbon isotopic series may also occur in overmature shale gas and coal-derived gas. Under overmature or high-temperature (higher than 200 °C) conditions, secondary cracking, diffusion, or Rayleigh fractionation of ethane and propane—either individually or in combination—can promote the formation of a secondary-type negative carbon isotopic series.
Huo et al. [16] conducted thermal simulation experiments on Jurassic gas source rocks taken in the Songliao Basin and found that when the vitrinite reflectance (Ro) of the gas source rocks was less than 2%, methane and its homologues exhibited a normal isotopic sequence (δ13C1<δ13C2<δ13C3<δ13C4); when Ro ranged from 2.0% to 2.5%, the sequence became δ13C1<δ13C2<δ13C3>δ13C4; and when Ro was between 2.5% and 3.0%, the pattern shifted to δ13C1<δ13C2, δ13C3, δ13C3>δ13C4, but δ13C1>δ13C2 was not observed. Dai et al. [84] discovered that from northern Shenmu gas field (Ro=0.7%, Well S85) to southern Yan'an gas field (Ro=2.7%, Well T28-1) in the Ordos Basin, the thermal evolution of the source rocks progresses from low to high maturity and then to over-maturity. The carbon isotopic composition distribution of methane and its homologues in alkane gas initially follows a normal sequence but gradually reverses as gas wetness decreases. In the southern region where the gas becomes entirely dry, the carbon isotopic composition distribution fully transitions to a negative carbon isotopic series. Studies indicate that in the over-mature coal-derived gas areas in the southern Ordos Basin, the gas source rocks are coal and dark mudstone from the Benxi, Taiyuan, and Shanxi formations. In regions with Ro>2.0%, a complete reversal of carbon isotopic composition occurs, coexisting with partial isotopic reversal [83]. Laboratory analyses have also confirmed the influence of high temperature on carbon isotopic fractionation of methane and its homologues. For example, Du et al. [29] observed that at high temperatures (500, 600, 700 °C), lignite pyrolysis produces methane and its homologues with a fully negative carbon isotopic series.
At high maturity, whether from sapropelic or humic source rocks, the primary migration phase of the generated natural gas is diffusion, which facilitates the diffusion. Influenced by molecular diameter, methane that has the smallest molecular diameter diffuses the fastest, followed by ethane, propane and butane. Due to lighter mass than 13CH4, 12CH4 diffuses faster. As a result, 12CH4 preferentially separates, leading to continuous accumulation of 13CH4. This causes the carbon isotope of methane to gradually become heavier, and may even result in carbon isotopic composition reversal or a negative carbon isotopic series.
2.4. Hydrogen isotopic compositions of methane and its homologues
The mechanism of hydrogen isotope fractionation of abiogenic alkane gases exhibits significant complexity. For instance, abiogenic methane and ethane in the Khibiny igneous rocks of the Kola Peninsula in Russia (δD1>δD2) [85], and alkane gas from the Lost City hydrothermal system at the Mid-Atlantic Ridge (δD1>δD2>δD3) [67], both show a trend of hydrogen isotopes becoming progressively lighter with increasing carbon number. However, alkane gas in the Kidd Creek crystalline rocks of the Canadian Shield displays an opposite fractionation pattern (δD1<δD2<δD3<δD4) (Fig. 5a) [6].
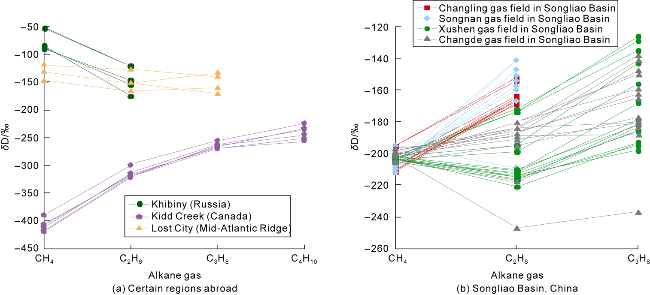
Fig. 5. Hydrogen isotopic composition of methane and its homologues in some regions worldwide. |
Compared to studies on carbon isotopic composition, the hydrocarbon content in hot spring gases is extremely low, so scarce data of hydrogen isotopic composition have been collected. Notably, the hydrogen isotopic composition distribution of deep alkane gases in the Songliao Basin exhibits unique fractionation characteristics, primarily manifested in two patterns: normal distribution (δD1<δD2<δD3) and V-shaped distribution (δD1>δD2, δD2<δD3) (Fig. 5b). The V-shaped distribution has been observed in the Xingcheng gas reservoir in Xushen gas field (e.g., wells Xushen 1, Xushen 1-1, Xushen 1-4, Xushen 1-201, Xushen 5, Xushen 6, Xushen 6-1, and Xushen 6-2) [11,14,17,37] and Changde gas field (e.g. wells Fangshen 8 and Fangshen 2) [14]. Further analysis revealed that in the normal distribution samples from the Xingcheng gas reservoir (wells), the hydrogen isotopic compositions of methane and ethane are similar, while propane is significantly enriched in deuterium (Fig. 5b). Although the hydrogen isotopic compositions of ethane and propane in the Songliao Basin partially overlap with those in the Lost City, the hydrogen isotopic composition of methane (approximately −200‰) is markedly lighter than that in the Lost City (greater than −150‰). Liu et al. [14] proposed that abiogenic methane (with heavier hydrogen isotopes) may account for the V-shaped distribution (δD1>δD2, δD2<δD3), while the normal fractionation of ethane and propane suggests their biogenic origin.
The hydrogen isotope distribution of deep alkane gases in the Songliao Basin has a notable feature (Fig. 6). The hydrogen isotopic composition of methane changes slightly, only 9‰ (from −205‰ to −196‰, and −202‰ on average, for 43 samples). However, the hydrogen isotopic composition of ethane varies more than 10 times the methane, up to 91‰ (from −247‰ to −156‰, and −197‰ on average, for 38 samples). This result cannot be ascribed only to abiogenic methane. As shown in Fig. 6, the hydrogen isotopic composition of methane from the Lost City varies by 28‰, while that of ethane varies by 39‰—the difference between them is not substantial. This phenomenon, characterized by small methane hydrogen isotope variation vs. large variation in heavier hydrocarbon gases, has also been observed in Weirong, Taiyang, and Jiaoshiba shale gas fields in the Sichuan Basin (Fig. 6), which is attributed to hydrogen isotope fractionation between methane and connate water [86]. The carbon isotope composition of natural gas is primarily influenced by organic matter type and thermal maturity, while the hydrogen isotope composition is additionally affected by water salinity. Under favorable conditions, C1-C5 n-alkanes may exchange hydrogen isotopes with water to variable degrees for months [87]. Compared to C2+ heavier hydrocarbons, methane molecules may more readily form structured complexes with water molecules due to intermolecular attraction, facilitating hydrogen isotope exchange. Studies on the Mesozoic− Cenozoic formation water in the Tarim Basin [88] show that the δD of evaporated residue and freshwater ranges from −47.5‰ to −32.6‰, that of the primary water of diagenesis ranges from −57.9‰ to −50.1‰, and that of their mixture (freshwater, evaporated residue and primary water) ranges from −68.4‰ to −52.9‰. In the northern Songliao Basin, the δD of formation water is −100‰ in the Qingshankou Formation and −100‰ to −85‰ in the Quantou Formation [89]. Based on the studies above, if we assume three possible δD values for connate water in the deep Songliao Basin (−40‰, −60‰ and −80‰), and the methane hydrogen isotope is from −205‰ to −196‰, the corresponding αH2O-CH4 values would be 1.169-1.179, 1.146-1.156 and 1.123-1.133, respectively. The highest temperature experienced by the deep Xingcheng gas reservoir is estimated at around 200 °C [37], so the calculated hydrogen isotope fractionation factor (αH2O-CH4) at 200 °C is 1.154 [90], closely matching the result for connate water with δD=−60‰ (Fig. 7). This suggests that hydrogen isotope exchange between methane and connate water did take place, and might have reached or approached equilibrium fractionation. Consequently, the methane hydrogen isotope composition varies minimally and tends to be isotopically heavier, leading to a V-shaped distribution (δD1>δD2, δD2<δD3).
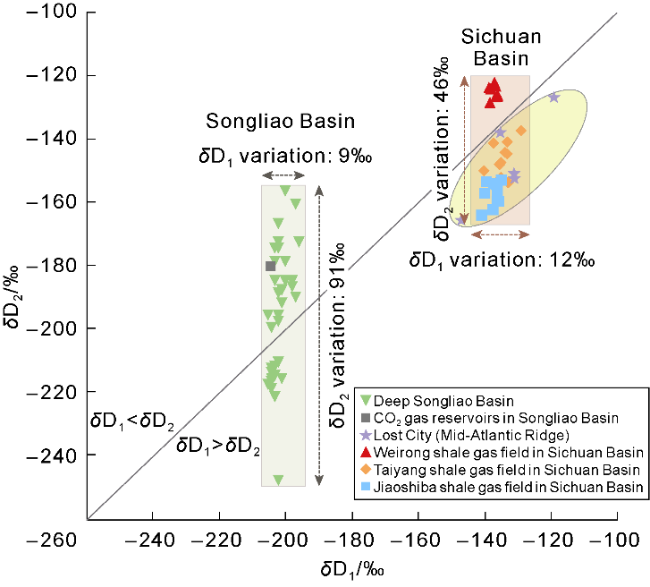
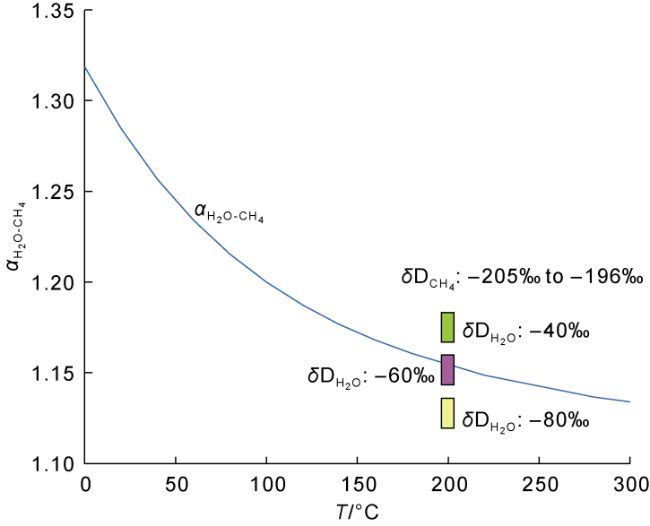
Fig. 7. Methane-water hydrogen isotopic fractionation vs. temperature (the blue curve represents theoretical calculations of hydrogen isotopic fractionation [90], and the green, purple, and yellow squares represent the assumed δD values of connate water). |
2.5. Helium isotopic composition and identification charts
Helium associated with abiogenic alkane gases generally exhibits a high isotopic composition, indicating a significant mantle-derived helium (3He) content. For instance, one of the three factors for abiogenic gases proposed by Jenden et al. [22] is R/Ra>0.1. As shown in Fig. 8a, gas samples from hot springs and deep alkane gases in the Songliao Basin are primarily plotted in the upper right of the δ13C1-R/Ra chart, and the R/Ra and δ13C1 values are relatively high, close to the mantle-derived endmember. These values resemble the gas compositions found in the Zambales ophiolite in the Philippines [4] and hydrothermal fluids near the 21°N East Pacific Rise [5], suggesting a high mantle-derived helium content. In contrast, biogenic natural gases from oil and gas fields in basins such as Tarim, Ordos, Sichuan and Bohai Bay are mainly plotted in the lower left of the δ13C1-R/Ra chart, near the crustal end-member, and R/Ra and δ13C1 values are relatively low, indicating a high crustal-derived helium content. However, a high mantle-derived helium content does not necessarily imply that the associated alkane gases are of abiogenic origin. The genetic sources of alkane gases and helium may not always be coupled. For example, Dai et al. [23] noted that natural gases in eastern China, such as in the Bohai Bay, Songliao, Subei, Ying-Qiong and East China Sea regions, exhibit R/Ra>0.1, but a positive carbon isotopic series (δ13C1<δ13C2< δ13C3<δ13C4). Therefore, after conducting comprehensive and comparative studies between abiogenic and biogenic alkane gases, Dai et al. [23] proposed that one indicator for abiogenic alkane gases is R/Ra>0.5 and (δ13C1-δ13C2)>0.
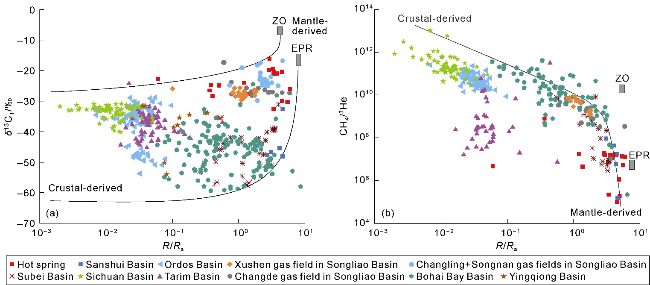
The CH4/3He-R/Ra chart is another important tool for distinguishing abiogenic from biogenic gases [22-23]. Generally, abiogenic alkane gases exhibit lower CH4/3He values (CH4/3He≤1×106) and higher R/Ra values. For example, abiogenic alkane gases in hydrothermal fluids near the East Pacific Rise at 21oN have CH4/3He values of (3.5- 6.5)×106 and R/Ra of 7.8 [5]. In contrast, biogenic alkane gases typically show higher CH4/3He values (CH4/3He≥ 1×10¹¹) and lower R/Ra values, such as 5.6×10¹² and 0.012 respectively observed in Well He 1 drilled in the Hewanchang area of the western Sichuan Basin [47]. On the CH4/3He vs. R/Ra chart, hot spring samples are predominantly plotted in the lower right, close to the mantle-derived endmember, indicating relatively low CH4/3He and high R/Ra values (Fig. 8b). Gas samples from basins such as Sichuan and Ordos mainly fall in the upper left of the chart, near the crustal endmember, reflecting higher crustal contribution. Gas samples from the Sanshui Basin resemble those from hot springs, also falling in the lower right near the mantle-derived endmember. Samples from the Bohai Bay Basin, Xushen Gas Field and Changde Gas Field in the Songliao Basin are distributed between crustal and mantle-derived endmembers, suggesting a mixed origin. Gas samples from the Tarim Basin generally occupy an intermediate position. However, compared to other samples, their CH4/3He values are notably lower, causing them to deviate from the trend line (Fig. 8b).
Helium isotope composition, in addition to being used alongside CH4 to assist in identifying the genetic origin of alkane gases, can be paired with CO2 to help determine the genetic sources of alkane gases and CO2. The sources of CO2 are primarily biogenic and abiogenic. The former typically has δ13CCO2 less than −10‰ and CO2 content generally below 20%, while the latter usually has δ13CCO2 higher than −8‰ and CO2 content exceeding 80%. Generally, for abiogenic CO2, mantle-derived CO2 exhibits lighter carbon isotope compositions, around (−6‰±2‰), whereas metamorphic CO2 has heavier carbon isotope compositions, approximately (0±3‰) [73]. On the CO2/3He-R/Ra chart, gas samples from Lost City predominantly fall in the lower right, close to the mantle-derived endmember. Hot spring gas samples also appear on the right side of the chart, as do samples from Changde and Xushen gas fields in the Songliao Basin, Subei Basin and Sanshui Basin, indicating mantle-derived components. Gas samples from the Bohai Bay Basin are more scattered, transitioning from the mantle-derived endmember on the right toward the crustal endmember on the left. In contrast, samples from the Sichuan, Ordos, and Tarim Basins mainly cluster on the left side, suggesting crustal-derived components (Fig. 9a). The CO2 content in natural gas samples varies widely from over 95% to below 5%. If the CO2 content exceeds 60%, it is primarily of abiogenic origin, but even samples with CO2 content below 5% may be abiogenic [41,73]. This could explain the scattered distribution of mantle-derived gas samples on the CO2/3He- R/Ra chart. For instance, the CO2/3He ratio variations of hot spring gas samples range from 1×10⁸ to 1×10¹¹, overlapping to some extent with those of biogenic alkane gas from basins like Sichuan and Ordos. The δ13CCO2-R/Ra chart combining carbon isotope composition of CO2 with helium isotope composition significantly improves the discriminative ability and better traces the CO2 origin. As shown in Fig. 9b, gas samples from hot springs, deep Songliao Changling, Songnan, Changde and Xushen gas fields, and Subei and Sanshui gas fields are mostly plotted in the upper section near the mantle-derived endmember, and display high R/Ra (greater than 0.5) and δ13CCO2 (greater than −10‰) values. Some samples from the Sichuan Basin and the Ordos Basin fall in the lower sedimentary endmember region, and show low R/Ra (less than 0.1) and δ13CCO2 (less than −10‰) values. Samples from the Tarim Basin and some areas of the Ordos Basin are near the carbonate endmember, and exhibit low R/Ra (less than 0.1) but high δ13CCO2 (greater than −10‰) values. Samples from the Bohai Bay Basin and the Ying-Qiong Basin are distributed in the middle, indicating mixed sources.
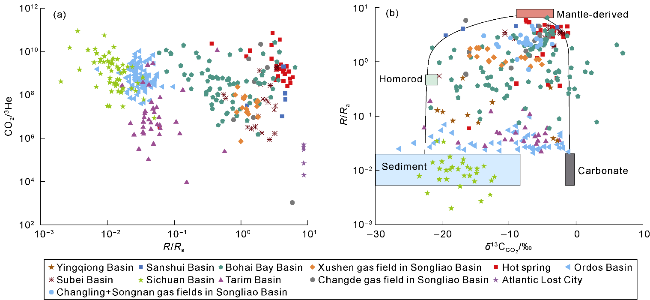
Fig. 9. Plots of CO2/3He vs. R/Ra (a) and δ13CCO2 vs. R/Ra (b) in natural gas from different regions (modified from Reference [91]). |
3. Identification of natural gas origins
The negative carbon isotope series (δ13C1>δ13C2>δ13C3> δ13C4), though often regarded as a distinctive marker for abiogenic alkane gases, is not an absolute criterion. When determining the origin of alkane gases, a comprehensive analysis should be conducted by integrating regional geological context, thermal evolution of source rocks, and other geochemical indicators.
Firstly, it is essential to clarify that a negative carbon isotope series can occur in highly mature biogenic gases. Laboratory synthesis and field evidence have shown that in highly mature coal-derived gases, the carbon isotope of methane not only becomes significantly heavier, but the carbon isotopes of ethane, propane and other homologues may be reversed, namely δ13C1>δ13C2>δ13C3 [83-84]. However, in reality, high temperature is a key factor causing the carbon isotopic reversal in methane and its homologues, but it is not the sole determining factor. For example, the thermal evolution of deep source rocks in basins like Songliao, Sichuan and Tarim are very high (Ro>2%), but the distribution of carbon isotope compositions of methane and its homologues is different—some are normal, and others are reverse. This may be related to regional geological conditions and processes.
The reverse patterns of carbon isotope compositions of abiogenic and biogenic alkane gases may be similar, but their forming mechanisms may be entirely different. The reversal of abiogenic alkane gases is typically associated with geological processes such as water-rock reaction, Fischer-Tropsch synthesis and polymerization reaction [76,92]. For example, Fischer-Tropsch Synthesis (FTS) can induce carbon isotope reversal [28]. Similarly, many geological processes can also cause the reversal of the normal carbon isotope series in biogenic alkane gases, such as abiogenic alkane gases mixing with the biogenic, coal-derived gas mixing with oil-type gas, gases from the same source but with different maturities mixing together, bacterial oxidation, high temperature, diffusion, adsorption and desorption, methane decomposition, secondary cracking and water-rock reaction [93-97]. Thus, the occurrence of isotope reversal does not necessarily indicate that the gas is of abiogenic origin.
Secondly, not all highly overmature coal-derived gases exhibit a negative carbon isotope series. For example, the natural gas from Kela 2 gas field in the Kuqa Depression of the Tarim Basin is a typical overmature coal-derived gas (δ13C1<δ13C2), with an average methane δ13C1 value of −27.5‰ (sample number of 43). The Ro calculated is 2.5%[98], but no negative carbon isotope series has been observed.
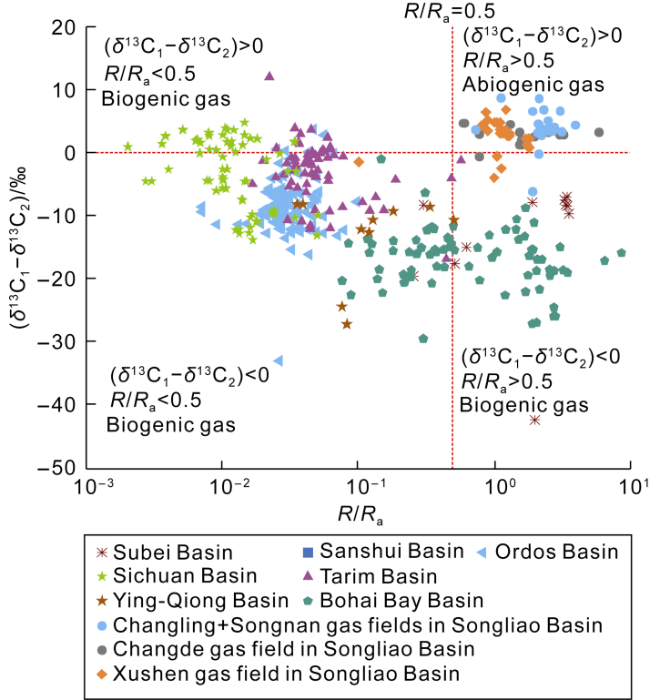
Finally, R/Ra>0.5 and (δ13C1−δ13C2)>0 are often regarded as key identification indicators for abiogenic alkane gases. In the study on Changling and Songnan gas fields in the Songliao Basin, Dai et al. [23,99] confirmed that the gas samples are predominantly of abiogenic origin by simultaneously examining R/Ra value, alkane gas carbon isotope series and carbon dioxide isotope composition. These samples frequently fall within the region where R/Ra>0.5 and (δ13C1−δ13C2)>0 (Fig. 10).
Fig. 10. Correlation between R/Ra and (δ13C1−δ13C2) (modified from Reference [23]). |
The distribution of the dryness coefficient also supports the above viewpoint. As thermal evolution progresses, propane and ethane continuously undergo cracking, leading to gradual increases in both the dryness coefficient and the carbon isotope values of natural gas. The average δ13C1 is −27.5‰, and average dryness coefficient is 0.992 in Kela 2 gas field [100]. The average δ13C1 is −21.8‰, and the average dryness coefficient is 0.978 in Songnan/Changling gas fields, which do not match. In addition, the low dryness coefficient (−21.8‰) is not caused by the mixing of gases generated by source rocks (i.e., Huoshiling Formation, Shahezi Formation, Yingcheng Formation) with different thermal evolution degrees. In conclusion, the natural gas in Songnan/Changling gas fields is almost abiogenic.
4. Conclusions
This paper systematically compares the geochemical characteristics of natural gas in hot springs with those in multiple sedimentary basins, summarizes key identification parameters for abiogenic gas in terms of component composition and carbon, hydrogen, and helium stable isotopes, and constructs a discrimination framework based on multi-index collaborative constraints. The research shows that abiogenic gas in typical hot springs is dominated by CO2, followed by N2, with extremely low hydrocarbon content, where methane is usually below 1%. This type of gas shows significant enrichment in δ13C1, often greater than −25‰, and exhibits a typical negative carbon isotope sequence (δ13C1>δ13C2>δ13C3>δ13C4), which is one of the important indicators of abiogenic synthesis pathways. The hydrogen isotopic composition displays diverse distribution patterns, including positive sequence arrangement, V-shaped distribution, and reversed sequence distribution, where the δD values of methane have a relatively small variation range, possibly due to hydrogen isotope exchange with connator water. Abiogenic alkane gases typically have R/Ra values greater than 0.5 and CH4/3He values less than or equal to 106, indicating the involvement of mantle-derived components and supporting their abiogenic origin. Comparison of cross-plot discrimination results for different genetic types of gases shows that the CH4/3He-R/Ra, δ13CCO2-R/Ra, and (δ13C1-δ13C2)-R/Ra cross-plots can more effectively distinguish between abiogenic and biogenic gases, demonstrating high indicative effectiveness in practice.
Nomenclature
R—³He/4He ratio of the sample, dimensionless;
Ra—³He/4He ratio of the air, dimensionless;
T—temperation, °C;
α—isotope fractionation factor, dimensionless.