

Introduction
The study on gas-bearing properties of deep coal rocks has a long history. As early as 1978, gas production at (0.4- 4.2)×104 m3/d was tested in deep coal rock (1 676-2 508 m) in the Piceance Basin of the United States. However, after exploration and experimental studies in multiple wells, it was believed that coalbed methane with a burial depth exceeding 1524 meters cannot be economically exploited. This conclusion greatly restricts the exploration of deeper coal rock [1-3]. In 1993, Kuuskraa et al. [4] preliminarily analyzed the natural gas potential of deep coal rocks in major coal-bearing basins in the United States, Canada, Australia, China, and Russia, based on the variation of permeability of coal rock with depth and the distribution of coal rock in several wells. However, no research has been conducted from the perspective of oil and gas systems or the mechanism of coal-rock reservoir and hydrocarbon accumulation, and no systematic resource estimation and favorable zone prediction has been carried out. Consequently, coal-rock gas has not attracted more attention from the industrial and academic communities. When drilling oil and gas wells, good gas show is usually found from deep coal rocks. From 1993 to 2018, gas production was tested from coal rock and sandstone. The gas production of (0.9-8.7)×104 m3/d was obtained from the Jurassic (2 500-2 828 m) in the Cainan area of the Junggar Basin and the Permian (1 800-2 481 m) in the White River Dome area of the Piceance Basin [5]. A gas production rate of 11.3×10⁴ m3/d was predicted from the Cretaceous coal seam No. 4 (3 067 m) in the Alberta Basin, Canada. A gas production rate of 1 540-7 300 m3/d was tested from multiple Jurassic wells drilled in the Cainan area of the Junggar Basin. All these results further confirmed the gas production capacity of deep coal rocks. Since 2018, based on the work of predecessors and guided by the geological theory of whole petroleum system, deep coal rock has been treated as reservoirs, and multiple risk exploration wells have been constructed after breaking through traditional understandings of coalbed methane geology. High-yield industrial gas flows brought great success. Meanwhile, the concept of coal-rock gas was proposed with the practice of exploration and development, and a geological theory and technical system of coal-rock gas was developed, promoting the efficient and rapid development of coal-rock gas reserves and production [6-8].
After systematic research and following the idea of full-process accumulation under the theory of whole petroleum system, we believe that the natural gas contained in coal-rock reservoirs can be uniformly referred to as coal-rock gas (that is, coal-rock gas in a broad sense). Based on the understanding of coal-rock gas accumulation process and the control of coal rock depth on gas reservoirs, and following the historical application habits of the previous coal-rock gas terms, the broad-sense concept of coal-rock gas is classified into two categories and four types, namely, deep coal-rock gas (primary coal-rock gas, secondary coal-rock gas) and shallow coalbed methane (residual coal-rock gas and biogenic coal-rock gas) [9]. In addition, there may be primary or secondary gas in coal rock that is shallow but well preserved, which is not covered in this study. It should be pointed out that deep coal-rock gas and shallow coalbed methane have significant differences in reservoir forming mechanisms, reservoir physical properties and development methods, among which primary coal-rock gas is the most favorable. At present, the coal-rock gas referred to in the industry means deep coal-rock gas (that is, coal-rock gas in a narrow sense). For the sake of simplification, unless otherwise specified, the coal-rock gas referred to in this paper means deep coal-rock gas, and the so-called coalbed methane refers to shallow coalbed methane.
Since the concept of coalbed methane was introduced to China in 1985, extensive research has been conducted and over ten runs of national resource evaluation have been carried out. The overall resource inventory is relatively clear, with the resource volume of (14.4-36.8)×1012 m3 [10]. As a new type of unconventional natural gas, the exploration and development of coal-rock gas has only just begun during the 14th Five-Year Plan period. With limited data, the accumulation mechanism, control factors, and development and production rules of coal-rock gas are still under early understanding. The national oil and gas resource evaluation organized and carried out by the Ministry of Natural Resources has incorporated coal-rock gas into coalbed methane for unified evaluation. Only the lower limit of the evaluation depth was expanded from the 2 000 m to 3 000 m, while the evaluation methods, technologies, resource classification and basic parameters were basically consistent with those of coalbed methane without necessary adjustments. However, judging from the fact that high gas yields have been obtained from a large number of evaluation wells drilled to below 3 000 m in recent years, the resource volume evaluated by the Ministry of Natural Resources can’t objectively represent the actual reserves underground.
Although both coal-rock gas and coalbed methane are produced from coal rock, they have significant differences. The development characteristics of coal-rock gas are similar to those of shale gas and tight gas, but they also have their own particularities. Therefore, the methods and technologies for resource evaluation and reserve assessment of coalbed methane, tight gas and shale oil and gas [11] can no longer meet the needs of coal-rock gas resource evaluation. Some scholars [12-13] introduced the theory of whole petroleum system and the reservoir formation model based on fluid dynamic field into the evaluation of oil and gas resources and carried out exploratory research. They have evaluated natural gas hydrates, coalbed methane and coal-rock gas resources, providing references for our research.
By December 2025, the cumulative proven geological reserves of coal-rock gas in China have exceeded 1.0×10¹² m3, and the output of coal-rock gas in 2025 is expected to exceed 40×108 m3, demonstrating a promising development prospect. However, the real resources of coal-rock gas are unclear, which greatly restricts the formulation of medium- and long-term plans and industrial policies by the state and enterprises. At present, major oil and gas enterprises in China have finished over 150 coal-rock gas evaluation wells in basins such as Ordos, Junggar and Sichuan, and over 750 coal-rock gas wells have been put into production in the Ordos Basin. Using the technology for measuring coal-rock gas content developed by PetroChina Key Laboratory of Coal-rock Gas, accurate data have been obtained, providing a basis for the evaluation of coal-rock gas resources. In addition, new understandings have been achieved in coal-rock gas accumulation, reservoir types, the whole petroleum system of coal measures [14], and the laws of development and production, laying a theoretical and technical foundation for the systematic evaluation of coal-rock gas resources.
Following the theory of the whole petroleum system of coal measures, and based on the geological, accumulation and development features of coal-rock gas, this paper analyzes the coal-rock gas in major basins such as Ordos, Junggar and Sichuan, utilizes the well data from pilot areas to discuss key parameters and conduct national assessment of coal-rock gas resources by using the volumetric method, volume method and analogy method, with the intent to provide a fundamental resource reference for China's energy transformation, "dual carbon" goals, the planning outline for building an energy power country, as well as the planning strategies and industrial policies.
1. Characteristics and exploration & development status of coal-rock gas
1.1. Characteristics of coal-rock gas
Coal seam may cover the entire process from hydrocarbon generation, reservoir formation, and accumulation. The organic matter in coal rock is primarily Type III kerogen, with some occurrences of Type II kerogen, predominantly generating gas with minor oil [15]. As a reservoir, coal rock is typical dual-medium reservoir with both micro-nano pores and a widespread cleat fracture system. Extensive micro-nano pores endow coal rock with an exceptional adsorption capacity, and macro-pores and cleat fractures provide effective space for free gas. The porosity, permeability and gas content of coal-rock reservoirs exhibit strongly regular variations with thermal evolution and burial depth.
Compared with coalbed methane, free gas and adsorbed gas coexist in coal-rock gas reservoirs and account for a relatively high proportion [8,16]. For instance, free gas accounts for 20% to 35% in the normal coal-rock gas reservoirs on the eastern margin of the Ordos Basin, 30% to 50% in the overpressure coal-rock gas reservoirs of the Permian Longtan Formation in the southeastern part of Chongqing, the Sichuan Basin, and up to 50% in the coal-rock gas reservoirs of the Jurassic Xishanyao Formation in the Baijiahai Uplift of the Junggar Basin. In addition to self-source and self-reservoir, coal-rock gas reservoirs may be charged by other sources. The No. 8 coal-rock gas reservoir of the Carboniferous Benxi Formation and the No. 5 coal-rock gas reservoir of the Permian Shanxi Formation in the Ordos Basin, and the coal-rock gas reservoirs of the Longtan Formation in the Sichuan Basin, are self-source and self-reservoir examples [17]. The coal-rock gas reservoir of the Jurassic Xishanyao Formation in the Baijiahai Uplift of the Junggar Basin is sourced by external source rocks.
1.2. Exploration and development status of coal-rock gas
PetroChina has already obtained large-scale coal-rock gas reserves and beneficial development in the eastern margin of the Ordos Basin. Drawing on the multi-stage fracturing concept of shale gas horizontal wells in the Sichuan Basin, the "horizontal well + volume fracturing" development technology was adopted to activate the natural fracture network and construct an "artificial gas reservoir", achieving good results in the production of coal-rock gas. In December 2021, Well JS6-7-01H drilled in the No. 8 coal-rock reservoir in the Carboniferous Benxi Formation in the eastern margin of the Ordos Basin has achieved gas production of 10×104 m3/d. Since 2022, a series of horizontal wells deployed in the eastern part of the Ordos Basin, including NL1H (3 246 m), JN1H (2 262 m), SC1 (3 200 m), and YC1HF (2 880 m), have obtained gas production from 4×10⁴ m3/d to 10×104 m3/d. Recently, PetroChina has gotten gas production from JP2H and WT1H drilled in the No. 5 coal-rock reservoir of the Permian Shanxi Formation at 5.2×10⁴ m3/d and 5.4×10⁴ m3/d, respectively. Overall, the initial gas production of the No. 8 and No. 5 coal-rock horizontal wells in the Ordos Basin is (5-10)×104 m3/d, and the cumulative gas production in the first year is (1 000-2 000)×104 m3/d. In the first three years, 60% of the estimated ultimate recovery (EUR) of a single well can be produced, and the EUR per well may be up to (4 000-6 000) × 104 m3, demonstrating a good development effect. Taking the No. 8 coal rock of the Carboniferous Benxi Formation in the Ordos Basin as a case, the cumulative three-class reserves of coal-rock gas have exceeded 2×10¹² m3, including the proven geological reserves of 9 696×108 m3. By the end of October 2025, over 900 coal-rock gas wells had been constructed in the Ordos Basin. PetroChina has obtained over 1 000×104 m3/d of coal-rock gas in the Daji Block of the Ordos Basin, and has built the first coal-rock gas field with oil equivalent at the order of one million tons.
In addition, PetroChina has also made breakthroughs in coal-rock gas exploration in some areas of the Junggar, Sichuan, Tarim, Bohai Bay, Songliao, Turpan-Hami, and Hailar basins, demonstrating enormous exploration potentials [18]. In 2024, PetroChina deployed Well NT1H in the Longtan Formation coal rock in the Suining area of the Sichuan Basin, where the reservoir depth is 4 397 m, thickness is 3.2 m, and pressure coefficient is 1.5-2.0. In August, 8.1×10⁴ m3 was tested at the casing pressure of 25.2 MPa. In addition, with the deployment of Wells XT1H and GT1 in the Bohai Bay Basin, HT1H in the Hailar Basin, FT1H in the Songliao Basin, KX1H in the Turpan-Hami Basin, YT1H in the Tarim Basin, HC3 in the western margin of the Ordos Basin and other exploration wells, the geological understanding of coal-rock gas has been further deepened.
In response to the characteristics of deep coal-rock reservoirs, the PetroChina Key Laboratory of Coal-rock Gas has developed mature experimental techniques for testing coal-rock gas content, high-temperature and high- pressure isothermal adsorption, full-scale characterization of pores and fractures, and in-situ porosity measurement. Analysis of more than 140 wells has been completed nationwide, providing first-hand information for resource evaluation. In addition, since the distribution of coal-rock gas resources is generally consistent with the range of oil and gas basins, abundant oil and gas drilling data provides strong support for improving the accuracy and credibility of coal-rock gas resource evaluation. At present, PetroChina has built the Daji Coal-rock gas Demonstration Area and six pilot test areas in the Ordos Basin, such as Mizhi, Jiaxian and Nalin. One pilot test area has been built in the Baijiahai area of the Junggar Basin, which provides a control area for the comparison of resource evaluation parameters through detailed analysis.
2. Types of coal-rock gas and resource evaluation methods
2.1. Types of coal-rock gas
Deep coal-rock gas includes primary and secondary coal-rock gas. The primary coal-rock gas is self-generated and self-stored thermogenic gas. Generally, the regional structure is gentle, the roof and floor have strong sealing ability, the hydrodynamic environment is weak, and the preservation conditions are good. Secondary coal-rock gas, in addition to self-sourced gas, also includes natural gas generated from hydrocarbon source rocks in the lower part of the structure. The self-sourced gas and other source gases complement each other and are distributed in an orderly manner. They migrate along faults and layers, and are enriched in sweet spots in fractures and pores [7,19 -20]. Taking coal-rock gas fields such as Daji and Mengshan in the Ordos Basin as examples [21], the No. 8 coal-rock reservoir of the Benxi Formation has high temperature and pressure, mainly composed of medium- and high-rank coal, with a vitrinite reflectance (Ro) of 1.5%-3.0%, porosity of 2%-8%, and permeability of (0.01- 0.10)×10-3 μm. The burial depth is 2 000-3 500 m, and the proportion of free gas is 20%-35%. After large-scale transformation of coal-rock reservoirs, gas can be seen as soon as the well is opened. In the early stage, free gas is rapidly produced and the production decreases rapidly. In the middle and later stages, adsorbed gas is produced in large volumes and the stable production period is long. The example of secondary coal-rock gas is Jurassic coal- rock gas reservoir in the Baijiahai uplift of the Junggar Basin. The Ro of coal rock is 0.47%-1.05%, the porosity is 5%-12%, the permeability is (0.01-20.00)×10-3 μm, and the burial depth is 2 000-2 800 m. It has the characteristics of high proportion of free gas, high gas saturation, and hydrocarbon supply from other sources. Vertical wells can quickly produce gas without the need for drainage and pressure reduction. The initial gas production is high, and the gas is produced by blowing with a certain stable production period, similar to conventional gas reservoirs.
2.2. Evaluation method for coal-rock gas resources
There are significant differences in the occurrences of different types of natural gas, so different resource evaluation methods are applicable (Table 1). Coal-rock gas, as a new type of unconventional natural gas resource, has significant differences from traditional coalbed methane. It is not appropriate to simply copy the resource evaluation methods of coalbed methane; appropriate evaluation methods should be selected according to the characteristics of coal-rock gas.
Table 1. Types of natural gas reservoirs and resource evaluation methods |
| Type | Reservoir characteristics | Resource evaluation methods | ||||||
|---|---|---|---|---|---|---|---|---|
| Reservoir | Occurrences | Accumulation characteristics | Mechanic mechanism | Volumetric method (Free gas) | Volume method (Adsorbed gas) | Analogy | Specification | |
| Conventional natural gas | Clastic rock, carbonate rock, special lithology | Inorganic pores and fractures as reservoir space; porosity 10%-30%, permeability (1-100)×10-3 μm2; weak reservoir self-sealing ability; free gas | Far source | Buoyancy (free fluid dynamic field) | $\frac{0.01 A H \phi S_{\mathrm{g}}}{B_{\mathrm{g}}}$ | Applicable | Classifications for Petroleum Mineral Resources and Reserves: GB/T 19492-2020 [22] | |
| Tight gas | Tight sandstone | Predominant macroscopic pores, pore throat ranging from 0.1 to 1.0 μm; free gas; complex gas-water relationship, not strictly dependent on structural control, typically characterized by gas-water inversion | Near source | Self-sealing resistance (confined fluid dynamic field) | $\frac{0.01 A H \phi S_{\mathrm{g}}}{B_{\mathrm{g}}}$ | Applicable | Geological Evaluation Methods for Tight Sandstone Gas: GB/T 30501-2022 [23] | |
| Shale gas | Shale | Predominant microscopic pores, pores ranging from 150 to 400 nm; free gas accounting for 50% to 80%; local overpressure reservoirs; a maximum pressure coefficient exceeding 2.0 | Self-soured and self-stored | Adsorption force (bound fluid dynamic field)+ self-sealing resistance (confined fluid dynamic field) | $\frac{0.01 A H \phi S_{\mathrm{g}}}{B_{\mathrm{g}}}$ | $0.01 A H \rho_{\mathrm{c}} C_{\mathrm{A}}$ | Applicable | The Evaluation Technical Specification for Shale Gas Resources: NB/T 14007-2015 [24], Regulation of Shale Gas Resources/ Reserves Estimation: DZ/T 0254-2014 [25] |
| Coal-rock gas | Coal rock | Free gas in macroscopic pores and fractures, but different proportions in different gas reservoirs (20% to 50%); 100% adsorbed gas saturation; locally overpressure reservoirs, with a pressure coefficient of up to 1.5 | Self-soured and self-stored, with possible external sources | Adsorption force (bound fluid dynamic field) + self-sealing (confined fluid dynamic field) | $\frac{0.01 A H \phi S_{\mathrm{g}}}{B_{\mathrm{g}}}$ | $0.01 A H \rho_{\mathrm{c}} C_{\mathrm{A}}$ | Applicable | Approved for development, launch pending |
| Coal-rock gas | Coal rock | Formation water in macroscopic pores and fractures; adsorbed gas accounting for nearly 100%; extremely low or no free gas; adsorbed gas saturation generally less than 100%; normal pressure and underpressure reservoirs, with pressure coefficient usually less than 1.0 | Predominantly self-sourced and self-stored residual gas reservoir | Adsorption force (confined fluid dynamic field) | $0.01 A H \rho_{\mathrm{c}} C_{\mathrm{A}}$ | Applicable | Assessment Specification of Coalbed Methane Resources: DZ/T 0378-2021[26] | |
2.2.1. Volume method
Coalbed methane is almost entirely adsorbed gas, so the volumetric method is usually used to estimate the geological resources/reserves. For coal-rock gas with both free gas and adsorbed gas coexisting, the total gas content is obtained by testing the gas content in pressure-held cores, and then the contents of adsorbed gas and free gas are calculated theoretically. The formula for estimating resource volume using the volumetric method is:
$G=G_{\mathrm{A}}+G_{\mathrm{F}}=0.01 A H \rho_{\mathrm{c}}\left(C_{\mathrm{A}}+C_{\mathrm{F}}\right)$
2.2.2. Volumetric method
The free gas within coal-rock reservoirs is estimated based on parameters such as area, effective thickness, porosity, and gas saturation. The free part of secondary coal-rock gas with external sources must be calculated using the volumetric method, while the primary coal-rock gas can be done using the volumetric method and the volume method. The formula for estimating coal-rock gas resources using the volumetric method is:
$G=G_{\mathrm{A}}+G_{\mathrm{F}}=0.01 A H \rho_{\mathrm{c}} C_{\mathrm{A}}+\frac{0.01 A H \phi S_{\mathrm{g}}}{B_{\mathrm{g}}}$
2.2.3. Analogy method
The analogy method studies the similarity between the reservoir formation conditions of the evaluation area with insufficient data and the control area, in order to obtain unknown evaluation parameters such as gas content and recovery, and estimate the geological resources in the evaluation area [27]. In this study, the Daji Coal Gas Demonstration Area in the Ordos Basin, six pilot test areas including Mizhi, Jiaxian and Nalin, and the pilot test area in the Baijiahai area of the Junggar Basin are used as control areas for analogy. Based on the similarity of the reservoir geological conditions between the evaluation area and the control area, gas content and other evaluation parameters are determined following the resource grading evaluation index.
2.3. Limits of resource evaluation indicators
2.3.1. Upper limit and selection method of critical depth
According to the "three-field-controlling accumulation" mechanism of coal-rock gas, in the same set of continuously distributed coa-rock reservoirs, due to differences in burial depth, there exists a transitional depth between a confined fluid dynamic field dominated by capillary pressure and a free fluid dynamic field, also known as the critical depth, which is the boundary of primary coal-rock gas. The boundary expansion force reaches equilibrium with the capillary pressure of groundwater and static water pressure, and the limited fluid dynamic field and the free fluid dynamic field are intertwined. The gas-water relationship is complex, and free gas emerges from nothing. The top depth of the transition zone as the upper limit is used for the evaluation of coal-rock gas resources. The higher the degree of coalification, and the smaller the pore size/crack opening, the stronger the retention capacity of coal-rock reservoirs for natural gas, and the shallower the critical depth is. According to the test data of coal-rock gas content, the well depth from which free gas is found is the critical depth. For wells with a high proportion of free gas, the critical depth for evaluating primary coal-rock gas is inferred by establishing the relationship between free gas and burial depth (Fig. 1a). To determine the upper limit of evaluation depth for different basins and regions, the depth and Ro relationship of the major basins are established (Fig. 1b), and the basins and regions are classified into different types. As can be seen from Fig. 1b, with the increase of Ro, the critical depth of coal-rock gas gradually becomes shallow, about 2 500 m in the Junggar Basin and the Tarim Basin, and decreases to about 1 500 m in the Songliao Basin and the Qinshui Basin. The critical depth is influenced by multiple factors. In addition to Ro, it is affected by factors such as geothermal flow and later stimulation. The selection of critical depth in different basins and regions requires comprehensive consideration of multiple factors.
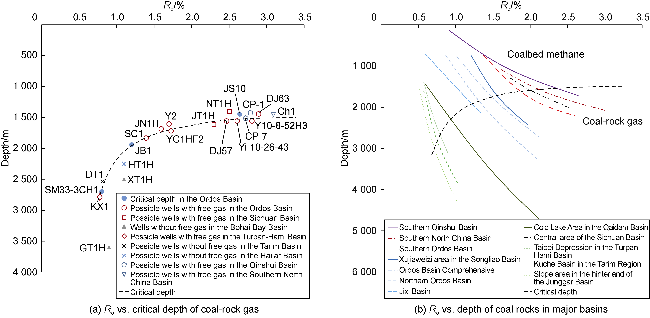
Fig. 1. Analysis of critical depth of coal-rock gas in major oil and gas basins. |
2.3.2. Depth range and lower limit of effective thickness
For the convenience of calculation, the starting depth of resource evaluation for coal-rock gas resources in the Junggar, Tarim, and Turpan Hami basins in the northwest region is determined to be 2 500 m, that for the northern Ordos Basin, Bohai Bay Basin, and Qaidam Basin in the northwest region is 2 000 m, and that for the southern Ordos Basin, Songliao Basin, and Qinshui Basin in the north region is 1 500 m (Fig. 1b). Due to the abundant data in the Ordos Basin, there is a significant difference in the thermal evolution degree of coal-rock reservoirs in the northern and southern parts of the basin, and the critical depth of coal-rock gas differs significantly between north and south, so the values are calculated separately. In addition, due to the low exploration level of some basins and limited data on the burial depth of coal-rock reservoirs and Ro, there may be limitations in the value of the starting depth for resource evaluation. For secondary coal-rock gas reservoirs, calculations are mainly based on actual traps and are not limited by the initial evaluation depth. In coal-rock gas reservoirs with good preservation conditions and mainly composed of lithological traps, the burial depth of primary coal-rock gas reservoirs can also be relatively shallow.
The maximum depth limit for evaluating coal-rock gas resources is mainly calculated and selected based on the feasibility of current coal-rock gas development technology and actual drilling results. At present, coal-rock gas is still in their infancy, with mining depths mainly ranging from 1 500 m to 4 500 m. However, exploration depths are gradually deepening, and there are good development prospects for both. Meanwhile, considering that the current main technology for coal-rock gas development is similar to shale gas, this article refers to the shale gas extraction data in the southern Sichuan region. For example, Sinopec drilled Well TBHF in the Sichuan Basin in 2025, with reservoirs burial depth of 5 300 m, a horizontal section of 1 312 m, and a 100% high-quality shale drill-in rate, achieving the tested production of 31.45×10⁴ m3/d. In addition, considering the development of the "horizontal well + volume fracturing" technology, the maximum depth limit for coal-rock gas resource evaluation is appropriately extended based on the maximum depth of shale gas high-yield layers in southern Sichuan, with a lower limit depth of 6 000 m selected. Considering that the minimum thickness of shale gas horizontal well drilling engineering technology in southern Sichuan is about 1 m, coal-rock gas and shale gas development technologies are relatively similar. At the same time, referring to the thickness standard for coal-rock gas reservoirs, the lower limit of the effective coal-rock reservoir thickness for this coal-rock gas resource evaluation is determined to be 1 m.
2.3.3. Lower limit of gas content in coal rock
Gas content is one of the controlling factors affecting the production of coal-rock gas and the most important parameter for the evaluation of coal-rock gas resources. The coal-rock gas content, which means extremely poor gas production or ones that cannot be effectively developed using the applicable technology, serves as the lower limit for this resource evaluation. Based on the experimental data of coal reservoir, near the inflection point of the second jump of coalification (Ro=1.2%), there are transition changes in gas generation and pore fracture evolution of coal reservoir. So, Ro=1.2% is treated as the boundary and lower limit between low- to middle-rank and middle- to high-rank coal rock. According to the length of horizontal section being 1 000 m and well spacing being 400 m, the permeability of low- to middle-rank coal rock being 0.1×10⁻³ μm, and the permeability of middle- to high-rank coal rock 0.01×10⁻³ μm, the numerical simulation results show that the average daily gas production of a well gradually increases with the increase of gas content and thickness in the first year (Fig. 2). The better the permeability of coal-rock reservoirs, the easier it is to produce coal-rock gas, and the lower the lower limit of gas content for evaluating coal-rock gas resources. Wells A, B, and C have gas contents of 21.5, 22.0, and 25.0 m3/t, coal-rock reservoir thicknesses of 7.0, 7.8, and 5.5 m, and horizontal section lengths of 1 569, 1 459, 1 505 m, respectively. Their average daily production in the first year is 5.3×10⁴, 6.3×10⁴ and 5.7×10⁴ m3, respectively. When converted to a horizontal section length of 1 000 m, the average daily production in the first year is 3.5×10⁴, 4.2×10⁴ and 3.8×10⁴ m3, respectively (Fig. 2b), which is consistent with the overall numerical simulation results.
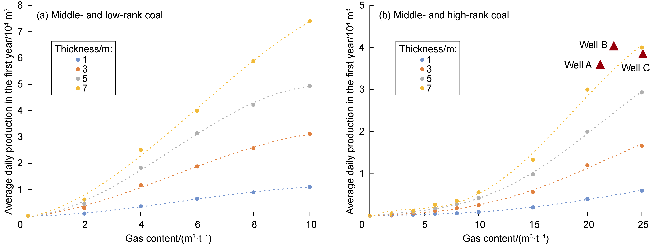
Fig. 2. Average daily gas production vs. gas content in the first year, measured for a 1000 m-horizontal-section coal-rock gas well. |
According to Fig. 2, when the thickness of the coal-rock reservoir with a gas content of 2 m3/t is 1, 3, 5, and 7 m, the corresponding average daily production of a 1 000 m horizontal-section well is 0.09×10⁴, 0.30×10⁴, 0.46×10⁴, 0.62×10⁴ m in the first year. When the thickness of the coal-rock reservoir with a gas content of 10 m3/t is 1, 3, 5 and 7 m, the corresponding average daily production is 0.09×10⁴, 0.25×10⁴, 0.43×10⁴ and 0.56×10⁴ m3, respectively. Considering the operability of coal-rock gas resource evaluation, the well with average daily gas production less than 0.1×10⁴ m3 in the first year is considered no resource development value, and the corresponding gas content is the lower limit for evaluation, so the lower limit for middle-and low-rank coal-rock gas resources (Ro<1.2%) is 2 m3/t, and 10 m3/t for middle- and high-rank coal-rock gas resources (Ro≥1.2%). Due to limitations in experimental and testing techniques, 2.5 cm-diameter samples are insufficient for characterizing large-scale cleat fractures, and there are certain limitations in testing coal rock permeability. In addition, most coal-rock gas evaluation wells are mainly in the Ordos Basin, and the representativeness of the data also has certain limitations. Considering that the development of coal-rock gas is just beginning, for the sake of conservatism, this article selects a high value of 10 m/t as the lower limit of gas content through numerical simulation.
2.3.4. Lower limit of coal rock porosity
There are various lithologies in coal measures, commonly including siltstone, sandstone, and carbonaceous shale. The carbonaceous shale in coal seams also has certain storage capacity and can produce gas through sufficient transformation. This article evaluates the coal rock and carbonaceous shale in coal rock layers as effective coal-rock reservoirs as a whole. The correlation between porosity and density of coal-rock reservoirs is strong. When the porosity of coal rock is low to a certain extent, coal rock cannot be taken as a reservoir. Through statistical analysis of the porosity and reservoir density of 517 coal-rock reservoirs in major coal-bearing basins across the country, the samples with porosity less than 2% are mainly the roof and floor shale of coal rocks, which do not belong to effective coal-rock reservoirs (Fig. 3). Therefore, the lower limit of porosity for coal-rock reservoirs in this resource evaluation is set at 2%, considering the lower limit of gas content in coal rock for comprehensive judgment.
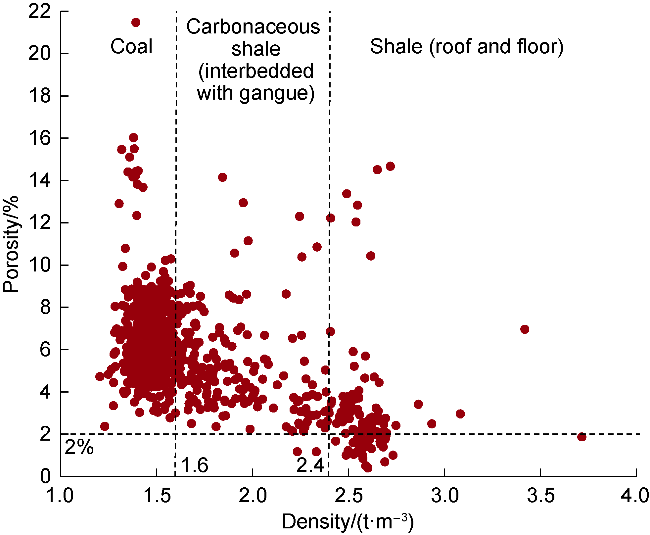
Fig. 3. Relationship between porosity and density of coal-rock reservoir. |
2.4. Key technical parameters
2.4.1. Calculation unit
Calculation unit division of coal-rock gas resources is carried out based on factors such as lower limits, source-reservoir relationship, structure and preservation conditions. Horizontally, the structural units, coal-rock reservoirs, and key resource parameters are considered, and macroscopic structural boundary and the boundary of the coal-rock reservoir are combined. To keep uniform in the unit, the thickness per coal rock layer is not greater than 3 m, the gas content not higher than 5 m3/t, the coal rank should be similar, and the roof and floor should be consistent. Vertical division focuses on the differences in vertical depth and geological characteristics. Based on the initial evaluation depth, unit splitting is achieved by combining the layering and correlation of vertical parameters. Major reservoirs are evaluated separately, and non-major reservoirs are evaluated in combination. According to the thermal evolution degree of coal-rock reservoirs in different basins, the vertical starting depth is 1 500, 2 000 and 2 500 m, respectively, which serves as the marker for vertical division. The thickness of the coal-rock reservoir within the same calculation unit is stable, the coal quality is uniform, and the gas storage conditions on the top and bottom plates are similar.
2.4.2. Coal-rock gas content
2.4.2.1. Pressure-preserved coring and logging interpretation model
The gas content of coal is a key parameter for evaluating resource quantity using the volumetric method, and can be obtained through two experimental methods: wireline coring and pressure-preserved coring. Compared with shallow coalbed methane, the burial depth of coal-rock gas is relatively deep. When the wireline coring method is used to obtain gas content, the traditional wireline coring method increases the estimation error of gas loss due to the longer lifting time. The pressure-preserved coring method involves directly sealing the core in a pressure cylinder after cores are taken underground, and then conducting corresponding tests on the ground. The total gas content is obtained by measuring the gas volume inside the pressure cylinder, calculating the surface lost gas volume using room-temperature desorption method, obtaining desorption gas volume through reservoir-temperature desorption, and obtaining residual gas volume through high-temperature desorption. The sum of these four parts is the total gas content [28]. The pressure-preserved coring method can approximately assume that there is no gas loss during the drilling process, and the test results are reliable. Combining the gas content from the pressure-preserved coring method with well logging curves is a reliable method. Taking the Benxi Formation coal rock in the Jianan block of the Ordos Basin as an example, a prediction model for coal-rock gas content is established (Eq. (3)) based on the gas content from the pressure-preserved coring method and logging parameters. There are certain differences in the parameters of prediction models in different blocks. By using 122 data points from 11 typical wells in different blocks of the Ordos Basin for verification, the correlation coefficient between logging interpretation and measured gas contents exceeds 0.9 (Fig. 4a), confirming the reliability and applicability of this method.
$Q_{\mathrm{t}}=0.019 \Delta t-6.001 \rho-0.014 G R+4.521 \lg R_{1 \mathrm{dd}}+3.736$
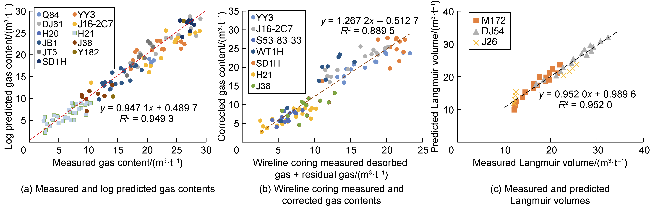
Fig. 4. Gas content measured by different methods and Langmuir volumes (VL). |
2.4.2.2. Correction of wireline coring gas content
Due to the high cost of pressure-preserved coring and gas content testing, a large number of evaluation wells still use wireline coring for gas content testing. Based on the gas content testing results of 95 adjacent wells in the same layer using pressure-preserved coring and wireline coring, a calibration model for wireline coring gas content was established (Fig. 4b, Eq. (4)). The test results showed that the absolute error between the predicted results of pressure-preserved coring and the calibration results of wireline coring was 0.22-2.26 m3/t, with an average value of 1.40 m3/t. After model calibration, the gas content was basically equivalent to the gas content results of pressure-preserved coring testing.
$C_{1}=1.2672 C_{0}-0.5127$
2.4.2.3. Calculation of adsorbed gas and free gas content
The adsorbed gas content is a key parameter for evaluating the amount of adsorbed gas resources using the volumetric method, mainly characterized by isothermal adsorption parameters. A large amount of test data shows that the Langmuir isotherm adsorption equation has good applicability to coal rock adsorption experimental curves. Langmuir volume (VL) and Langmuir pressure (pL) are the main parameters of the Langmuir isotherm adsorption equation (Eq. (5)), where VL represents the ultimate adsorption capacity of coal rock, mainly influenced by factors such as coal quality (ash content), water content, and thermal evolution degree, obtained through linear regression (Eq. (5), Fig. 4c); pL represents the equilibrium pressure at which half of the ultimate adsorption capacity is reached, and an empirical formula is obtained through data fitting (Eq. (5)). Adsorbed gas and free gas coexist in coal-rock gas. Under in-situ geological conditions, adsorbed gas is in a saturated adsorption state. The adsorption capacity under the original geological temperature and pressure conditions is the gas content of the adsorbed gas (Eq. (5)). By analyzing the temperature, pressure, ash content, and moisture content of coal-rock reservoirs, the in-situ adsorbed gas content of coal rock can be inferred. The specific formula is:
$C_{\mathrm{A}}=\frac{p V_{\mathrm{L}}}{p+p_{\mathrm{L}}}$
where
$\begin{array}{c} V_{\mathrm{L}}=4.62 R_{\mathrm{o}}-0.49(M+B)-0.12 t+26.17 \\ p_{\mathrm{L}}=1.2020 \ln V_{\mathrm{L}}+5.8705 \end{array}$
Because of the presence of free gas, the adsorbed gas in coal reservoirs is in a saturated adsorption state. Therefore, the free gas content can be obtained by subtracting the saturated adsorption amount calculated above from the total gas content.
2.4.3. Porosity
Porosity is a key parameter for evaluating resource quantity using the volumetric method, which is mainly controlled by factors such as coalification, coal quality, and burial compaction. According to the Boyle's law, the helium gas method can accurately determine the surface porosity of coal rock, low pressure CO2 adsorption experiments are used to characterize the pore size range of 0.3-1.5 nm, low-temperature liquid nitrogen adsorption experiments for the pore size range of 1.5-50.0 nm, high-pressure mercury intrusion experiments for the pore size range of 50 nm-10 μm, and micro-CT scanning technology for microcracks (including cleats) larger than 10 mm. The results of the four methods are combined to obtain the distribution characteristics of pores and fractures in coal rock. Based on logging data, the correlation between surface porosity and natural gamma ray, acoustic travel time, neutron porosity, density, and other logging parameters is analyzed. Logging interpretation models are established for coal surface porosity in different regions. The relationship between measured and interpreted results is shown in Fig. 5a. When there is a lack of logging data, experimental results such as surface porosity, coal rock density, and thermal evolution degree of coal-rock reservoirs can be combined. Based on the positive correlation between coal-rock reservoir porosity and Ro, and the negative correlation with burial depth and density, a prediction model for coal-rock reservoir surface porosity can be established through multiple regressions (Eq. (6)). The relationship between calculated and measured surface porosity is shown in Fig. 5b. In order to reflect the porosity of coal-rock reservoirs under original geological conditions, experimental tests were conducted on the overburden porosity of reservoirs under different effective stress conditions. The results show that the normalized in-situ porosity decreases with increasing effective stress, but the decrease tends to be weaker than the traditional exponential law (Fig. 5c). In addition, under a constant effective stress, the higher the gas pressure, the larger the normalized in-situ porosity, indicating that gas pressure has a significant supporting and maintaining effect on the in-situ pore space. By coupling formation pressure and effective stress, a normalized in-situ porosity prediction model was established (Eq. (7)). When calculating coal-rock gas resources, in-situ porosity should be used.
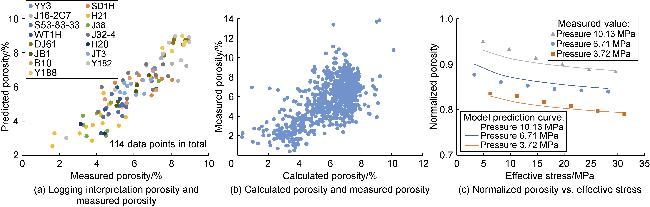
Fig. 5. Comparison of porosity calculated by different methods. |
$\phi_{0}=14.1909-0.0012 D+0.1429 R_{\mathrm{o}}-3.0061 \rho$
$\phi=0.03852 \phi_{0}\left(1+p^{0.18360}\right) \sigma_{\mathrm{e}}^{-0.02900}$
2.4.4. Technically recoverable coefficient
The technically recoverable coefficient refers to the proportion of geological resources converted into technically recoverable resources, and it is a key parameter for scientifically evaluating the recoverable resources of coal-rock gas. Different technically recoverable coefficients should be adopted for different resource types. The primary pays in the No. 8 coal-rock gas zone and pilot test zone in the Benxi Formation of the Ordos Basin are located in Class I resources, and effective development has been achieved by using the "horizontal well + volume fracturing" technology. The length of the horizontal section of the horizontal well is 1 300-1 500 m, the well spacing is 300-400 m, the fracturing fluid volume per well is 30 000-50 000 m, the sand volume is 5 000-6 000 m, the EUR per well is (3 800-6 800) ×104 m3 with the average of 5 493×104 m3 (4 220×104 m3 per kilometer).
According to the reservoir parameters of Class I resources (8 m thick, and gas content of 20 m3/t), using applicable development technology, and considering production and numerical simulation methods, the predicted technically recoverable coefficient is 0.5 (Fig. 6a). For Class II resources (5 m thick, 16 m3/t), the predicted technically recoverable coefficient is 0.4 under the same technical conditions (Fig. 6b). Considering that the exploration and development of coal-rock gas is still in the early stage, and the pays are Class I resources, only several experimental wells in Class II resource areas and no reference data in Class III resource areas. The technically recoverable coefficient is taken 0.5 for Class I resources, 0.4 for Class II resources. The Class III resources are not included in this study.
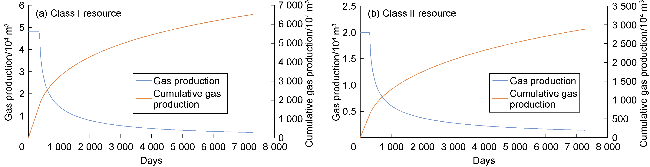
Fig. 6. Typical production curves of coal-rock gas horizontal wells in the Ordos Basin. |
2.5. Classification and evaluation methods for coal-rock gas geological resources
Based on the current understanding of the factors affecting the enrichment and development effectiveness of coal-rock gas resources, combined with the impact of different parameters on the productivity of coal-rock gas wells, classification and evaluation method and parameter system are established for coal-rock gas resources. Resource classification and evaluation parameters are shown in Table 2.
Table 2. Evaluation parameters and values of coal-rock gas resources (revised from Reference [7]) |
| Parameter | Weight | Class | Score | Evaluation criteria | |
|---|---|---|---|---|---|
| Ro<1.2%, middle- and low-rank coal-rock gas | Ro≥1.2%, middle- and high-rank coal | ||||
| Thickness | 0.25 | I | 10 | Single layer greater than 8 m or cumulative greater than 15 m | Single layer greater than 5 m or cumulative greater than 7 m |
| II | 6 | Single layer 5-8 m or cumulative 10-15 m | Single layer 3-5 m or cumulative greater than 5 m | ||
| III | 3 | Single layer less than 5 m or cumulative less than 10 m | Single layer less than 3 m or cumulative less than 5 m | ||
| Gas content | 0.30 | I | 10 | Greater than 12 m3/t | Greater than 18 m3/t |
| II | 6 | 8-12 m3/t | 14-18 m3/t | ||
| III | 3 | Less than 8 m3/t | Less than 14 m3/t | ||
| Structural condition | 0.15 | I | 10 | Simple structure with well-developed cleat fractures | |
| II | 6 | Relatively complex structure with moderately developed cleat fractures | |||
| III | 3 | Complex structure | |||
| Coal mass structure | 0.15 | I | 10 | Stable coal seams, dominated by primary coal | |
| II | 6 | Relatively stable coal seams, dominated by cataclastic coal | |||
| III | 3 | Unstable coal seams, dominated by mylonitic coal | |||
| Depth | 0.15 | I | 10 | <3 500 m | <3000 m |
| II | 6 | 3500-4 500 m | 3 000-4 000 m | ||
| III | 3 | >4 500 m | >4 000 m | ||
Based on parameters such as coal-rock reservoir thickness and gas content, the enrichment of coal-rock gas resources can be classified and evaluated. Taking the Ordos Basin as an example, two types of coal-rock gas are classified: medium- and high-rank coal-rock gas and medium- and low-rank coal-rock gas, by analyzing the development and trial production wells (400 m well spacing, and 1 500 m horizontal section) in Daji, Mengshan, Jiaxian, and Yichuan areas. (1) The coal-rock gas with Ro≥1.2% can be further divided into three grades: Class I, a coal-rock reservoir layer thicker than 5 m, and gas content greater than 18 m3/t; Class II, 3-5 m and 14-18 m3/t; Class III, less than 3m and less than 14 m3/t, not economically using applicable development technology. (2) Low- to medium-rank coal-rock gas with Ro<1.2%. Without available data, the coal-rock reservoir thickness and gas content are estimated through numerical simulation.
Based on parameters such as coal mass structure and burial depth, the difficulties in drilling, completing and stimulating coal-rock gas horizontal well are evaluated. It’s found that the stable primary coal structure has better mechanical properties, so the wellbore stability is good and it is easy for volume fracturing. Cataclastic coal with relatively stable structure is the second. Drilling and fracturing unstable mylonitic coal are very difficult. The burial depth mainly reflects the cost of drilling, completion, and fracturing operations. The structural indicator controls both the enrichment of coal-rock gas and the difficulty of development, and can be evaluated through geological experience.
Our evaluation is based on two types of coal-rock gas: Ro<1.2%, namely low- to medium-rank coal-rock gas, and Ro≥1.2% (i.e., the medium- to high-rank) [12]. Different parameters updated by different weights are used to calculate the geological resources using Eq. (8). The final results are rounded to the nearest whole number. The weights and scores of the parameters are shown in Table 2.
$I=0.25 S_{\mathrm{H}}+0.30 S_{\mathrm{C}}+0.15 S_{\mathrm{T}}+0.15 S_{\mathrm{S}}+0.15 S_{\mathrm{D}}$
3. Evaluation results and favorable areas of coal-rock gas resources
3.1. Evaluation methods and results
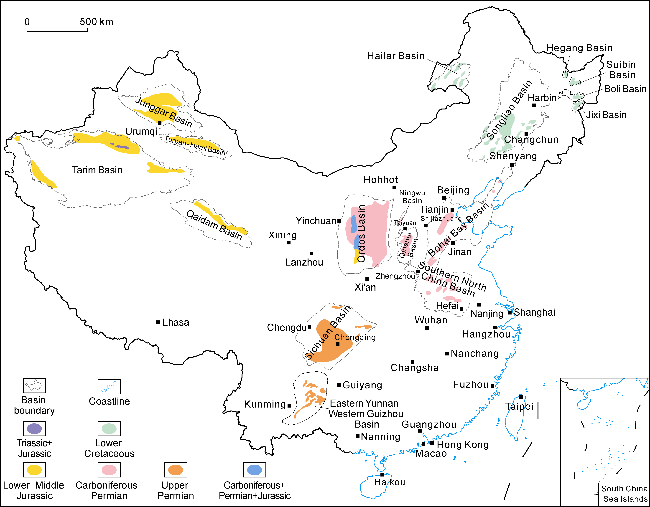
Coal-rock reservoirs are widely distributed in China, mainly including five coal bearing regions: North China, Northwest China, Northeast China, South China, and Qinghai-Tibet Plateau. The coal-bearing basins in these regions are basically overlapped with the main petroliferous basins. From the perspective of distribution layer and scale, it mainly includes the Middle-Lower Jurassic, Carboniferous, Permian, followed by the Lower Cretaceous and Cenozoic Tertiary, with sporadic distribution in the Triassic [29-33]. According to the understanding of the laws of coal-rock gas accumulation, coal-rock gas reservoirs with deeper burial depth, stable structure, and better preservation conditions are advantageous. Exploration and development practices have shown that the well-developed coal-rock reservoirs in the Carboniferous, Permian, Jurassic, and Cretaceous strata in petroliferous basins such as Ordos, Sichuan, Junggar, Tarim, Bohai Bay, and Qaidam are favorable targets for coal-rock gas exploration. In addition, areas with better preservation conditions for local structures such as the Southern Huabei Basin, Ningwu Basin, Sanjiang Basin Group (including basins of Hegang, Suibin, Boli and Jixi etc.), and the Eastern Yunnan-western Guizhou region are inferred to have enrichment of coal-rock gas. This coal-rock gas resource evaluation mainly focuses on the main coal-bearing basins on land, excluding the areas offshore China and the Qinghai-Tibet region. Coal rock buried depths in areas such as the Datong Basin and the Hexi Corridor are shallower, while coal rock buried depths in the Erlian Basin is shallow with a low degree of thermal evolution, which has been proven to be typical coal-rock gas by development practice. Coal rock development in the Santanghu Basin has been confirmed, but recent exploration practices such as the Wells Yixin 1 and Yimeike 1 have shown that coal-rock gas content is poor. These basins/areas have not yet been included in the scope of this evaluation. In addition, Carboniferous coal rocks are developed in Qaidam Basin and the Junggar Basin, but they are not included in the evaluation scope due to the limitation of current data and geological knowledge. On this basis, 14 favorable coal-bearing basins and regions on land in China were preliminarily selected for coal-rock gas resource evaluation, including the Carboniferous and Permian in the Ordos, Bohai Bay, Qinshui and other basins in North China, the Jurassic in the Junggar, Tarim, Qaidam, Turpan-Hami, and other basins in Northwest China, the Cretaceous in the Songliao, Hailar and Sanjiang basins in Northeast China, and the Permian in the Sichuan Basin and eastern Yunnan-western Guizhou in South China (Fig. 7, Table 3).
Fig. 7. Distribution of coal-rock gas resources in the major coal-bearing basins in onshore China. |
Table 3. Summary of coal-rock gas resource evaluation results in the major coal-bearing basins on land in China |
| Region | No. | Basin | Coal rock horizon | Sedimentary environment | Depth/ m | Area/ 104 km2 | Single layer thickness/ m | Cumulative thickness/ m | Gas content/ (m3·t-1) | Ro/ % | In-situ resources/ 108 m3 | Technically recoverable resources/ 108 m3 | Class I resources/ 108 m3 | Class II resources/ 108 m3 | Class III resources/ 108 m3 |
|---|---|---|---|---|---|---|---|---|---|---|---|---|---|---|---|
| North China | 1 | Ordos | C, P | South basin: coastal-shallow lake, lagoon, coastal swamp, tidal flat | 1 500-6 000 | 18.00 | 1-12 | 5-35 | 12-25 | 1.2-3.0 | 263 664 | 61 476 | 57 416 | 81 920 | 124 327 |
| North basin: delta plain, swamp | 2 000-6 000 | 3.80 | 1-20 | 5-40 | 10-15 | 0.7-1.2 | 39 398 | 9 133 | 6 302 | 14 955 | 18 141 | ||||
| J | Coastal lake swamp, alluvial swamp | 2 500-3 000 | 0.20 | 1-5 | 10-30 | 4-12 | 0.6-0.8 | 1 792 | 422 | 301 | 678 | 813 | |||
| Subtotal of Ordos Basin | 304 854 | 71 031 | 64 019 | 97553 | 143 281 | ||||||||||
| 2 | Qinshui | C, P | Marine delta, tidal flat, delta plain, river, swamp | 1 500-3 000 | 0.95 | 1-8 | 5-20 | 8-30 | 1.5-3.0 | 11 859 | 3 261 | 3 319 | 4 003 | 4 536 | |
| 3 | Bohai Bay | C, P | Shallow lake, delta plain, swamp | 2 000-6 000 | 2.10 | 1-10 | 5-30 | 4-12 | 0.5-1.5 | 24 696 | 6 446 | 6 819 | 7 592 | 10 285 | |
| 4 | Ningwu | C, P | Coastal plain, delta plain, river swamp | 1 500-2 500 | 0.18 | 1-10 | 5-25 | 6-14 | 1.2-2.5 | 1 853 | 508 | 523 | 615 | 715 | |
| 5 | Southern North China | C, P | Shallow lake, delta swamp | 2 000-3 000 | 0.90 | 1-11 | 1-20 | 14-40 | 2.0-4.0 | 9 387 | 2 249 | 2 276 | 2 776 | 4 334 | |
| Subtotal of North China | 352 649 | 83 494 | 76 957 | 112 540 | 163 153 | ||||||||||
| Northwest China | 6 | Tarim | T1, J1-2 | River marsh, delta swamp | 2 500-6 000 | 3.80 | 1-22 | 6-55 | 2-13 | 0.8-1.3 | 47 523 | 5 664 | 3 209 | 10 150 | 34 164 |
| 7 | Junggar | J1, J2 | River, lake, delta swamp | 2 500-6 000 | 2.70 | 5-30 | 10-80 | 4-18 | 0.4-1.4 | 34 092 | 8 984 | 8 622 | 11 683 | 13 788 | |
| 8 | Turpan-Hami | J1, J2 | River, lake, delta swamp | 2 500-5 000 | 1.90 | 2-15 | 8-80 | 5-20 | 0.5-1.7 | 21 095 | 4 019 | 2 890 | 6 434 | 11 771 | |
| 9 | Qaidam | J1, J2 | Delta plain, lake, swamp | 2 000-6 000 | 1.90 | 1-6 | 5-20 | 6-15 | 0.7-1.4 | 23 565 | 4 706 | 2 506 | 8 633 | 12 426 | |
| Subtotal of Northwest China | 126 275 | 23 373 | 17 226 | 36 900 | 72 149 | ||||||||||
| South China | 10 | Sichuan | P | Marsh | 1 500-6 000 | 5.00 | 1-6 | 2-20 | 15-25 | 1.5-3.5 | 54 174 | 21 548 | 22 657 | 25 549 | 5 967 |
| 11 | Southern Yunnan- Western Guizhou | P | Marsh | 1 500-2 000 | 0.25 | 1-2 | 2-20 | 10-20 | 1.5-3.5 | 2 825 | 555 | 450 | 826 | 1 550 | |
| Subtotal of South China | 56 999 | 22 103 | 23 107 | 26 375 | 7517 | ||||||||||
| Northeast China | 12 | Songliao | K1 | Continental swamp | 1 500-6 000 | 0.70 | 1-5 | 3-15 | 10-20 | 1.5-2.9 | 8 826 | 1 668 | 1 380 | 2 446 | 5 000 |
| 13 | Hailar | K1 | Delta plain, swamp | 2 000-3 000 | 0.50 | 5-30 | 20-50 | 4-9 | 0.5-1.2 | 5 276 | 1 377 | 1 200 | 1 943 | 2 133 | |
| 14 | Sanjiang Basin Group | K1 | Continental swamp | 2 000-3 000 | 0.10 | 6-25 | 10-40 | 8-20 | 0.9-1.5 | 1 093 | 264 | 240 | 360 | 493 | |
| Subtotal of Northeast China | 15 195 | 3 309 | 2 820 | 4 749 | 7 627 | ||||||||||
| Total | 551 118 | 132 280 | 120 110 | 180 563 | 250 445 | ||||||||||
Note: Technically recoverable Class III resources have not been evaluated; C: Carboniferous; P: Permian; T: Triassic; J: Jurassic; J1: Lower Jurassic; J2: Middle Jurassic; K1: Lower Cretaceous. |
This evaluation fully utilizes the latest data from various coal-rock gas exploration and development wells in recent years in basins such as Ordos, Sichuan, Junggar, Tarim, Bohai Bay, Qaidam, Turpan-Hami, as well as coal seam data from conventional oil and gas, shale oil and gas, and other passing wells. The gas contents were determined and valued using the methods described earlier. The application model with gas content data from wireline coring was calibrated to calculate the gas content of pressure-preserved coring, while the gas content without wireline coring was calculated through logging methods. In the division of computing units, comprehensive consideration was given to the structure, burial depth, Ro, planar distribution of gas content for the division of different geological units. Vertically, Benxi Formation No. 8 coal rock reservoir, Shanxi Formation No. 5 coal rock reservoir, and Jurassic coal rock were evaluated separately, while other non-main coal rock reservoir were evaluated uniformly based on the lower limit of 1m thickness and cumulative thickness. The basins or regions with low detailed levels of data were also divided into geological units according to the practices of the Ordos Basin on plane, but evaluated vertically based on the main coal seams (groups). In terms of evaluation methods, different evaluation methods were selected based on differences in understanding of basin geology, exploration and development levels, as well as differences in coal-rock gas enrichment patterns. For the primary coal-rock gas resources of Benxi Formation No. 8 coal rock reservoir in the Ordos Basin and the regenerated coal-rock gas resources in the Baijiahai area of the Junggar Basin, the volumetric method was adopted. For coal-rock gas resources in other strata of the Ordos Basin, except for the Benxi Formation No. 8 coal seam, as well as coal-rock gas resources in basins such as Sichuan, Junggar, Tarim, Bohai Bay, Qaidam, Turpan-Hami, and Qinshui and, which have a certain data foundation and understanding of reservoir formation, the volumetric method was used. For basins such as Ningwu, and Southern North China, due to their lower levels of exploration and development and geological understanding, the analogy method was chiefly utilized to determine gas content and recoverable coefficient based on the coal rock development layer, burial depth, and Ro values.
The evaluation results indicate that the coal-rock gas resources in the main coal-bearing basins in onshore China are 55.11×10¹² m3. According to regional statistics, the coal-rock gas resources in North China are 35.26×10¹² m3, accounting for 63.99% of the total coal-rock gas resources in the country; The coal-rock gas resources in Northwest China are 12.63×10¹² m3, accounting for 22.91% of the total coal-rock gas resources in the country; The coal-rock gas resources in South China are 5.70×10¹² m3, accounting for 10.34% of the total coal-rock gas resources in the country; The coal-rock gas resources in Northeast China are 1.52×10¹² m3, accounting for 2.76% of the total coal-rock gas resources in the country (Table 3). According to depth statistics, the coal-rock gas resources at 1 500-3 000 m are 27.72×10¹² m3, accounting for 50.29% of the total resources; The coal-rock gas resources at 3 000-5 000 m are 23.76×10¹² m3, accounting for 43.11% of the total resources; The coal-rock gas resources at 5 000-6 000 m are 3.63×10¹² m3, accounting for 6.60% of the total resources. According to coal rank statistics, the coal-rock gas resources in the middle-low coal ranks are 12.69×10¹² m3, accounting for 23.03% of the total resources; The coal-rock gas resources in the middle-high coal ranks are 42.42×10¹² m3, accounting for 76.97% of the total resources. According to the distribution layer statistics, the coal-rock gas resources of the Carboniferous-Permian systems are 40.00×10¹² m3, accounting for 72.58% of the total resources; The Jurassic coal-rock gas resources are 13.59×10¹² m3, accounting for 24.66% of the total resources; The coal-rock gas resources of other strata are 1.52×10¹² m3, accounting for 2.76% of the total resources.
The coal-rock gas resources in the Ordos Basin are 30.49×10¹² m3, accounting for 55.32% of the total national resources. There is a total of 10 coal-bearing strata, including the Lower Permian Shanxi Formation, Taiyuan Formation, and Upper Carboniferous Benxi Formation, developed in the Upper Paleozoic of this basin. The main coal rock reservior are located in the No. 5 coal rock of Shanxi Formation and the No. 8 coal rock of Benxi Formation, with a single layer thickness of 1-12 m and a cumulative thickness of 5-40 m. The gas content is 5-25 m3/t, and the Ro value is 1.0%-2.5%. It is a middle-high metamorphic bituminous coal-anthracite coal. Coal rock has sufficient hydrocarbon generation and overall better storage performance, characterized by well-developed pores and fractures, multiple macro pores, high gas content, and a high proportion of free gas, etc. Based on the resource evaluation method presented in this article, resource evaluations were conducted for coal-rock gas resources in the Carboniferous-Permian and Jurassic systems. In the Carboniferous-Permian, the No.8 coal rock reservoir has coal-rock gas resource of 15.01×10¹² m3, and the No.5 rock reservoir has coal-rock gas resource of 9.1×10¹² m3. In addition to the No.5 and No.8 rock reservoir, non-main reservoirs such as the No.3, No.4, No.6, No.7, and No.8 coal seams were partially developed from top to bottom. Considering the minimum evaluation limit of a single layer thickness of 1 m, the total coal-rock gas resources of these reservoirs are 5.9×10¹² m3. At the same time, the Ordos Basin also develops low rank coal rock in the Yan'an Formation of the Jurassic system, with a thickness of 5-30 m. According to the volume method, Jurassic coal-rock gas reservoirs deeper than 2 500 m have gas resources of 1 792×108 m3.
On the basis of resource evaluation, the evaluations for various types were carried out according to the method described earlier. The Class I resources are 12.01×10¹² m3, accounting for 21.80% of the total resource quantity, mainly distributed in basins such as Ordos, Sichuan, Junggar, and Bohai Bay. The Class II resources amount to 18.06×10¹² m3 and are mainly distributed in basins such as Ordos, Sichuan, Junggar, Tarim, Qaidam, and Bohai Bay, accounting for 32.76% of the total resources. The Class III resources are 25.04×10¹² m3, accounting for 45.44% of the total resource quantity. For Class I and II resources, corresponding technically recoverable coefficients of 0.5 and 0.4 were used for calculation, and the evaluated technical recoverable resources are 13.23×10¹² m3 (Table 3).
It should be noted that due to the limitations of current experimental testing methods, the experimental test results of coal-rock porosity, permeability, etc. are difficult to fully reflect the actual situation of coal rock fractures. Starting from the feasibility of resource development and the reliability of resource evaluation results, this study conservatively selected key evaluation parameters such as the lower limit of coal-rock gas content and the lower limit of reservoir thickness. At the same time, the coal-rock gas data in this article mainly comes from the Ordos Basin, where the reliability of resource evaluation results is relatively high. In other basins, due to relatively limited data, coal-rock reservoir parameters are mostly obtained by analogy. Therefore, the resource data in this article is based on current geological understanding and development technology. The comprehensive manifestation of technology, with the deepening of geological understanding and the advancement of engineering technology, the data of coal-rock gas resources will be adjusted. The authors hold an optimistic attitude towards the future trend of resource changes.
3.2. Favorable exploration areas
North China, represented by the Ordos Basin, widely and stably develops coal rocks in the Carboniferous-Permian marine-continental transition facies. Coal rocks generally have higher degree of thermal evolution and higher gas content. The southern coal accumulating areas, such as the Sichuan Basin, develop Permian continental coal rocks with high thermal evolution and gas content. In particular, the Sichuan Basin has good preservation conditions and also develops overpressure coal-rock reservoirs. In the northwest coal accumulation areas represented by the Junggar Basin and Turpan-Hami Basin, Jurassic continental coal rocks are developed with large burial depth, large thickness of coal rocks but large lateral changes. Due to the lower geothermal gradient in the northwest basins, the evolution degree of coal rocks is lower and the gas content is lower. Hailar and other northeastern coal accumulation develop Cretaceous continental coal rocks with a relatively thick thickness. Influenced by the high geothermal field in the east, although the coal formation age is slightly later than that of the northwest coal accumulation areas, the evolution degree and gas content are higher than those of the northwest Jurassic coal rocks. Overall, the coal-rock gas resources in the coal accumulation areas in North China are superior to those in other coal accumulation areas; the coal-rock gas resources in the middle-high coal ranks are superior to those in the middle-low coal ranks, and the coal-rock gas resources in the Carboniferous-Permian transitional facies are superior to those in other strata.
From the distribution of basins, coal-rock gas resources are mainly distributed in basins such as Ordos, Sichuan, Junggar, Tarim, Bohai Bay, Qaidam, and Turpan-Hami. Of them, the coal-rock gas data in the Ordos Basin are relatively detailed and have high overall credibility, making it the main battlefield for the development of the coal-rock gas industry. The coal-rock gas favorable areas of the Benxi Formation No. 8 coal rock reservoir are mainly located in the main evaluation zones of Shenmu, Suide, Yan'an East, Yulin East, and Wushenqi. The coal- rock gas favorable areas of Shanxi Formation No. 5 coal rock reservoir are mainly distributed in the areas to the north of Sulige-Jingbian-Wubao, Daning-Jixian-Heyang in the southeast of the basin, and to the west of the Qingyang-Huachi in the southwest of the basin. In addition, the central- southern area of the Sichuan Basin, Dinan-Baijiahai bulges, Qigu fault-fold belt and hinterland slope area of the Junggar Basin, the northern structural belt of the Kuqa Depression in the Tarim Basin, the northern Dacheng area of the Jizhong Depression, Kongxi-Qibei area, Chenghai-Qinan area, Wangguantun- Wumaying area, Xuhei-Yanshan area in the Huanghua Depression in the Bohai Bay Basin, the Taibei Sag of the Turpan-Hami Basin, Jiulongshan area and Niudong-Lenghu area in the Qaidam Basin, are favorable exploration areas for coal-rock gas.
3.3. Outlook
The evaluation results of various types of coal-rock gas resources in the 14 major coal-bearing basins in China show that Class I resources are 12.01×10¹² m3, mainly distributed in basins such as Ordos, Sichuan, Junggar, and Bohai Bay. Of them, Class I resources in the Ordos Basin are 6.40×10¹² m3, accounting for 53.30% of the total Class I coal-rock gas resources. The Class II resources amount to 18.06×10¹² m3, accounting for 32.76% of the total coal-rock gas resources in China. They are mainly distributed in basins such as Ordos, Sichuan, Junggar, Tarim, Qaidam, and Bohai Bay. From the perspective of resource distribution and field implementation progress, the Ordos Basin is the main battlefield of exploration and development, Sichuan Basin and the Junggar Basin are the next replacement areas, and Tarim Basin, Bohai Bay Basin, Turpan-Hami Basin, Songliao Basin and Hailar Basin in Northeast China can be regarded as future prospects. Analogous to the resource-reserves conversion situation in favorable areas such as Daning-Jixian and Shenfu, based on Class I and II resources, it is predicted that China's coal-rock gas has the potential to explore geological reserves of (6-8)×1012 m3. Considering the differences in geological conditions of coal-rock gas favorable areas in different basins or regions, the gas extraction rate is calculated at 1% to 2%. China has the resource foundation to build an annual production capacity of 500×108 m3 and maintain long-term stable production. Of course, at present, coal-rock gas is still in the early stage of development and faces technical, economic, and management challenges such as unclear enrichment mechanisms for different types and ranks of coal-rock gas, incomplete exploration and development supporting technologies, low single well EUR, high complete costs, and poor mining rights management. It requires the joint efforts of the whole society to promote the realization of the vision goals of the "coal rock revolution" with Chinese characteristics, and contribute unconventional forces to the development of new quality productivity in the energy industry and the guarantee of national energy security.
4. Conclusions
Guided by the concept of "the overall exploration concept of considering coal rock as reservoir" and based on the classification of "two types and four categories", a set of coal-rock gas resource evaluation method and technical system suitable for the geological characteristics of coal-rock gas was established, on the basis of different geological knowledge levels and data richness conditions.
Based on the relationship between Ro and burial depth of coal rock, the critical depths of coal-rock gas in different basins and regions were determined. The relationship between the average daily production of horizontal wells in a kilometer-level section in the first year and the thickness of coal-rock reservoirs was constructed, and the lower limits of gas contents for the evaluation of middle-low/middle-high coal ranks were determined. Based on the development effect of the No. 8 coal-rock gas in the Benxi Formation of the Ordos Basin, the technically recoverable coefficients of different types of resources were confirmed.
The potential of coal-rock gas resources in major coal-bearing basins in onshore China were systematically evaluated. The evaluation and calculation results show that the coal-rock gas resources in the depth range of 1 500 m to 6 000 m in the 14 major coal-bearing basins in onshore China can reach 55.11×10¹² m3, mainly distributed in basins such as Ordos, Sichuan, Junggar, Tarim, Bohai Bay, and Turpan-Hami. Of them, the coal-rock gas resources at burial depth of 1 500-3 000 m are 27.72×10¹² m3, accounting for 50.29% of the total resources; The coal-rock gas resources at burial depth of 3 000-5 000 m are 23.76×10¹² m3, accounting for 43.11% of the total resources; The coal-rock gas resources at burial depth of 5 000-6 000 m are 3.63×10¹² m3, accounting for 6.60% of the total resources. The Class I resources amount to 12.01×10¹² m3, accounting for 21.80% of the total coal-rock gas resources; The Class II resources amount to 18.06×10¹² m3, accounting for 32.76% of the total resources; The Class III resources amount to 25.04×10¹² m3, accounting for 45.44% of the total resources.
The main targets and development prospects of coal- rock gas exploration and development in China in the future were clarified. From the distribution of resources, the Ordos Basin is the main battlefield for exploration and development. Based on Class I and Class II resources, it is evaluated that the total technically recoverable resources of Class I resources and Class II resources are 13.23×10¹² m3. It is predicted that that China has a proven geological reserve of (6-8)×1012 m3 and a resource foundation for an annual production scale of 500×108 m3 for coal-rock gas.
The evaluation results of coal-rock gas resources are a comprehensive reflection of current geological understanding and development technology, and fluctuate with the progress of understanding and technology. To ensure the future exploitability of resources, the parameter values for the evaluation of coal-rock gas resources are relatively conservative. At the same time, the Ordos Basin data has rich data, so its resource evaluation results are relatively reliable. Due to relatively limited data, the parameters of coal-rock reservoirs in other basins are mainly based on analogy, and the credibility of resource evaluation results is relatively low. With the continuous advancement of coal-rock gas exploration and development, the level of understanding of coal-rock gas geology and the continuous progress of development technology, the resource evaluation results of coal-rock gas will also change.
Acknowledgments
This coal-rock gas resource evaluation project has received strong support and assistance from experts from Changqing Oilfield, PetroChina Coalbed Methane Company, Xinjiang Oilfield, Tarim Oilfield, Liaohe Oilfield, Jidong Oilfield and other units. We express our deep gratitude.
Nomenclature
A—gas-bearing area of coal rock, km2;
B—ash content of coal rock, %;
Bg—free gas volume coefficient;
C0—measured gas content from wireline coring, m3/t;
C1—calibrated gas content from wireline coring, m3/t;
CA—adsorbed gas content of coal rock, m3/t;
CF—free gas content of coal rock, m3/t;
D—burial depth of coal-rock reservoir, m;
G—geological resource of coal-rock gas, 108 m3;
GA—geological resource of adsorbed gas, 108 m3;
GF—geological resource of free gas, 108 m3;
GR—gamma ray, API;
H—effective thickness of coal-rock reservoir, m;
I—resource level judgment index, dimensionless;
M—moisture content of coal rock, %;
p—formation pressure, MPa;
pL—Langmuir pressure, MPa;
Qt—predicted total gas content, cm3/g;
R11d—deep laterolog, Ω·m;
Ro—vitrinite reflectance, %;
SC—grade score of coal-rock gas content, dimensionless;
SD—grade score of the burial depth condition of coal-rock reservoirs, dimensionless;
Sg—gas saturation of coal-rock reservoir pores, %;
SH—grade score of coal-rock reservoir thickness, dimensionless;
SS—grade score of coal structure, dimensionless;
ST—grade score of coal-rock structural condition, dimensionless;
t—reservoir temperature, °C;
VL—Langmuir volume, m3/t;
∆t—acoustic time difference logging value, μs/m;
ρ—density logging value, g/cm3;
ρc—density of coal-rock reservoir, t/m3;
ϕ—in-situ porosity of coal rock, %;
ϕ0—surface porosity of coal rock, %;
σe—effective stress, MPa.