

Introduction
Deep coal-rock gas is one of the main types of unconventional natural gas, and it represents another strategic area that can support sustained and rapid development of natural gas in China, following tight gas and shale gas [1-3]. Deep coal-rock gas refers to hydrocarbon gas with methane as its main component, which is stored in coal reservoirs or coal partings with burial depths greater than 1 500 m. Some scholars refer to deep coal-rock gas as deep coalbed methane or simply as coal-rock gas [4-5]. China is particularly rich in coal-rock gas resources, which are distributed in major petroliferous basins [6]. The Ordos Basin with widely developed coal seams and enormous resources is currently the main battlefield for deep coal-rock gas exploration and development [1,7].
With continuous advancement of exploration and development, the typical geological characteristics of deep coal-rock gas reservoirs have gradually been recognized [1,5]. However, with special structures and unique gas occurrences, coal-rock gas reservoirs are still under evaluation, and some important issues have not yet been effectively resolved [8-12], such as the occurrence of free gas, production performance and indicators of gas wells, and reasonable development technology and policies. Focusing on the bottlenecks encountered in the development of deep coal-rock gas in the Ordos Basin, this paper conducts systematic research on the thickness distribution of the coal seams in the entire Upper Paleozoic interval, assessment of coal-rock gas resources in the representative region, evaluation of free gas content and proportion, gas well productivity evaluation models, development technologies and policies, and update of key development technologies, with the intent to provide technical supports for the large-scale and efficient development of coal-rock gas.
1. Typical geology of deep coal-rock gas reservoirs
1.1. Sedimentary and structural features of coal rock
The Carboniferous-Middle Permian coal-bearing strata in the Ordos Basin mainly consist of the Benxi Formation, Taiyuan Formation, and Shanxi Formation, with 10 coal seam intervals developed vertically (Fig. 1). The 8# coal seam at the top of the Benxi Formation extends widely and is the thickest in the Ordos Basin. Throughout the geological history, it has been buried below 4 000 m [13], and the thermal maturity of the coal-rock is high, making it the primary target for developing coal-rock gas. The 5# coal seam in the middle-lower part of the Shanxi Formation is also widely distributed, less continuous and thinner than the 8# coal seam. It’s the secondary target at present. Other coal seams are limitedly distributed and thinner. In terms of macroscopic characteristics, the 8# coal seam is mainly composed of semi-bright coal and bright coal, followed by semi-dull coal and dull coal, with partings observed. In terms of coal structure, the coal-rock is predominantly primary structural coal [7].
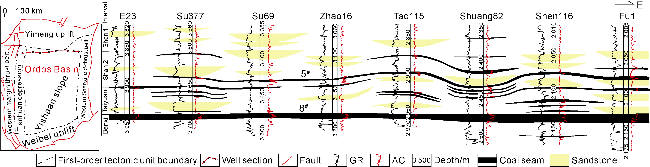
Fig. 1. EW cross-section of Upper Paleozoic coal seams in the Ordos Basin. |
1.2. Physical properties of coal-rock reservoir
Porosity and permeability are key parameters for characterizing reservoir physical properties, and play a crucial role in the evaluation of coal-rock gas reserves and gas well productivity [7]. Currently, both parameters are tested on core samples (2.5-3.0 cm in diameter) using the helium method [14]. As for coal samples taken from north of Mizhi, Jiaxian, and Daning-Jixian areas in the eastern Ordos Basin, the porosity ranges from 3.63% to 9.90%, with an average of 6.35%; the permeability ranges from 0.001×10⁻³ μm2 to 3.180×10⁻³ μm2, with an average of 0.588×10⁻³ μm2. It should be noted that coal-rock reservoirs generally contain fracture systems on a decimeter scale and above. However, using centimeter-scale core samples, it is difficult to effectively characterize the permeability of fracture systems, so the measurements may not objectively reflect the true storage and seepage capacities of coal-rock reservoirs [11]. The actual physical properties should be better than the measurements.
1.3. Gas-bearing characteristics
Deep coal-rock gas is characterized by high gas content, high free gas content, and high saturation, showing significant differences from shallow coalbed methane[1-2]. In shallow coalbed methane reservoirs on the eastern margin of the Ordos Basin, the gas is almost entirely adsorbed gas [7]; whereas in deep coal-rock gas reservoirs, free gas and adsorbed gas coexist. Gas content measurements from Daning-Jixian, Jiaxian, Yichuan and the north of Mizhi—based on pressure-preserved coring, canister coring, wireline coring, and a small number of conventional cores at depths of 2 071-3 666 m—indicate that total gas contents of coal-rock gas reservoirs range from 10.61 m3/t to 34.63 m3/t (average: 22.13 m3/t). Most samples fall within 15.11-29.23 m3/t. The free-gas content ranges from 1.32 m3/t to 15.59 m3/t, with an average of 5.65 m3/t, accounting for 5.58%-45.91% of the total gas content (average: 25.08%). It should be noted that there is still significant uncertainty in the above evaluation results of coal-rock gas content and free gas proportion. The uncertainty arises from errors or deficiencies in various aspects such as coal-rock coring methods, testing methods, testing equipment, and the selection of key physical property parameters.
The fluids stored in the space of conventional and tight gas reservoir are formation water and free natural gas, characterized by water saturation and gas saturation, respectively. Different from conventional and tight gas, gas in coal-rock reservoirs is the residual after hydrocarbon generation and expulsion. Due to high temperature and pressure during hydrocarbon generation and expulsion, most water in coal-rock is carried out of the reservoir by natural gas, leaving only a small amount. Therefore, theoretically, the water saturation of coal-rock gas reservoirs is extremely low. Studies have shown that the average saturation of free gas in deep coal-rock is greater than 95% [5,7]. In addition, approximately 2% of pores are occupied by adsorbed gas, suggesting that water saturation should be less than 5%.
2. Resource evaluation
Latest statistical data shows that there are approximately 21 000 wells drilled in the 8# coal seam and about 28 000 wells drilled in the 5# coal seam in the Ordos Basin. Following the principles of full-area coverage, uniform distribution, and emphasis on key areas, this paper uses more than 5 600 wells to conduct thickness analysis of all the Upper Paleozoic coal seam intervals. The wells used for evaluation almost cover the PetroChina mining concession area, especially dense in the eastern part of the basin. For other areas lacking or with insufficient drilling data, coal seam thickness is predicted using the interpolation method. Regarding that the eastern part is the key area for coal-rock gas development, a rectangular block covering 12 000 km2, roughly centered on Yulin City (Fig. 2), is selected for systematical resource evaluation, with the 5# and 8# coal seams as the primary focus.
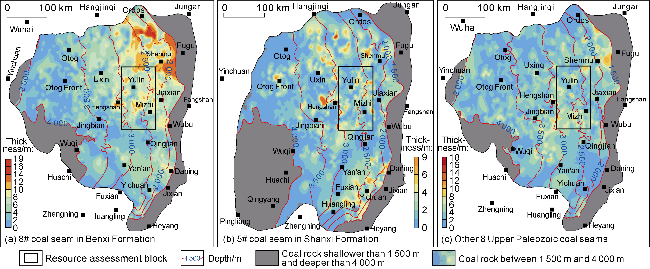
Fig. 2. Thickness distribution of Upper Paleozoic coal seams in the Ordos Basin. |
2.1. Evaluation method
Generally, the volumetric method is used to assess conventional and tight gas resources [1], with key evaluation parameters including gas-bearing area, effective thickness, porosity, and gas saturation. Due to the different occurrence of coal-rock gas from conventional and tight gas, this paper integrates the construction of the spatial distribution of gas content and volumetric method to calculate coal-rock gas resources. Starting from basic drilling data, this method obtains the spatial thickness distribution and burial depth distribution of coal-rock reservoirs through coal seam interpretation, then constructs the spatial distribution of gas content using the relationship between coal- rock burial depth and gas content. This method enables rapid calculation of coal-rock gas resources within the specified gas-bearing area, thickness and depth ranges. The formula for calculating coal-rock gas resources is:
$G_{\mathrm{i}}=0.01 A h \rho C$
Gas content is a key parameter for evaluating coal-rock gas resources. Previous studies suggested that with increasing burial depth, under the jointing effects of temperature and pressure, both the total gas content and free gas content show a trend of first increasing and then decreasing, with the peak gas content roughly corresponding to the burial depth of 2 200-2 600 m [15]. However, our study found that with increasing burial depth, the increase in temperature leads to enhanced gas activity and weakened adsorption capacity, so the adsorbed gas content decreases; whereas the increase in pressure leads to an increase in free gas content per unit volume. Overall, the increase in free gas content exceeds the decrease in adsorbed gas content, so the total gas content should increase with increasing temperature and pressure.
To accurately evaluate coal-rock gas content at different burial depths, considering the aforementioned laboratory measurements of coal-rock gas content, this paper establishes a relationship model between gas content and burial depth, and based on which the spatial distribution of gas content is constructed. Coal-rock gas resource assessment is carried out at 200 m×200 m high-precision grids. According to the relationship model, as burial depth increases, the total gas content gradually increases from 15 m3/t (corresponding to 1 500 m) to 30 m3/t (corresponding to 4 000 m), and remains stable thereafter. The calculated resources are basically consistent with the reported in areas such as north of Mizhi, confirming that the resource assessments in this paper are reasonable and reliable.
2.2. Resource evaluation results
2.2.1. 8# coal seam in the Benxi Formation
8# coal seam at the top of the Benxi Formation is the primary target in the Ordos Basin. The thickness of the coal seam is 1.8-12.3 m, with an average of 7.0 m and the maximum up to 18.6 m. Overall, it is thicker in the northeast and thinner in the southwest, and stable in distribution across the entire basin (Fig. 2a). Resource assessment shows that the coal-rock gas in the 8# coal seam within the resource evaluation region is 3.08×10¹² m3, with resource abundance of 2.50×10⁸ m3/km2. Among these, the resource amount corresponding to areas with coal seam thickness greater than or equal to 2 m is 3.04×10¹² m3, that for thickness greater than or equal to 4 m is 2.83×10¹² m3, and for thickness greater than or equal to 6 m is 2.32×10¹² m3.
2.2.2. 5# coal seam in the Shanxi Formation
5# coal seam in the middle-lower part of the Shanxi Formation is the secondary target, mainly ranging from 0.2 m to 4.1 m (averaged 2.1 m), and the maximum up to 8.9 m (Fig. 2b). Overall, it is thicker in the east and thinner in the west, but less stable than 8# coal seam. The resource of coal-rock gas in 5# coal seam within the resource evaluation region is 0.95×10¹² m3, with resource abundance of 0.77×10⁸ m3/km2. The resource amount corresponding to areas with a coal seam thickness greater than or equal to 2 m is 0.66×10¹² m3, while that for areas with a thickness greater than or equal to 4 m is 0.16×10¹² m3.
2.2.3. 1#-10# Upper Paleozoic coal seams
The cumulative thickness of 1#-10# coal seams in the Upper Paleozoic throughout the basin ranges from 3.1 to 15.5 m, with an average of 9.3 m and the maximum up to 26.1 m. The distribution of 5# and 8# coal seams is relatively stable, and drilled in at a high rate, whereas the other coal seams have poor stability (Figs. 1 and 2c). The total resource of coal-rock gas in 1#-10# coal seams within the resource evaluation region is 5.66×10¹² m3. Excluding 5# and 8#, the total resource of the other 8 coal seams is 1.63×10¹² m3.
According to the above analysis, the coal-rock gas resource of the 8# coal seam accounts for 54%, the 5# accounts for 17%, and the other 8 coal seams account for 29% in assessment blocks. Their resource ratio is 5 to 2 to 3. With greater thickness, abundant resources, and high proportion, the 8# coal seam is the target interval with the greatest development potential.
3. Key development indicators
3.1. Free gas content and proportion
Development practices show that coal-rock gas wells are characterized by rapid gas breakthrough and high production during the dewatering stage. After being put into production, gas wells give relatively stable and high production at stable pressure, leading to a high EUR [9-10,16]. However, at low free gas content, gas wells generally do not have high productivity. This suggests that the proportion of free gas may have been underestimated. To accurately evaluate the occurrence of gas in coal-rock reservoirs, this paper uses the ideal gas law method and specific surface area method to assess the content and proportion of free gas in coal-rock gas reservoirs.
3.1.1. Ideal gas law method
The ideal gas state equation describes the relationship among pressure, volume, temperature, and amount of substance for an ideal gas under certain conditions, by the following mathematical expression:
$p V=n R T$
The principle of this method is: take 1.0 t of coal-rock reservoir as the research target, use the volumetric method to evaluate the volume of free gas (Vi) that can be stored in the reservoir under subsurface conditions, convert it to surface volume (Vsc) according to the ideal gas state equation, and use Vsc as the free gas content of 1.0 t of coal-rock reservoir. According to the ideal gas state equation,
$V_{\mathrm{sc}}=\frac{p_{\mathrm{i}} V_{\mathrm{i}} T_{\mathrm{sc}}}{p_{\mathrm{sc}} T_{\mathrm{i}} Z_{\mathrm{i}}}$
Vi is 0.04 m3 and the free gas content (Vsc) is 8.90 m3 when the coal-rock density is 1.4 t/m3, average porosity of 6.35%, and free gas saturation of 95% [5,7]. Experimental analysis shows that the average total gas content (under surface conditions) is 22.13 m3/t. Taking 8.90 m3 as the free gas content, the adsorbed gas content is 13.23 m3, accounting for 40.2% and 59.8%, respectively.
3.1.2. Specific surface area method
The basic principle of this method is: measure the maximum number of methane molecules that can be adsorbed on the specific surface of 1.0 t of coal-rock, calculate the volume of methane under surface conditions based on parameters such as methane molar mass (MCH4), Avogadro's constant (NA), and coal-rock specific surface area, and use this volume as the adsorbed gas content. According to the van der Waals force formula, the potential energy between two molecules can be approximately expressed by the empirical formula:
$U(r)=b / r^{12}-a / r^{6}$
For methane molecules, when two molecules are too close, their electron clouds overlap significantly, resulting in strong repulsion (the repulsive force is inversely proportional to the 12th power of distance). If they are too far apart, the interactive force is too small. When the distance is about one molecular diameter (0.414 nm), the van der Waals attractive force is the maximum (Fig. 3a). This paper uses this distance to evaluate the amount of natural gas that can be adsorbed on the surface of coal-rock reservoirs (Fig. 3b).
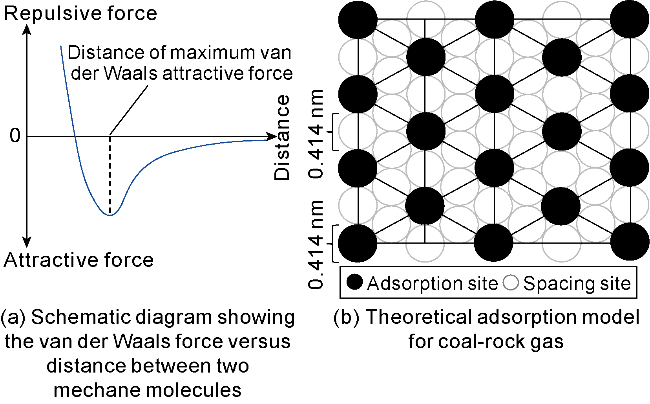
Fig. 3. Model diagram for evaluating adsorbed gas content in coal-rock gas reservoir using the specific surface area method. |
Key parameter values are as follows: according to previous studies, coal-rock specific surface area is taken as 200 m2/g [12], Avogadro's constant is 6.022×10²³ molecules/mol, methane molar mass is 16 g/mol, methane molecular diameter (d) is 0.414×10⁻⁹ m, and methane density under normal temperature and pressure is 0.665 kg/m3. According to the methane adsorption model in Fig. 3b, the number of methane molecules that can be adsorbed on the surface of 1.0 t of coal-rock is 3.36×1026, corresponding to an amount of methane molecules of 557.95 mol and total mass of 8.93 kg. Under normal surface temperature and pressure, the volume of adsorbed methane is 13.43 m3. If the average total gas content is 22.13 m3/t and the adsorbed gas content is 13.43 m3, the free gas content is 8.70 m3, indicating free gas and adsorbed gas accounting for 39.3% and 60.7%, respectively.
Based on the analysis using the ideal gas law method and specific surface area method, the proportions of free gas in deep coal-rock gas reservoirs under the burial depth of 2 000 m in the Ordos Basin are 40.2% and 39.3%, with an average of 39.8%; the proportions of adsorbed gas are 59.8% and 60.7%, with an average of 60.2%; the proportions of free gas and adsorbed gas are approximately 40% and 60%, respectively. It should be noted that the above contents and proportions of free gas and adsorbed gas are evaluation results under certain conditions such as coal-rock reservoir porosity, gas saturation, and total gas content. The exact contents and proportions should be evaluated specifically by combining parameters such as actual coal-rock burial depth, total gas content, porosity, and gas saturation.
3.2. Dynamic production behavior of gas wells
By the end of 2024, a total of 224 deep coal-rock gas horizontal wells had been put into production in the Daning-Jixian, Jiaxian, Yichuan and northern Mizhi blocks, the average gas production period was 312 days, the average cumulative gas production per well was 14.30×10⁶ m3, and the average cumulative liquid production per well was 9 983 m3. In the first month after being put into production, the average casing pressure was 11.40 MPa, the average gas production was 60 500 m3/d, and the average liquid production was 235 m3/d. After one year, the average casing pressure was 5.21 MPa, the average gas production was 38 300 m3/d, and the average liquid production was 22.90 m3/d.
Based on the full-lifecycle production law and the mechanism of coal-rock gas desorption, the production process of a deep coal-rock gas horizontal well can be divided into five stages: casing liquid drainage, tubing liquid drainage, pressure-controlled stable production, pressure-controlled decline, and low-pressure production decline [16-17]. In view of a short production history, the production performances of coal-rock gas wells are still uncertain. Comprehensive analysis of liquid production, gas production and pressure shows that low pressure and low production rates dominate most of the well’s lifecycle. In terms of liquid production, formation water is extremely low, and the produced liquid is almost fracturing fluid. The liquid production shows a trend of rapid increase in the initial stage, gradual decrease after reaching the peak, and then gradually decreases in the later stage. The liquid production after one year of production is only 9.7% of that in the first month. The gas production shows a trend of rapid rise, to a peak, short-term stable production, and finally gradual decline. The daily gas production after one year is 63.3% of that in the first month, showing a fast decline. The gas produced in the early stage is free gas within the effective fracture network near the wellbore. After most free gas is produced, adsorbed gas begins to desorb, and the proportion of desorbed adsorbed gas gradually increases, and becomes the main contributor to production. In terms of pressure, the average casing pressure after one year is 45.6% of that in the first month, showing a fast decline. Late-stage reservoir pressure is mainly maintained by desorbed gas.
3.3. Productivity evaluation model and indicator prediction
3.3.1. Basic principles of the productivity evaluation model
The recovery of controllable reserves is one of the key parameters determining the EUR of a gas well [17-19]. In Fig. 4, the horizontal axis represents the distance from a given point in the reservoir to the horizontal wellbore. In theory, hydraulic fractures extend to a distance equal to half the spacing between two adjacent horizontal wells. The vertical axis represents the recovery ratio of reserves (i.e., the proportion of reserves produced at different points from wellbore to the half well spacing), with an ideal recovery ratio of 100%. Affected by factors such as abandonment pressure, reservoir heterogeneity, isolated pores and desorption degree, it is difficult to produce all gas. Since tight sandstone gas is free, and the reservoir space is mainly micron-scale, gas can freely move within connected pores and fractures. After conventional fracturing stimulation, free gas in tight sandstone can flow from the distal end to artificial fractures through matrix channels, and finally be produced. Consequently, the recovery ratio of natural gas at different points is basically the same [20-21] (Fig. 4). Different from tight gas, coal-rock reservoirs have poor physical properties, small pores (mainly micropores and macropores), and poor connectivity, so gas can only desorb and seep within the effective fracture network. Therefore, the recovery ratio of a coal-rock gas horizontal well shows a gradual decrease from the wellbore outward, meaning the farther from the wellbore, the poorer the fracturing stimulation, the smaller the effective fracture network, and finally the lower the gas recovery ratio.
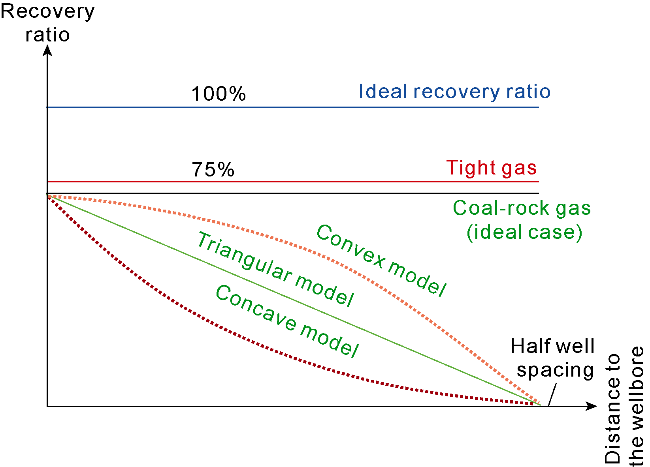
Fig. 4. Recovery ratio from the wellbore outward for tight gas and coal-rock gas. |
Based on the above principles, and given coal-rock reservoir thickness, horizontal section length, well spacing, and effective fracturing stimulation, this paper establishes three productivity evaluation models: triangular model, concave model, and convex model (Fig. 5). The productivity evaluation models equivalently abstract the artificial fracture network into two parts: fully stimulated and unstimulated. The reservoir below the yellow dashed line in Fig. 5 is fully stimulated and contributes to gas well productivity, whereas the reservoir above the yellow dashed line is unstimulated or does not contribute to gas well productivity. The reservoir stimulation degree near the wellbore is high, so the gas recovery ratio is higher. The end of the fracture network is unstimulated, so the recovery ratio is zero. The triangular model equivalently treats the artificial fracture network as an isosceles triangle with height equal to coal-rock thickness and base length equal to well spacing, meaning the stimulation intensity uniformly decreases from the wellbore outward. In the concave model, the base length is the same as the triangular model, but due to lower reservoir stimulation intensity than the triangular model, the two sides are concave curves, and gas well productivity is lower than the triangular model. In the convex model, the base length is the same as the triangular model, but reservoir stimulation intensity is higher than the triangular model, so the two sides are convex curves, and gas well productivity is higher than the triangular model.
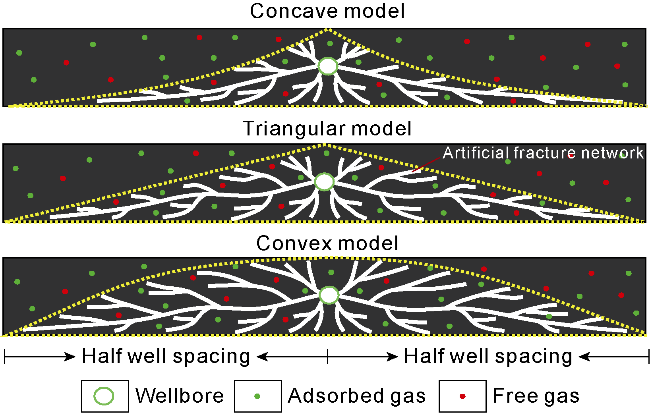
Fig. 5. Three theoretical productivity evaluation models for coal-rock gas horizontal wells. |
The triangular model can be used as the basic model for coal-rock gas well productivity evaluation, in which effective fracture network accounts for 50% of the well-controlled reservoir volume (hereinafter referred to as a stimulation coefficient). Obviously, the stimulation coefficient of the convex model is greater than 50%, and that of the concave model is less than 50%.
3.3.2. Model-based productivity evaluation
Development practice of more than 20 000 tight gas wells in Sulige Gas Field in the Ordos Basin shows that the average recovery factor of controllable reserves of tight gas wells is 75%, and the remaining natural gas is unrecoverable due to factors such as abandoned pressure and isolated pores. For coal-rock gas, although the reservoir space (pores) is smaller than that of tight sandstone reservoirs, its higher fracturing intensity and better-developed artificial fracture network enable the recovery of free gas within the drainage area to be approximately equivalent to that of tight sandstone gas. Thus, the recovery of tight gas can be used as a reference. Within the drainage area, higher reservoir stimulation facilitates the conversion from adsorbed gas into free gas, so the recovery of adsorbed gas should be close to that of free gas. However, considering the large specific surface area and high proportion of micropores in coal-rock reservoir, adsorbed gas is difficult to be completely converted into free gas, so the recovery is set slightly lower than that of free gas, namely 67.5%. Therefore, even within the near-wellbore zone that has been sufficiently stimulated, the recovery of coal-rock gas is lower than tight gas (Fig. 4).
Based on the recovery values of free gas and adsorbed gas within the effective stimulated reservoir area (75% and 67.5% respectively), in the case that the average coal- rock thickness is 7.0 m, reserve abundance is 2.18×10¹² m3/km2, horizontal section length is 1 500 m, well spacing is 400 m, well-controlled area is 0.60 km2, total gas content is 22.13 m3/t, and free gas proportion is 40%, the triangular model estimated an EUR of 46.212 8×10⁶ m3, including free gas production of 19.665 0×106 m3 and adsorbed gas production of 26.547 8×10⁶ m3; the concave model with a stimulation coefficient of 43.75% predicted an EUR of 40.436 2×10⁶ m3, including free gas production of 17.206 9×10⁶ m3 and adsorbed gas production of 23.229 3×10⁶ m3; and the convex model with a stimulation coefficient of 62.5% predicted an EUR of 57.765 9×10⁶ m3, including free gas production of 24.581 3×10⁶ m3 and adsorbed gas production of 33.184 7×10⁶ m3.
It should be noted that the triangular model can evaluate and predict the overall EUR of coal-rock gas wells. For a known well, the evaluation result depends on actual parameters such as coal-rock reservoir thickness, horizontal section through reservoir, and well spacing, well controllable reserves, total gas content, and the proportion of free gas.
3.4. Indicator evaluation using reservoir engineering methods
Based on domestic and international development experience of unconventional natural gas such as tight gas and shale gas, to obtain relatively reliable evaluation results, the minimum production time for gas wells to conduct EUR evaluation is 18-36 months [22], and dynamic data needs to be continuously incorporated to update EUR evaluation results. As a new type of unconventional natural gas for large-scale development, coal-rock gas wells generally have a short production history, insufficient dynamic data, and poor data quality. Therefore, multiple methods need to be combined to improve the accuracy of EUR evaluation. This paper applies Blasingame decline curve method [22], flowing material balance method [23], and production decline curve analysis which are applicable for single-well EUR evaluation. To ensure the reliability of calculation results, only gas wells with production time exceeding 300 days and approaching quasi-steady-state are selected for EUR evaluation, with well-by-well data quality control and outlier inspection applied.
Using the Blasingame decline curve, the average EUR of Type I wells is 57.28×10⁶ m3, that of Type II wells is 46.68×10⁶ m3, and that of Type III wells is 31.56×10⁶ m3. Weighted by the number of wells, the EUR is 46.90×10⁶ m3 (Table 1). Using the flowing material balance method, the EURs of Type I, II, and III wells are 57.46×10⁶, 46.95×10⁶, and 31.77×10⁶ m3, respectively. Weighted by the number of wells, the average EUR is 47.11×10⁶ m3.
Table 1. EUR evaluation results of coal-rock gas wells using three engineering methods |
| Well type | Number of wells | Propor-tion/% | EUR/104 m3 | |||
|---|---|---|---|---|---|---|
| Blasingame decline curve | Flowing material balance | Production decline curve | Ave. | |||
| I | 63 | 42 | 5 728 | 5 746 | 5 690 | 5 721 |
| II | 45 | 30 | 4 668 | 4 695 | 4 616 | 4 660 |
| III | 42 | 28 | 3 156 | 3 177 | 3 061 | 3 131 |
| Aver- age | 4 690 | 4 711 | 4 632 | 4 678 | ||
Analysis of production performance data shows that coal-rock gas wells exhibit hyperbolic decline characteristics. Based on the annual decline rates of different types of wells, and the first-year production allocation, the average daily production can be determined for each subsequent year, and the cumulative production can be used to estimate the EUR (Fig. 6). Decline curve analysis shows that the reasonable first-year production allocation for Type I wells is 55 000 m3/d, and the EUR is 56.90×10⁶ m3; for Type II wells, the reasonable first-year production allocation is 42 000 m3/d, and the EUR is 46.16×10⁶ m3; and for Type III wells, the reasonable first-year production allocation is 30 000 m3/d, and the EUR is 30.61×10⁶ m3. Weighted by the number of wells, the average EUR is 46.32×10⁶ m3 (Table 1).
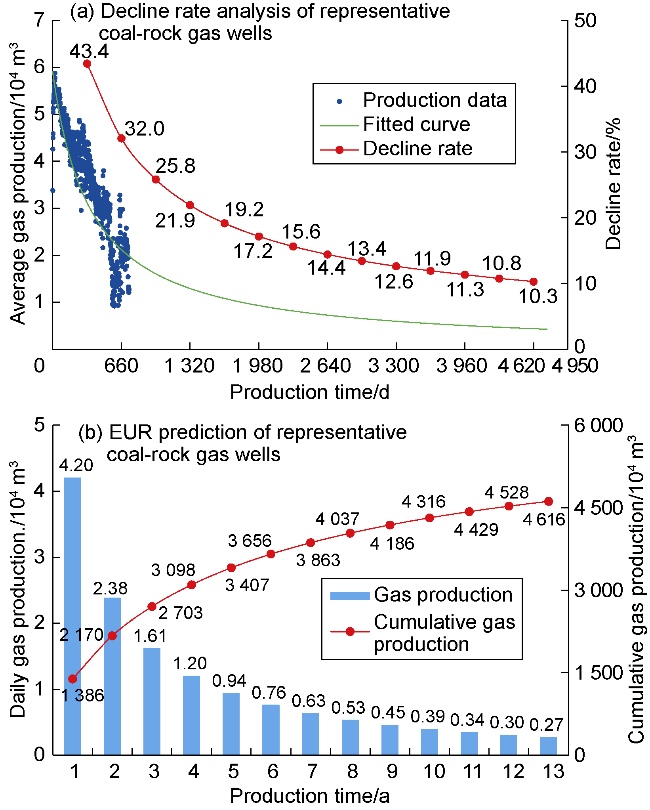
Fig. 6. Productivity evaluation of coal-rock gas wells using the decline-curve analysis. |
The average EUR from the above three methods is 46.78×10⁶ m3, which is basically equivalent to the 46.212 8×10⁶ m3 given by the aforementioned geological theoretical model (the basic triangular model). It should be noted that the result given by the triangular model is based on a 1 500 m-long horizonal section, but the actual horizontal section evaluated by the three methods is 1 300 m. Therefore, using the same horizontal section length, the EUR given by the reservoir engineering methods should be higher than that of the triangular model, indicating that the actual effective fracture network has a certain degree of upward convexity. Therefore, the productivity evaluation model is effective for evaluating the EUR of coal-rock gas horizontal wells. In field practice, the stimulation coefficient (the theoretical productivity estimation model) and the reservoir engineering methods should be used together to estimate the EUR of coal-rock gas wells.
3.5. Similarities and differences in production mechanisms of coal-rock gas and tight gas
The effective tight sandstone gas reservoirs in the Ordos Basin have strong heterogeneity, resulting in large differences in gas well performance. Taking Sulige Gas Field as an example, more than 20 000 vertical/directional wells show the EUR of gas well exhibits a broad distribution with pronounced polarization, ranging from 5×10⁶ m3 to 40×106 m3, with an average of 20.60×10⁶ m3. 40 gas wells produced cumulative gas exceeding 1×10⁸ m3, among which Well Su36-23-20 has the highest cumulative production. After being put into production in June 2009, Su36-23-20 has produced gas production of 252×106 m3 at 9 100 m3/d. Its cumulative production is more than 10 times the average EUR of gas wells in Sulige Gas Field. The large difference in EUR is essentially affected by strong reservoir heterogeneity [3]. Due to large variations in effective reservoir space and high uncertainty in gas well production, tight gas wells exhibit high production uncertainty, resulting in a certain “blind-box” effect. However, their key performance indicator can be constrained through analysis of large-sample datasets (Fig. 7).
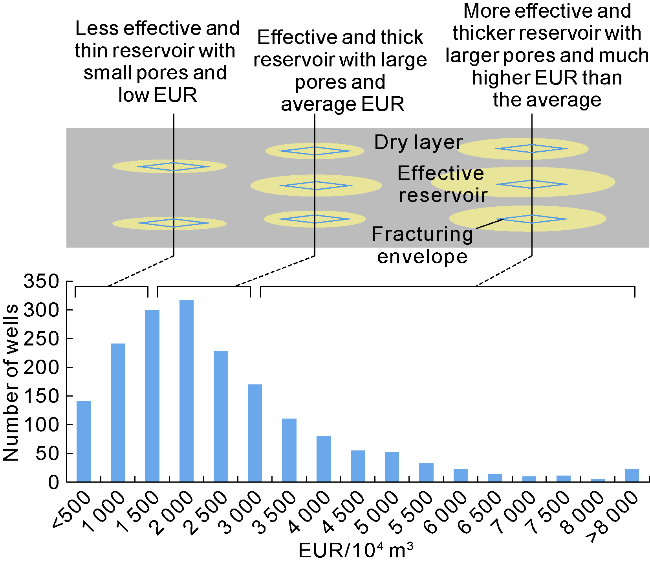
Fig. 7. Effective tight sandstone gas reservoirs and EUR distribution. |
Compared with tight gas, coal seams are stable and laterally continuous within a certain range, so gas well productivity mainly depends on the geological reserves controlled by effective fracture networks. Although there are differences in gas well indicators, EUR polarization of coal-rock gas horizontal wells is not obvious (Fig. 8). Evaluation shows that the main range of single-well EUR for Type I, II, and III wells is 31-57×106 m3 (Table 1), with an average of 46.78×10⁶ m3, estimated by reservoir engineering methods. Well JS10-8_H01 was put into production in January 2023 and has delivered the highest cumulative gas production up to 62.978×10⁶ m3 to date, and the EUR predicted is 105.38×10⁶ m3. Under uniform well spacing, the EUR of the extremely high-productivity well is only about twice the average EUR.
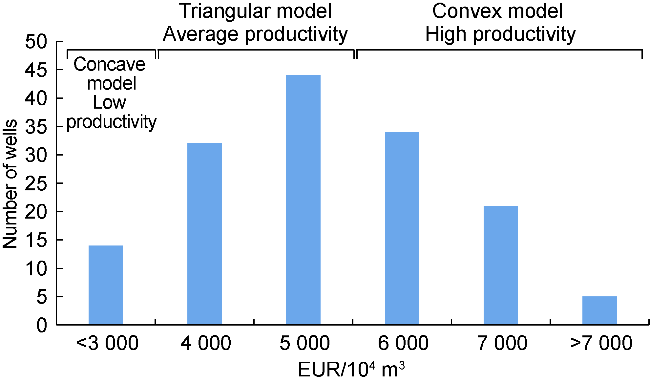
Fig. 8. EURs of deep coal-rock gas wells estimated by three productivity evaluation models. |
4. Key development technology and policies
4.1. Well pattern optimization and deployment
4.1.1. Well types
The 8# coal seam in the Benxi Formation is currently the primary target for coal-rock gas development. Comparison of technical and economic indicators such as first- year daily production, EUR, and input-output ratio of horizontal wells, deviated wells, and vertical/directional wells shows that all indicators of horizontal wells are superior to deviated wells and vertical/directional wells. Therefore, horizontal well is the suitable type for the development of coal seams. 5# coal seam and other coal seams are thin and have not yet been developed. Locally thicker seams can be developed using horizontal wells, whereas thinner seams should be developed in coordination with tight gas through vertical/directional wells.
Considering factors such as drilling technology, surface conditions, and efficient reserve utilization, it is more appropriate for 8# coal seam to adopt horizontal wells with single direction and small spacing. The horizontal orientation should be perpendicular to the maximum horizontal principal stress direction, nearly north-south. Gas content measurement shows that the middle-upper part of 8# coal seam has a high gas content. Tracer test after reservoir stimulation shows that the production contribution decreases from the middle-upper part, to the top, and then to the bottom. At the same time, it’s found that hydraulic fractures are more likely to propagate downward. Therefore, the trajectory of the horizontal well should be designed in the upper 1/3 of the coal seam [8].
4.1.2. Well pattern
According to the statistics of completed coal-rock gas horizontal wells, the horizontal section ranges from 512 m to 2 315 m, with an average of approximately 1 300 m. Considering current drilling capabilities and economic benefit sensitivity, the optimal horizontal section is recommended to be 1 500 m. In actual deployment, full consideration should be given to drilling technology progress. The average horizontal section length that 80% of single trips can achieve in the most recent round of completed wells should be used as the length for the next phase of deployment.
Artificial fracture monitoring on 11 coal-rock gas horizontal wells shows that fracture propagation ranges from 233 m to 367 m, with an average of 300 m. Pressure interference analysis during fracturing operations shows that in areas where natural fractures pronounce, at well spacing of 330-350 m, 15 of 58 fracturing stages showed interference but no crossflow, with an interference probability of 25.9%; in areas with underdeveloped natural fractures, at well spacing of 300 m, 111 fractured stages showed no fracturing interference. Production performance analysis shows that the average radius of well control in areas with pronounced natural fracture is 185 m, at a reasonable well spacing of 370 m; the average radius of well control in areas with underdeveloped natural fractures is 151 m, at a reasonable well spacing of 300 m. Synthesizing dynamic and static methods such as hydraulic fracture monitoring, pressure interference analysis, and production performance analysis, it is determined that the reasonable well spacing in pronounced fracture areas should be 350-400 m, and the reasonable well spacing in underdeveloped fracture areas should be 300-350 m.
4.2. Production strategy optimization
Shale reservoirs have obvious stress sensitivity, and currently adopt the pressure-controlled production method [24]. Development practices in Luzhou and Changning shale gas fields show that precise pressure-controlled production can effectively maintain formation energy, reduce damage to artificial fracture conductivity, thereby improving gas well production performance. Compared with "open-flow" production, pressure-controlled production can increase EUR by 13%-14%. Both coal-rock and shale reservoirs belong to plastic strata. Pressure-depletion production can cause damage to the conductivity of artificial fractures, so that subsequent productivity cannot be fully achieved, resulting in increased decline rate and significantly reduced EUR.
For coal-rock gas wells, pressure-controlled production should be adopted, and a scientifically reasonable and operable dynamic production allocation plan should be formulated. The following procedures are reasonable: 1. determine the production allocation based on the dynamic and static parameters of coal-rock gas wells, such as 6 500 m3/d per unit thickness (i.e., approximately 45 000 m3/d for a 7-m-thick coal-rock interval). 2. After being put into production, optimize the production allocation based on the pressure drop rate which should not exceed 0.015 MPa/d in the first 1-3 years, be no more than 0.005 MPa/d from the 4th to 10th years, and no more than 0.0005 MPa/d from the 11th to 20th years.
4.3. Low-cost development technology pathway
4.3.1. Enlightenment from the development of Sulige gas field
Development practices of Sulige Gas Field show that low-cost strategy is the key to achieving economic development of low-grade gas reservoirs [3,25 -26]. Guided by the concept of cost control and efficient enhancement, production in Sulige Gas Field has continued to increase, becoming a model for successful tight gas development. Its development model has further stimulated the exploitation of a series of tight-gas fields—such as Shenmu, Jingbian (the Upper Paleozoic gas reservoirs), Mizhi, and Jiaxian gas fields—playing a key role in enabling China to become the world’s largest producer of tight gas. Summarizing the development experience of Sulige Gas Field holds a significant value for achieving economically efficient development of coal-rock gas.
In the early development stage of Sulige Gas Field, after accurately evaluating key development indicators such as gas well EUR, the relationship between output and input was systematically evaluated based on the low gas price at RMB 0.66/m3 at that time. The development strategy of "facing reality, relying on technology, and taking the path of low-cost development" was proposed, the idea of "production driving cost to reduce" was determined, and the goal at reducing well investment from RMB 14 million to no more than 8 million was set up. The scientific development idea and effective control of development cost have promoted a continuous increase of gas production in Sulige Gas Field, making it the gas field delivering the highest gas production in China, achieving huge social and economic benefits.
4.3.2. Cost control and investment optimization of coal-rock gas reservoirs
Deep coal-rock gas development should follow the path of "production driving investment reduction, and low-cost strategy shaping supporting technologies". Currently, the comprehensive investment on a coal-rock gas horizontal well is approximately RMB 43.5 million. Based on the aforementioned average EUR of coal-rock gas wells, and at gas price of RMB 1.119-1.670/m3, coal-rock gas reservoirs are difficult to achieve economic development. Further reduction of comprehensive investment is necessary to achieve economic development. Effective cost reduction can be made following a "two-step" path. First reduce the single-well comprehensive investment to RMB 35 million, and then to RMB 30 million. Tight gas achieved large-scale development after reducing investment, and obtained good development results. Shale gas tried to reduce costs while developing, and encountered challenges. Coal-rock gas must learn the cost reduction experience from tight gas to achieve economic development.
5. Development potential and technology iteration and enhancement direction
5.1. Development potential
With enormous coal-rock gas resources, the Ordos Basin has the capacity to support development exceeding 5×10¹⁰ m3/a. The key to its development lies in economically efficient exploitation. With continuous advance of key technologies for coal-rock gas development in the future, resources outside 5# and 8# coal seams will be developed progressively, which can strongly support the achievement of the above production targets.
5.2. Key technology iteration and enhancement direction
Aiming at uncertainties of economic development and low primary recovery, this paper proposes directions for future advance and optimization of development technology.
5.2.1. Drilling rate optimization to shorten drilling cycle
With advancing drilling technology, the drilling cycle of a coal-rock gas horizontal well has kept being shortened. PetroChina Coalbed Methane Company Limited decreased the cycle from 68 d in 2021 to 26 d in 2024 (for an average 1 250 m-long horizontal section). PetroChina Changqing Oilfield Company used 41 d to finish a coal-rock gas horizontal well (with a 1 500 m-long horizontal section) in 2024, and expects to shorten to 30 d in 2025. In the future, with increasing rate of penetration, the cycle of a well with 1 500 m-long horizontal section will be no more than 25 d, which will greatly reduce the development cost.
5.2.2. Continuous exploration of long-lateral horizontal well drilling technology
Horizontal section is positively related to coal-rock gas production. An increase in horizontal section length leads to a higher EUR but also results in greater drilling costs. Increasing horizontal section, with assistance of technology advance and cost reduction is expected to bring good returns.
5.2.3. Iterative enhancement of effective fracture network stimulation volume
To obtain commercial gas flow, deep low-permeability coal-rock gas reservoirs require large-scale hydraulic fracturing. The effective stimulated reservoir volume (SRV) controls the gas drainage range of a gas well and directly affects the well productivity. Increasing effective SRV is important for achieving high production. Therefore, it is necessary to conduct geological-engineering integration, optimize stage and cluster design, innovate fracturing fluid system, and promote CO2 fracturing technology, etc., which can improve effective SRV by transforming the fracture network (the yellow dashed line in Fig. 5) from concave or triangular to convex structures. At the same time, a balance point among optimal seepage field, optimal production and economic benefits must be set to achieve investment-performance integration.
5.2.4. Deployment optimization of well pattern to improve recovery factor
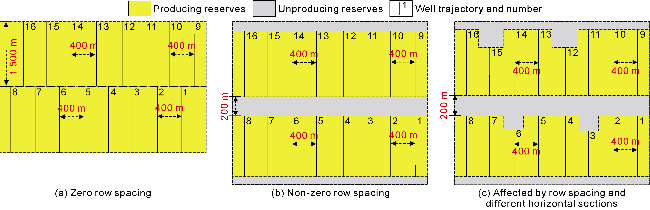
In the case of 1 500 m-long horizontal section, 400 m-wide well spacing, zero row spacing (Fig. 9a), 7 m-thick average reservoir, resource abundance at 2.18×10⁸ m3/km2, and single-well EUR of 46.212 8×10⁶ m3, the theoretical recovery of coal-rock gas predicted by the triangular model is 35%. Affected by factors such as target distance and inter-well interference, the actual row spacing is 200 m, and the recovery drops to approximately 31% because part of reserves cannot be produced (Fig. 9b). In actual deployment, it is difficult to ensure that all horizontal section lengths are 1 500 m, so reserves which are unable to produce increase under different horizontal section lengths (Fig. 9c), consequently decreasing recovery. Considering reserve loss caused by differences in row spacing and horizontal section length, the actual recovery is lower than the theoretical. Future development of coal-rock gas reservoirs should take multiple measures such as well pattern optimization and SRV enhancement to improve the recovery.
Fig. 9. Schematic diagram of well pattern optimization and deployment strategy for coal-rock gas development. |
6. Conclusions
The Ordos Basin holds enormous coal-rock gas, which is an unconventional natural gas resource with promising development prospects. Within a representative 12 000-km2 area in the eastern basin roughly centered on Yulin City, the 8# coal seam of the Benxi Formation contains estimated 3.08 × 10¹² m3 of gas resources, accounting for approximately 54% of the total resources in 10 coal seams in the Upper Paleozoic. This seam currently serves as the primary target interval. With the continuous progress of development technologies, other coal-rock intervals are expected to be economically developed and utilized.
Deep coal-rock gas reservoirs are characterized by low water saturation, high gas saturation, and high free gas proportion. Under the conditions of coal-rock burial depth of 2 000 m, porosity of 6.35%, free gas saturation of 95%, and total gas content of 22.13 m3/t, the proportions of free gas and adsorbed gas are approximately 40% and 60%, respectively.
According to the degree of volume fracturing stimulation, productivity models can be divided into three types: triangular, concave, and convex. The triangular model is the basic model for coal-rock gas well productivity evaluation. In the case of a 7 m-thick coal-rock reservoir, a 1 500 m-long effective horizontal section, and a 400 m-wide well spacing, the EUR evaluated by a triangular model is 46.212 8×10⁶ m3, which is basically consistent with the results from reservoir engineering methods, confirming the reliability of the productivity model.
Horizontal wells are a reasonable well type for efficient development of the 8# coal seam. The well spacing depends on the development of natural fractures. Pressure-controlled production is necessary, and production allocation should base on real pressure drop rate. Following the successful development experience from Sulige Gas Field, coal-rock gas development should pursue low cost, high rate of penetration, long horizontal section, large effective stimulated reservoir volume, and optimal well deployment to enhance the primary recovery and economic development.
Nomenclature
A—gas-bearing area, km2;
a, b—constant coefficients related to atom type in the van der Waals force formula, a = 5.96×10⁻³ kJ·nm6/mol, b = 11.5×10⁻⁶ kJ·nm12/mol;
C—coal-rock gas content, m3/t;
d—methane molecular diameter, 0.414×10⁻⁹ m;
EUR—estimated ultimate recovery of a gas well, m3;
Gi—resource amount of coal-rock gas, 108 m3;
h—coal thickness, m;
MCH4—methane molar mass, 16 g/mol;
NA—Avogadro constant, 6.022×10²³ molecules/mol;
n—amount of gas substance, mol;
p—gas pressure, Pa;
pi—average reservoir pressure, MPa;
psc—surface pressure, 0.1 MPa;
r—distance between two atoms, nm;
R—ideal gas constant, 8.314 J/(mol·K);
T—absolute gas temperature K;
Ti—reservoir temperature, 343.5 K;
Tsc—surface temperature, 293.5 K;
U—van der Waals potential energy, kJ /mol;
V—gas volume, m3;
Vi—volume of free gas stored in 1.0 t coal-rock reservoir underground, m3;
Vsc—volume of free gas stored in 1.0 t coal-rock reservoir aboveground, m3;
Zi—initial gas deviation factor, 0.91, dimensionless;
ρ—coal-rock density, 1.4 t/m3.