

Introduction
When examining various enhanced oil recovery (EOR) methods, we observe the widespread application of thermal, gas, hydrodynamic, and other physical methods for increasing oil recovery [1-8]. Chemical EOR methods constitute a relatively small share of the total operations, primarily due to the high cost of chemical reagents. Therefore, the development of these methods is closely linked to scaling up production to reduce the cost of chemical reagents. In fields with developed pressure maintenance systems, physicochemical enhanced oil recovery methods operate via two main mechanisms. The first mechanism involves increasing waterflooding efficiency by increasing the viscosity of the injected fluid or flow redistribution (polyacrylamides and hydrogels based on them) [9]. The second mechanism aims to improve residual oil displacement by adding surfactants to the injected water, which changes rock wettability and enhances oil solubilization processes. The most important factor for maximizing incremental oil production from chemical treatment (physicochemical EOR) is the proper consideration of the reservoir pore space structure [4,8]. Effective treatment design must account for a number of parameters, including the presence of natural fractures, well drainage efficiency, reservoir fluid properties, and well completion design.
The pore structure of productive reservoirs varies significantly across different fields. It is advisable to inject "strong" (surface-matured) gels into fractured structures, and gellants ("weak" compounds that form gels within the reservoir over time) into porous structures [4,10]. In field applications, chromium- or aluminum-based cross- linking agents are most commonly used for polyacrylamide (PAM) gelation, forming hydrogels with coordination covalent bonds. Complex organic cross-linking agents based on mixtures of formaldehyde with phenolic compounds [5,11], forming hydrogels through covalent bonds, are also used. Organic cross-linking agents prove particularly effective in fractured-porous and fractured reservoirs, as well as in high-temperature environments due to their enhanced stability [11-13]. For extreme temperature conditions, more expensive PAM copolymers incorporating acrylamide-tert-butyl sulfonic acid and N-vinyl-2-pyrrolidone are used to prevent macromolecular hydrolysis and maintain gel strength [4,9,14 -15]. The oscillatory rheometry can be used for a comprehensive evaluation of hydrogel viscoelastic properties, as this method provides a detailed characterization of both viscous and elastic deformation components [16-19]. The results of oscillatory studies characterize gel samples by their degree of "hardness-softness" using quantitative metrics, optimally selecting polymer-cross-linking agent combinations.
The application of surfactant compositions to increase the displacement coefficient continues to develop despite a number of unresolved challenges. The most successful field implementations have achieved residual oil saturations as low as 4%-5%. These projects, predominantly implemented in China, as well as project examples in the USA, Canada, Venezuela, India, and Oman [2,8,20 -21]. Patent analysis reveals two main research directions: achieving ultra-low interfacial tension at the surfactant-oil interface [22-23] and reducing surfactant adsorption in reservoirs [24-25]. Additional directions include addressing operational challenges in solution preparation and injection (especially in China) and reusing wastewater after surfactant flooding [26-28].
Among Russian research, the work of Shvetsov et al. [29] stands out, employing a two-stage polymer approach: initially using cross-linked PAM hydrogels to correct reservoir heterogeneity, followed by polymer flooding to optimize mobility ratios. Similar integrated enhanced oil recovery methods are implemented worldwide. Studies [30-32] described the successful application of dispersed cross-linked gels combined with surfactants in mature, high-water-cut fields. Micron-sized gel particles maintain surfactant effectiveness without interfering with interfacial tension reduction, thereby simultaneously improving both sweep efficiency and displacement efficiency. Alternative approaches propose combining colloidal dispersed systems with specialized surfactants for conformance control and oil mobilization [31]. The observed technological synergy arises from complementary mechanisms: soft granular agents (dispersed gel particles) normalize injection profiles, while surfactants mobilize residual oil. In fractured carbonate reservoirs, surfactant flooding efficiency is frequently compromised by reagent loss through fractures and high-permeability zones, pre-treatment with PAM gels effectively reduces fracture permeability, significantly improving surfactant coverage and reservoir contact [33-34]. These integrated technologies have demonstrated particular success in West Siberian fields. It is confirmed that integrated approaches yield substantially higher incremental oil production compared to individual hydrogel treatments [35], demonstrating a clear synergistic effect.
This work uses an integrated EOR process with conformance control before oil displacement. Firstly, the hydrogel selected by oscillatory rheometry is injected to effectively block high-permeability zones, followed by the sacrificial reagents to saturate the adsorption sites of the rock matrix, thereby reducing the adsorption of components from the main surfactant slug. Next, a mixture of anionic and non-ionic surfactants is injected to mobilize previously unswept residual oil, improve the oil washing efficiency, and reduce the residual oil saturation. Finally, a PAM solution containing diethanolamine is injected to desorb the surfactant and align the injection front. This process is systematically evaluated through core flooding tests and reservoir simulation.
1. Materials and methods
1.1. Materials
To form the hydrogel, polymers (PAM) of different molecular weights were used: low-molecular polymer grades A 523 (3.0×10⁶ g/mol, 20.0% degree of hydrolysis) and EOR 1141 (6.2×10⁶ g/mol, 24.5% degree of hydrolysis); high-molecular polymer grades A 345 (15.0×10⁶ g/mol, 15.0% degree of hydrolysis) and EOR 2517 (11.0×10⁶ g/mol, 9.8% degree of hydrolysis); and acrylamide-tert-butyl sulfonic acid copolymers A 689 T (22.0×10⁶ g/mol, 34.9% degree of hydrolysis) and AN125 SH (greater than 12.0×10⁶ g/mol, 25% degree of hydrolysis). The A 523, A 345, and A 689 T grades were produced by Anhui Tianrun Chemicals Co., Ltd. (China); EOR 2517 and EOR 1141 by Khimintech LLC (Russia); AN125 SH by SNF Floerger. Polymer purity ranged from 90% to 98%. Cross- linkers included chromium acetate (JSC "NZHS", Russia), resorcinol (1,3-dihydroxybenzene, CAS 108-46-3, Sumitomo Chemical, Japan), and paraformaldehyde (JSC "Uralchimplast", Russia), all qualified as "pure". To prepare the hydrogel, the calculated amount of polymer, paraformaldehyde and resorcinol are added to 100 mL of water with constant stirring using an overhead stirrer. Continue stirring at high speed (1 400-1 600 r/min) for approximately 5-10 min until the components are evenly distributed throughout the container without forming lumps or clumps, then reduce the speed (1 000-1 200 r/min) and stir for 30-50 min. When using chromium acetate as a crosslinker, it is added to the solution after the polymer is completely dissolved and stirred for several minutes.
The study employed both bulk organic synthesis products - nonylphenol (Neonol AF9-6, PJSC "NKNH", Russia) as non-ionic surfactant, and alpha-olefin sulfonate (AOS, C14-C16 compounds, Handom Chemicals, China) - and industrially synthesized anionic surfactants. The latter included petroleum sulfonates from aromatic extracts of petroleum fractions sulfonated with N-methyl- 2-pyrrolidone or phenol, plus mixtures of sulfonated monoalkyl/dialkylphenols and alkyltoluenes derived from phenol/toluene alkylation with C8 oligomerizate. Detailed synthesis and properties are described in Reference [36]. The sacrificial agents were formulated using non-ionic surfactant with lignosulfonates or with diethanolammonium salt of tall oil fatty acid sulfoester [37-38]. Cost reduction relating to these agents was achieved through two complementary approaches: using affordable forestry byproducts and diethanolamine [39] for adsorption control, and developing surfactants from accessible petrochemical feedstocks and bulk synthesis products.
The surfactant compositions used in the work included: Surfactant 1 [40], a mixture of ethoxylated nonylphenol and fatty alcohol sulfoethoxylates (commercial name Sulfanor B2); Surfactant 2 [36], a mixture of ethoxylated nonylphenol and petroleum sulfonates, plus mixtures of sulfonated monoalkyl/dialkylphenols and alkyltoluenes derived; Sacrificial Agent 1 [41], a mixture of ethoxylated nonylphenol with lignosulfonates; and Sacrificial Agent 2 [42-43], a mixture of ethoxylated nonylphenol with diethanolammonium salt of tall oil fatty acid sulfoester.
1.2. Oscillatory rheometry
Rheological parameters of gels (elastic modulus and viscous modulus (G° and G)) were obtained on a Thermo Scientific Haake Mars III rheometer (Germany) in CS mode (measurements with shearing stress control) using a plane-to-plane measuring system with rotor and plane diameters of 60 mm (P 60/Ti). Shear stress (τ), viscosity (µ), and complex shear modulus (G*) were measured on a precision rheometer over a wide range of shear strain rates. Oscillatory experiments were performed at a frequency of 1 Hz with shearing stress sweep (variation range from 0 to 300 Pa). The results were processed using RheoWin4Job Manager software, version 4.88.0002.
To determine the complex modulus of deformation, the mode of rotational sinusoidal oscillations τsin(ωt) with increasing amplitude τ in the range from 0.1 Pa to 300.0 Pa was created. The strain γ also occurs according to sinusoidal dependence with a phase lag (δ), i.e. γsin(ωt+δ). The device outputs the phase shift δ between τ and γ during the oscillatory motion of the disk, and the complex modulus G* and its components (elastic modulus G° and viscous modulus G").
$\tau=G^{*} \gamma$
$G^{*}=G^{\prime}+\mathrm{i} G^{\prime \prime}$
$\left|G^{*}\right|=\left(G^{2}+G^{\prime \prime 2}\right)^{0.5}$
The linear viscoelastic region (LVR) was determined by the rheometer program based on the measured data G°. In this region, stress is directly proportional to strain, meaning the material exhibits elastic behavior without structural breakdown. Physically, this corresponds to the onset of significant loss of elasticity with increasing stress. This enables investigation of the gel's internal structure without causing damage. Comparison of LVR ranges allows evaluation of elastic properties across different gels and provides insight into their structural strength and stability. The elastic modulus G° and viscous modulus G values for the studied gels were obtained specifically within the LVR. Both G° and G are tabulated by the rheometer as a function of the shear stress τ, and they respectively display the elastic properties of the medium and the energy losses associated with viscous friction. When the crossover point is reached (the intersection of lines G° and G), the body loses its elastic properties and becomes a fluid medium (liquid).
During the experiments, several measurements were made for each hydrogel sample (usually 3 measurements; in case of significant fluctuations in the obtained values, 4). The obtained measurement results were averaged, and the standard deviation value was calculated for each obtained parameter. The calculated values of standard deviations were in the range of 2%-12%, which is not small. However, more precise determinations are not possible due to the heterogeneity of the cross-linked structure of the hydrogel, the presence of defects in the skeleton of the polymer macromolecule and the randomness of the resulting cross-linking bridges. If the obtained values exceeded 12%, then such a measurement was considered a "miss", and additional measurements were carried out.
1.3. Optical methods
Phase behavior analysis for microemulsion employed an Olympus Fluoview FV3000 confocal microscope in fluorescence mode, using phase-specific dyes: Sudan III for oil phase and Uranin A/fluorescein sodium salt for aqueous phase. Imaging parameters were set as: for Sudan III, 561 nm excitation laser with Su3 filter (570-650 nm emission); for fluorescein, 488 nm laser with fluo-4 filter (487-567 nm emission). Images were captured both filtered and unfiltered. With the galvanometer scanner and Olympus super resolution technology (FV-OSR), we can obtain resolutions down to 120 nm with a high signal-to-noise ratio. Considering that the measured microdroplets sizes are in the µm range, the error in determining the sizes is less than 2%.
Surfactant effectiveness was evaluated using an operational indirect method quantifying residual oil film removal efficiency. An adsorbed oil layer was formed on glass, aged in oil (30 min, 25 °C), then immersed in surfactant solution monitored the kinetic process of oil film detachment (i.e., the restoration of slide transparency) using a photometric instrument [44]. The recovered light transmission curve's tangent slope provided an effective constant characterizing surfactant cleaning ability.
1.4. Core flooding tests
To simulate surfactant composition behavior under reservoir thermobaric conditions, core flooding experiments were conducted using formation water models. Core material preparation (composite models 14-18 cm long, 3 cm diameter individual samples) and flooding studies were performed in accordance with Russian Industry Standard [45]. Core flooding tests were carried out using the SMP-PS/FES-2P setup (Reservoir modeling system for studying reservoir porosity and permeability during two-phase flow, LLC "Kortech", Moscow region, Mytishchi, Russia; Software number SMP-PS/FES-2P) on linear and parallel multi-permeability reservoir models composed of core samples from productive reservoirs of two oil fields in the West Siberian and Volga-Ural oil provinces. Considering that the experiments are long (at least 14 d) and labor-intensive, and core deterioration may impede data repeatability, a test using the same surfactant system and cylindrical rock samples and under the same experimental conditions was repeated for three times in this work. Even though the rock properties would change during the research cycle due to the effect of high pressure, saturation of the rock with formation fluids, and washing out of residual oil in a Soxhlet apparatus. When performing a specially designed absolutely identical study three times, the standard deviation of the obtained oil displacement coefficient (Kd) was less than 5% of the value.
For the West Siberian oil province (including the Neocomian BS reservoir in the Kholmogorskoye oilfield, and the Callovian-Oxfordian Yu1 reservoir in the Nizhneluginetskoye oilfield), the formation water characteristics were: salinity 16 g/L, hardness 11.6 mmol/L, density ρ27°C = 1.005 g/cm3, ρ90°C = 0.974 g/cm3, with the following composition (in mass fractions) of MgCl2·6H2O (0.03%), CaCl2 (0.11%), NaHCO3 (0.06%), NaCl (1.42%) and H2O (98.38%). The oil viscosity was low (dynamic viscosity less than 1 mPa·s at 88 °C). Tests used either dehydrated reservoir oil (density ρ29°C=0.867 g/cm3; ρ90°C=0.822 g/cm3) or synthetic isoviscous oil with similar properties. Test conditions maintained reservoir pressure at 27 MPa and temperature at 88 °C, with constant fluid flow rate of 3 cm3/h. For the Volga-Ural oil province (Timan horizon of the Zarechnoye oilfield), the formation water showed higher salinity (290.9 g/L), hardness 1 428.3 mmol/L, density ρ29°C = 1.188 g/cm3, with composition of MgCl2·6H2O (1.39%), CaCl2 (6.20%), NaHCO3 (0.01%), NaCl (21.38%) and H2O (71.02%). Reservoir temperature was lower (29 °C) and dynamic viscosity of the isoviscous oil model was 10 mPa·s (density ρ29°C = 0.881 g/cm3). Test conditions maintained reservoir pressure at 16.2 MPa and temperature at 29 °C, with constant fluid flow rate of 3 cm3/h.
For linear models in the West Siberian oil and gas province, core flooding test was performed as follows: after residual oil saturation in the model (more than four pore volumes) was achieved, a surfactant composition was injected into the model at a volume of 1.0 pore volume (PV). Water injection was resumed and continued until oil displacement parameters stabilized. This technique allowed us to determine the oil displacement coefficiency in porous media models after surfactant injection, both with and without pretreatment with a sacrificial agent (as well as with only a sacrificial agent).
For the linear models (for the Volga-Ural oil province), we injected 0.3 PV of the formation water. In the parallel reservoir models, we injected 0.3 PV of the selected hydrogel (formulated using AN 125 SH-grade sulfonated polymer). Following injection, the experimental setup was maintained at reservoir temperature for 1 h to allow for proper technological settlement. After this operational pause, 0.5 PV surfactant was injected into each model. Subsequently, water injection was resumed and continued until oil displacement parameters stabilized. This methodology enabled determination of oil displacement efficiency and water phase permeability in the conditions both with and without hydrogel pretreatment. In addition, two reference core flooding tests were performed to evaluate the superiority of the integrated EOR process using the linear models for the Volga-Ural oil province. In Experiment 1, only Surfactant 2 was injected to the model; while in Experiment 2, the integrated EOR process was adopted by injecting water, hydrogels, sacrificial agents, surfactants, PAM and diethanolamine solutions. In these experiments, oil displacement efficiency, pressure gradient and oil saturation were monitored.
The geometric characteristics of pore channels were determined through capillary pressure measurements. Capillary pressure curves were obtained using a B32-32 capillary pressure apparatus (Amplitude Scientific and Technical Center) following Industry Standard [46]. Cylindrical rock samples from the Zarechnoye oilfield (3.0 cm diameter, 2.5-4.5 cm length) prepared according to State Standard [47] were used to establish the water saturation-capillary pressure relationship. Prior to testing, both the ceramic membrane and samples were saturated with formation water of specified salinity. The resulting water saturation versus capillary pressure curves enabled determination of pore size distribution and flooded pore quantification.
1.5. Study of dynamic locking on a micromodel
Micromodels have been traditionally employed for studying micellar solution displacement mechanisms [48]. In this work, microemulsion flow experiments were conducted in glass cylindrical capillaries connected to a HAAKE MARS III rheometer. Flow was induced by applying pressure differentials (50, 100, 200 kPa) at the capillary inlet while maintaining atmospheric pressure at the outlet. Effluent volume was measured using an HM 200 precision balance with RS-Weight software. Flow patterns were recorded using a Canon DM-XM2 digital camera coupled to a Stemi-2000C microscope [49], with video capture managed by VirtualDub software. To minimize water evaporation, machine oil was layered atop the aqueous phase. Scale readings and video images were temporally synchronized for subsequent analysis.
1.6. Reservoir simulation
The three-dimensional modeling and numerical simulation were of the development site under enhanced oil recovery treatment was performed (by Gazpromneft-Vostok) in the Nizhneluginetskoye oilfield. These jobs used the Tempest More software package (version 7.0.1, ROXAR). Simulations were conducted on an updated hydrodynamic model based on the latest field development plan, incorporating geological data as of January 1, 2023. The baseline forecast scenario maintained constant bottomhole flowing pressure (BHFP) in both production and injection wells throughout the three-year forecast period (January 2023 to January 2026). The model employed a grid system with cell dimensions of 50 m × 50 m × 0.4 m, comprising 67×74×70 cells in total.
2. Results and discussion
2.1. Hydrogel selection using oscillatory rheometry
The oscillatory measurement method provides visual and quantitative representations of the rheological properties of hydrogels when the amplitude of a sinusoidally varying shear stress is scanned. The excess of the elastic modulus over the viscous modulus indicates the strength of three-dimensional intermolecular bonds cross-linking the polymer macromolecules [50-51]. The measurement results presented in Table 1 demonstrate that all polymers cross-linked with both inorganic cross-linker (chromium acetate) and organic cross-linker (resorcinol-paraform) form functional hydrogels suitable for conformance control applications. This suitability is confirmed by the consistent excess of elastic modulus compared to viscous modulus. The pronounced elasticity of these gels enables effective blocking of highly permeability filtration channels.
Table 1. Rheological parameters of cross-linked polymeric compositions in fresh water |
| No. | Polymer and cross-linker | Polymer molar mass/ (106 g·mol−1) | Reagent mass fraction/% | Average values of hydrogel parameters | |||
|---|---|---|---|---|---|---|---|
| Gelation time/min | Upper limit stress for LVR/Pa | Elastic modulus/Pa | Viscous modulus/Pa | ||||
| 1 | EOR 2517 | 11.0 | 0.500 | 60 | 1.796 | 3.714 | 1.038 |
| CA | 0.100 | ||||||
| 2 | А 345 | 15.0 | 0.500 | 140 | 1.563 | 2.089 | 0.836 |
| CA | 0.100 | ||||||
| 3 | EOR 2517 | 11.0 | 0.500 | 360 | 2.672 | 2.597 | 1.004 |
| Paraform | 0.044 | ||||||
| Resorcinol | 0.015 | ||||||
| 4 | А 345 | 15.0 | 0.500 | 240 | 2.518 | 3.124 | 1.349 |
| Paraform | 0.044 | ||||||
| Resorcinol | 0.015 | ||||||
| 5 | А 345 | 15.0 | 1.000 | 70 | 4.592 | 8.094 | 2.768 |
| CA | 0.200 | ||||||
| 6 | А 345 | 15.0 | 1.000 | 125 | 9.723 | 13.870 | 4.239 |
| Paraform | 0.088 | ||||||
| Resorcinol | 0.030 | ||||||
| 7 | EOR 1141 | 6.2 | 0.500 | No gel formation | 0.602 | 0.258 | 0.546 |
| CA | 0.100 | ||||||
| 8 | А 523 | 3.0 | 0.500 | No gel formation | 0.802 | 0.507 | 0.634 |
| CA | 0.100 | ||||||
| 9 | EOR 1141 | 6.2 | 0.500 | 360 | 2.191 | 1.894 | 1.606 |
| Paraform | 0.044 | ||||||
| Resorcinol | 0.015 | ||||||
| 10 | А 523 | 3.0 | 0.500 | 360 | 3.100 | 3.154 | 1.876 |
| Paraform | 0.044 | ||||||
| Resorcinol | 0.015 | ||||||
| 11 | EOR 1141 | 6.2 | 1.000 | 240 | 3.110 | 2.829 | 2.106 |
| CA | 0.200 | ||||||
| 12 | EOR 1141 | 6.2 | 1.000 | 240 | 9.052 | 9.653 | 4.938 |
| Paraform | 0.088 | ||||||
| Resorcinol | 0.030 | ||||||
| 13 | А 523 | 3.0 | 1.000 | 240 | 6.096 | 6.872 | 2.918 |
| CA | 0.200 | ||||||
| 14 | А 523 | 3.0 | 1.000 | 240 | 15.230 | 15.785 | 5.924 |
| Paraform | 0.088 | ||||||
| Resorcinol | 0.030 | ||||||
| 15 | А 689 Т | 22.0 | 0.500 | 360 | 3.392 | 3.452 | 1.334 |
| CA | 0.100 | ||||||
| 16 | А 689 Т | 22.0 | 1.000 | 70 | 11.915 | 12.100 | 3.550 |
| CA | 0.200 | ||||||
| 17 | А 689 Т | 22.0 | 0.500 | 360 | 6.686 | 6.697 | 1.935 |
| Paraform | 0.044 | ||||||
| Resorcinol | 0.015 | ||||||
| 18 | А 689 Т | 22.0 | 1.000 | 180 | 26.740 | 25.560 | 5.590 |
| Paraform | 0.088 | ||||||
| Resorcinol | 0.030 | ||||||
| 19 | АN 125 SH | 12.0 | 1.000 | 180 | 3.621 | 6.065 | 3.095 |
| CA | 0.200 | ||||||
| 20 | АN 125 SH | 12.0 | 1.000 | 360 | 9.588 | 12.020 | 4.866 |
| Paraform | 0.088 | ||||||
| Resorcinol | 0.030 | ||||||
Note: "Average values of hydrogel parameters" are average values reliably established based on the results of three or more measurements; CA = chromium acetate; paraform = paraformaldehyde. |
The upper limit stress for LVR and elastic modulus values in compositions cross-linked with organic cross- linkers exceed those of inorganic cross-linkers, at polymer mass fractions ranging from 0.5% to 1.0%. This trend is invalid with the single exception being gels based on EOR 2517 polymer (may be related to the polymer composition), i.e. samples 1 and 3. This can be explained by the fact that covalent bonds generally possess higher bond energy compared to ionic bonds. As shown in Fig. 1, metal-ion-cross-linked gels (e.g. CA), which form ionic bonds with polymer carboxyl groups (Fig. 1a), usually exhibit short gelation times at temperatures above 60 °C and demonstrate poor thermal stability. In contrast, polymer gels cross-linked with organic cross-linkers that form covalent bonds with amide groups in polymer chains (Fig. 1b) display superior thermal stability and extended gelation times, even at elevated temperatures. These findings demonstrate that organic cross-linkers produce more rigid gels, making them particularly suitable for application in fractured and porous-fractured reservoirs. This pattern remains consistent across both low-molecular-weight and sulfonated polymer samples. Notably, 0.5% EOR 1141 and 0.5% A 523 PAMs failed to cross-link with inorganic cross-linkers but successfully gelled with the complex organic cross-linkers (samples 7-10). For non-cross-linked polymer solutions, the viscous modulus substantially exceeds the elastic modulus (samples 7 and 8). Particularly significant is the successful cross-linking of sulfonated polyacrylamides with organic cross-linkers, which substantially expands the method's applicability to high-temperature reservoirs. Sulfonated polyacrylamides inherently exhibit superior temperature resistance [4,9,14 -15], and cross-linking with resorcinol-paraform provides additional stabilization against thermal degradation [11-13]. Due to the high-salinity formation water and relatively low formation temperature in the Volga-Ural oil province, hydrogel No. 6 from Table 1, which can rapidly crosslink to form a plug, was selected. In contrast, for the high-temperature formations of the West Siberian oil province, a polymer with higher thermal stability (Table 1, hydrogel No. 20) was chosen.
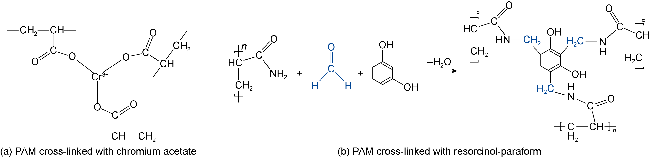
Fig. 1. Mechanisms of PAM cross-linking with various cross-linkers. |
The elastic modulus provides the most practical parameter for matching hydrogel mechanical properties to reservoir pore structure characteristics. For optimal performance, we recommend the following elastic modulus ranges: for porous reservoirs, hydrogels should demonstrate values between 2.0 Pa and 4.0 Pa; fractured-porous reservoirs require intermediate values of 4.0 Pa to 8.0 Pa; while fractured reservoirs demand the stiffest gels with elastic modulus ranging from 8.0 Pa to 25.0 Pa. Within these broad categories, the exact hydrogel specifications should be further refined based on detailed reservoir characteristics, particularly permeability measurements and quantitative fracture aperture data. Additionally, the gelation time of cross-linked compositions allows for accurate prediction of barrier placement relative to the injection well perforation interval. When combined with pore structure data from geophysical studies, this enables rational selection of hydrogel stiffness and volume for effective flow diversion.
2.2. Selection of surfactants
2.2.1. Microemulsion evaluation through fluorescence microscopy analysis
There are several general requirements for surfactants used in oil recovery enhancement technologies: they must possess solubilization ability for residual oil, demonstrate compatibility with reservoir fluids without forming viscous phases (as these reduce stimulation efficiency and complicate oil processing); exhibit low adsorption on reservoir rock; and maintain surface activity under reservoir conditions. The success of surfactant selection depends on their ability to spontaneously form either a middle-phase microemulsion of Type III (Winsor classification) or a low-viscosity microemulsion of Type I with aqueous external phase upon contact with reservoir oil under target thermobaric conditions, while avoiding formation of viscous inverted emulsions of Type II. In addition, for reducing the surfactant adsorption in reservoirs, low-mineralized or fresh water can be injected to displace hardness ions from the near-wellbore area. Alternatively, sacrificial agents are employed for reservoir pre-treatment to reduce the adsorption of both hydrogels and surfactants, thus for avoidance of undesirable viscous inverted emulsions.
As an effective surfactant composition for enhanced oil recovery and residual oil washing, we examined a formulation previously reported by other researchers (used as Surfactant 2 in this work) [36,52 -53]. This is a mixture of nonionic and anionic surfactants with a synergistic effect. Experimental data showed that the viscosity of the isolated middle-phase microemulsion (1.5-2.0 mPa·s within the 60-90 °C temperature range) closely matched the viscosity characteristics of crude oils under actual reservoir conditions in multiple Western Siberian fields. This viscosity correspondence demonstrates two key advantages: absence of undesirable Type II inverse emulsions (Winsor classification) upon interaction with formation oil, and strong potential for effective reservoir stimulation through this surfactant formulation. When evaluating the phase behavior and low viscosity of the middle microemulsion phase formed by this surfactant composition in oil/brine systems, researchers might initially classify it as Winsor Type III based solely on two observed characteristics: (1) the presence of a distinct middle layer and (2) ultra-low interfacial tension (IFT) between oil and water phases [53-56], where both fluids behave as isotropic phases with near-zero IFT. However, these features cannot definitively confirm this classification [57]. Through direct microstructural observation, we demonstrate an unambiguous method to determine the true nature of the middle layer's structure in oil/brine systems by visually identifying the internal (dispersed) and external (continuous) phases.
The structural characteristics of the microemulsion phase were conclusively determined through fluorescence microscopy. Two distinct fluorescent markers provided complementary visualization approaches: Sudan III clearly differentiated emulsion types through its distinct color patterns - red droplets against a dark background indicating oil-in-water emulsions, versus a continuous red phase characteristic of water-in-oil inverted emulsions; Uranin A produced inverse contrast patterns, with dark oil droplets visible against a bright green background for oil-in-water systems, or conversely, green aqueous droplets appearing against a dark background in water-in-oil configurations.
The fluorescence microscopy analysis revealed distinct microstructural characteristics of the emulsion system Winsor I (Fig. 2). Micrographs acquired through the fluo-4 filter in luminescent mode clearly show black oil droplets (dispersed phase) suspended within a green- tinged aqueous dispersion medium (Fig. 2a). Complementary imaging through the Su3 filter (both in standalone and combined modes) consistently displays dark red oil droplets against their respective backgrounds (Fig. 2b-2c).
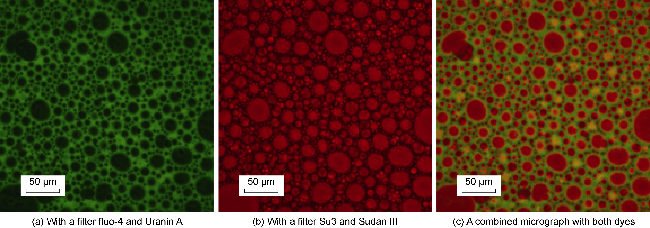
Fig. 2. Micrographs of the medium layer of a microemulsion. |
The pore network characteristics were determined through rigorous capillary metering techniques employing the semi-permeability membrane method. Table 2 presents the comprehensive pore channel size distribution data for three representative core samples obtained from the target reservoir in the Zarechnoye oilfield. Analysis of the pore channel distribution reveals that the predominant fraction (majority) exhibits opening sizes exceeding 2.92 µm (more than 70%), with a significant proportion of channels measuring greater than 9.13 µm in diameter.
Table 2. Size distribution of pore channels in natural core samples taken from the target reservoir in Zarechnoye oilfield |
| No. | Distribution of pore channels with different diameter ranges in natural core samples/% | |||||||||
|---|---|---|---|---|---|---|---|---|---|---|
| <0.12 µm | 0.12-0.15 µm | 0.15-0.18 µm | 0.18-0.24 µm | 0.24-0.37 µm | 0.37-0.73 µm | 0.73-1.46 µm | 1.46-2.92 µm | 2.92-9.13 µm | >9.13 µm | |
| 1 | 10.6 | 0.1 | 0.1 | 0.8 | 2.2 | 2.6 | 1.8 | 1.8 | 35.1 | 44.9 |
| 2 | 11.6 | 0.3 | 0.5 | 1.1 | 2.4 | 2.3 | 1.3 | 3.3 | 40.1 | 37.1 |
| 3 | 13.4 | 0.8 | 0.6 | 0.4 | 3.3 | 3.5 | 2.6 | 1.6 | 55.2 | 18.7 |
| av. | 11.9 | 0.4 | 0.4 | 0.8 | 2.6 | 2.8 | 1.9 | 2.2 | 43.5 | 33.5 |
The analytical capabilities of the fluorescence microscopy software enabled precise quantification of microemulsion droplet size distributions within the studied surfactant formulations. These dimensional parameters are particularly valuable for comparative analysis with pore channel geometries in porous media flow systems. The comparative microdroplet size data for various surfactant compositions/sacrificial agents are systematically presented in Table 3, enabling direct evaluation of the droplet-to-pore size relationships critical for effective reservoir stimulation. It should be noted that the droplet size estimation depends on the type of dye. This is particularly evident in the case of Sacrificial Agent 1 when Sudan III dye is used, where droplets appear noticeably larger compared to those stained with Uranin A.
Table 3. Summary of the average sizes of microdroplets obtained using a confocal microscope |
| No. | Chemical agent | Average size of microdroplets/µm | ||
|---|---|---|---|---|
| 0.1% Uranin A | 0.3% Sudan III | 0.1% Uranin A+ 0.3% Sudan III | ||
| 1 | Anionic surfactant only | 9.4 | 6.1 | |
| 2 | Surfactant 1 | 10.3 | 6.8 | 7.4 |
| 3 | Surfactant 2 | 6.8 | 5.8 | 5.0 |
| 4 | Sacrificial Agent 1 | 7.9 | 20.1 | 8.8 |
| 5 | Sacrificial Agent 2 | 4.8 | 4.6 | 6.8 |
Note: The experimental system contains oil and water phases, 5 mL each, with surfactant mass fraction of 3%; average size of microdroplets is calculated based on a sample of 80% of the detected microdroplets. |
The comparison between the observed sizes of microdroplets, formed under the influence of surfactants, and pore channels is of critical importance. If the average pore channel sizes exceed the droplet sizes, dynamic flow blocking occurs, leading to a significant reduction in flow through the porous medium. Conversely, if the droplet sizes are larger, the emulsion breaks down and functions as a surfactant rim during flow. This is clearly demonstrated by the increased permeability in a water-saturated porous medium following the flow of such an emulsion. Under reservoir conditions, this mechanism would result in oil displacement from low-permeability pore channels while simultaneously blocking previously water-flushed channels. A comparison of the data in Tables 2 and 3 shows that virtually all average oil droplet sizes in microemulsions (rows 2 and 3 in Table 3) are comparable to the predominant pore sizes in the core material. When discussing sacrificial agents, for example, Sacrificial Agent 1, which forms larger droplets, exhibits a greater impact on sweep efficiency during core flood tests. In contrast, Sacrificial Agent 2 penetrates deeper into the oil-bearing formation. Consequently, it more effectively protects the primary surfactant composition from adsorption onto the reservoir rock. This explains why, with Sacrificial Agent 2, the increase in the oil displacement coefficient by water is 1-2 percentage points higher than with Sacrificial Agent 1 [41-43]. It is worth noting that the role of pore channel size distribution plays an important role in reagent selection and efficiency evaluation [58].
2.2.2. Residual oil washing
The selection of surfactant composition is also guided by an analysis of the formal kinetics of oil film washing with a specific surfactant solution at 25 °C, as well as the IFT at the surfactant solution/crude oil boundary at 88 °C (reservoir temperature of the target Neocomian BS reservoir, Kholmogorskoye oilfield). Table 4 presents the effective constants for residual oil film washing using various surfactant compositions.
Table 4. Results of physical-chemical testing of surfactant compositions in formation water |
| No. | Component | Relative mass fraction/% | IFT at the surfactant mass fraction of 0.5%/(mN·m−1) | Effective constant of oil film sashing |
|---|---|---|---|---|
| 1 | Anionic surfactant | 100 | 0.094 | 0.0016 (R2 = 0.785) |
| 2 | Non-ionic surfactant | 100 | 5.850 | 0.0140 (R2 = 0.886) |
| 3 | Surfactant 1 | 100 | 0.080 | 0.0750 (R2 = 0.943) |
| 4 | Surfactant 2 | Anionic type: 40 | 0.006 | 0.0027 (R2 = 0.816) |
| Non-ionic type: 60 | ||||
| 5 | Surfactant 2 | Anionic type: 66 | 0.027 | 0.0270 (R2 = 0.868) |
| Non-ionic type: 34 | ||||
| 6 | Surfactant 2 | Anionic type: 37 | 0.005 | 0.0010 (R2 = 0.599) |
| Non-ionic type: 55 | ||||
| Mixture of alcohols: 8 |
Note: "Mixture of alcohols" is incorporated to prevent this formulation from freezing when it is used in Russian oilfields where the winter is extremely cold. |
The selected mixtures of nonionic and anionic surfactants demonstrate superior performance compared to individual surfactants in displacing residual oil. In nonionic surfactants (based on nonylphenols), the solubilization of aromatic compounds is more pronounced than in anionic surfactants, typically increasing with the degree of oxyethylation. The addition of electrolytes and elevated surfactant concentrations promotes higher micellar aggregation numbers, thereby enhancing oil solubilization and waterflooding displacement efficiency. The mechanism of oil solubilization differs between individual surfactants and mixed micelles. This occurs because, in the presence of anionic surfactants, nonionic surfactants exhibit behavior analogous to weak cationic surfactants. Even small amounts of nonionic surfactants reduce ion-electrostatic interactions between anionic surfactant molecules within micelles, though this does not lead to increased micellar aggregation numbers. Instead, cationic surfactant associations form through the capture of counterions (Me+) by nonionic surfactant molecules. The synergistic mechanism of anionic-nonionic surfactant mixtures involves the flexible open chain of nonionic surfactants binding with counterions in solution. Structurally, ethoxylated nonionic surfactants resemble macrocyclic polyethers (crown ethers); enabling them to encapsulate metal cations and effectively form associated cationic surfactant complexes. These complexes are stabilized by electrostatic interactions with electron-donating polar groups of anionic surfactants. The resulting charged complexes exhibit greater volume compared to original metal cations and create a shielding effect at micelle surfaces, preventing water contact. This phenomenon underlies the synergistic effect of the surfactant mixture [59].
As revealed in Table 4, the IFT of Surfactant 2 is one order of magnitude lower than that of Surfactant 1, especially at the anionic/nonionic surfactant mass ratio of 2 : 3, the surfactant composition yields the minimum IFT, and remains a superior IFT performance when added with mixture of alcohols during industrial preparation.
2.3. Core flooding tests of chemical compositions on natural cores under reservoir thermobaric conditions.
To verify the synergistic effect between sacrificial agents and primary surfactants, core flooding tests were conducted on linear models for Kholmogorskoye oilfield in the West Siberian oil province. Three schemes were designed: (1) injection of 0.1 PV Sacrificial Agent 1, followed by 1 PV Surfactant 2, with Kd increased by 16.5 percentage points as compared to waterflooding (Fig. 3); (2) injection of 1 PV surfactants without a sacrificial agent, followed by a polymer solution containing diethanolamine (a mild organic alkaline agent), demonstrating a 12.1-percentage-point increase in Kd after waterflooding; and (3) injection of only 1 PV Sacrificial Agent 2, registering an increase of Kd merely by 1.8 percentage points, which indicates a limited oil-displacement capability of the sacrificial agents themselves. However, these agents enhance the effectiveness of the oil displacement formulation through pre-saturation of rock surface adsorption sites and preparation of the pore space for subsequent exposure to the primary surfactant composition. To minimize adsorption of the target anionic surfactant in experiments, a small volume of sacrificial agent was first injected into the reservoir model. This was followed by injection of the primary (oil-displacing) surfactant composition, and subsequently by an aqueous polymer solution containing a diethanolamine. The diethanolamine increases Kd by desorbing previously adsorbed surfactant components. In combination with the polymer, this system exhibits synergistic effects.
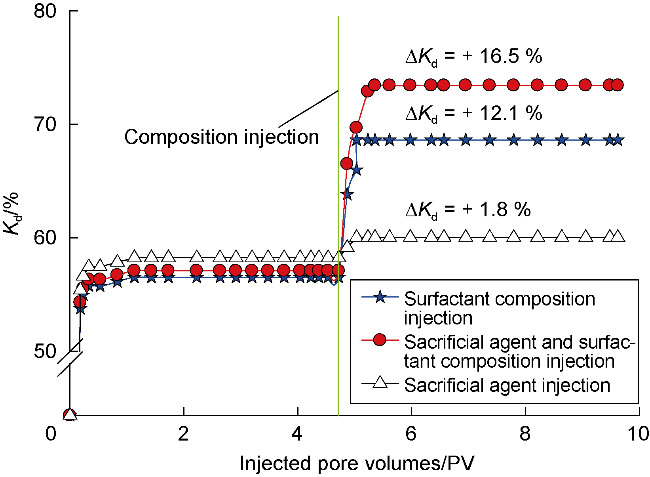
Fig. 3. Dependence of Kd for a linear model of a productive reservoir on the injected volume of liquid for the Kholmogorskoye oilfield. |
The efficiency criteria for evaluating chemical composition performance on the reservoir model include: the magnitude of Kd increase and changes in phase permeability relative to the baseline model. To assess surfactant and hydrogel composition effectiveness under varying injection sequences and technological conditions, additional core flooding experiments were conducted using both linear and parallel dual-permeability core models for the Volga-Ural oil province. The superior displacement performance observed in the low-permeability sections of the parallel reservoir model [40] demonstrates that when using a hydrogel based on thermostable sulfonated polyacrylamide (AN 125 SH grade), high-permeability zones become effectively blocked. These zones would otherwise lead to inefficient surfactant consumption, as flow through water-flushed channels contributes minimally to oil recovery while diverting surfactant compositions into the low-permeability regions. This redistribution mechanism significantly enhances oil recovery.
To evaluate the performance of integrated EOR technology, two reference core flood experiments were conducted on linear core models under conditions simulating the Timan Formation sandstones of Zarechnoye oilfied in Volga-Ural oil province. Experiment 1 involved injection of Surfactant 2, while Experiment 2 used the integrated EOR technology. The procedures of Experiment 2 include: (1) Carry out basic waterflooding until displacement parameters are stabilized, to form residual oil saturation of the model; (2) Inject 0.3 PV fresh water to remove polyvalent metals from the wellbore zone and reduce surfactant losses; (3) Inject 0.3 PV cross-linked gel (No. 6 hydrogel composition in Table 1), to block highly permeability filtration channels; (4) Inject 0.3 PV sacrificial agent to reduce the adsorption of components of the primary surfactant slug; (5) Inject 1.0 PV primary surfactant slug (Surfactant 2), to displace residual oil by forming a primary surfactant rim; (6) Inject 0.3 PV PAM and diethanolamine (2%), to enable the alignment of the displacement front and the desorption of surfactant slug components; (7) Flood with formation water until oil displacement rates stabilize, to displace residual oil with water/advancement of the oil bank to the bottom of the production well. The same experimental conditions as Experiment 2 were used in Experiment 1, except for steps (3), (4), and (6), where 0.3, 0.4, and 0.3 PV simulated formation water (brine) were injected instead of chemical reagents. It should be noted that, in this work, the mild organic base diethanolamine was used instead of strong base components in previously alkaline-surfactant- polymer (ASP) flooding [60-63]. This approach can mitigate the precipitation risk of poorly soluble salts during ASP-flooding, while enabling an interaction of the alkaline agent with polyvalent metal cations (water softening) and expanding the system's optimal salinity range for achieving ultra-low IFT at the surfactant-reservoir oil boundary [64]. Figs. 4 and 5 show the displacement efficiency, pressure gradient and oil saturation in Experiments 1 and 2.
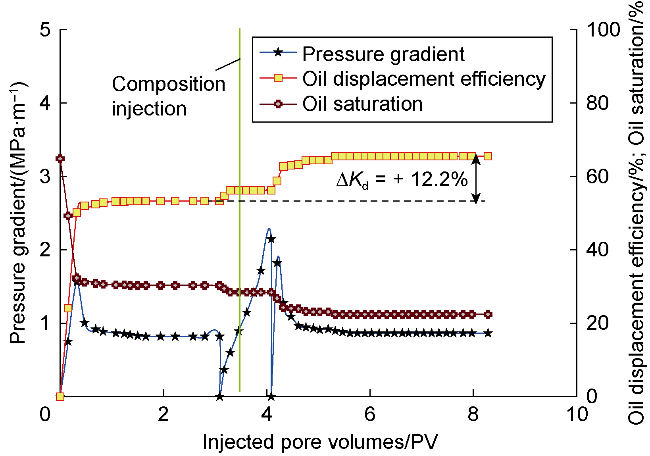
Fig. 4. Dependence of oil displacement efficiency, oil saturation and pressure gradient on the injected volume of liquid in Experiment 1. |
Notably, the oil displacement efficiency of waterflooding in Experiment 1 significantly exceeds that in Experiment 2, despite the lower core permeability in the former case. This discrepancy results from the use of a disintegrated core in Experiment 1 compared to the consolidated core from an analogous formation in Experiment 2. The displacement coefficient (Kd) increased by 12.2 percentage points following injection of 1.0 PV Surfactant 2 (2%) solution after waterflooding in Experiment 1. In contrast, Experiment 2 demonstrated a 21.0-percentage-point increase in Kd when implementing the complete sequence of chemical reagent injections using the integrated EOR technology (Table 5). Experiment 2 showed substantially greater core permeability reduction compared to the minor decrease in Experiment 1, resulting from the cross-linked hydrogel injection - the sweep efficiency improvement slug.
Table 5. Results of flooding experiments |
| Experiment No. | Water phase permeability/10−3 µm2 | Kd/% | Increase in Kd/% | ||
|---|---|---|---|---|---|
| Before injection of the composition | After injection of the composition | Before injection of the composition | After surfactant injection | ||
| 1 | 0.87 | 0.83 | 53.3 | 65.5 | 12.2 (0.9) |
| 2 | 22.70 | 2.70 | 46.2 | 67.2 | 21.0 (1.3) |
Note: The standard deviation calculated from the results of three measurements is given in brackets. |
While conventional cases show pressure drop reduction after reaching a maximum followed by stabilization, Experiment 2 demonstrated continuous pressure increase after injection of conformance control (CC) hydrogel and surfactants until 8 PV of water injection, after which stabilization occurred (Fig. 5). This phenomenon may be attributed to interactions between the anionic surfactant and adsorbed polyacrylamide gel, specifically through hydrophobic interactions between the surfactant's alkyl and aryl groups and PAM's carbon backbone. These interactions led to the formation of new surfactant-polymer conformational structures, which manifest during flooding as a gradual increase of pressure gradient by continuously creating a flow resistance, ultimately diverting the fluid flow to enhance the sweep efficiency in layered heterogeneous formations. Previous studies report similar complex formation between sulfanol and PAM [65], known to improve treatment efficiency in both near-wellbore and deep formation zones [66].
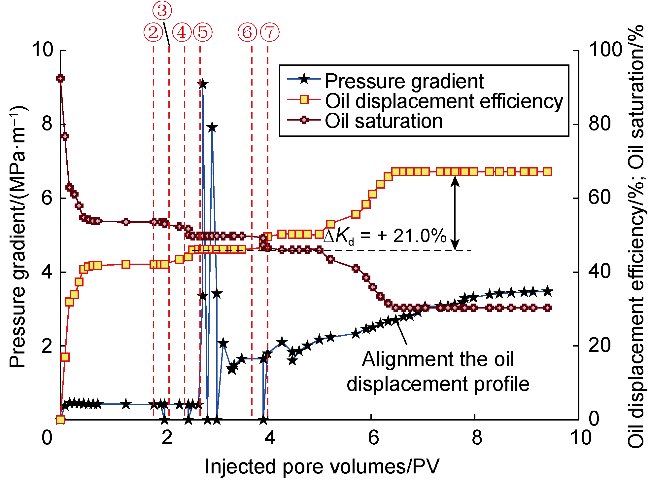
Fig. 5. Dependence of oil displacement efficiency, oil saturation and pressure gradient on the injected volume of liquid in Experiment 2. |
Apart from the above-mentioned factors, dynamic blocking effect is believed to be a contributor to the increase of pressure gradient. Experiments with micromodels were designed to detect dynamic blocking effects during microemulsion flow in porous media and microchannels. Our previous work [49] demonstrated that inverted emulsions exhibit residual resistance factors during porous media flow, while dynamic blocking occurs during fracture and microchannel flow. Dynamic blocking is characterized by 3-4 order-of-magnitude flow rate reduction through micromodels. For microemulsions, their flow in water-saturated porous media actually slightly increases permeability, characteristic of surfactant solutions as the microemulsion structure breaks down. In actual porous media, the permeability reduction during microemulsion flow described in this study occurs exclusively in pore channels with diameters multiples of microemulsion globule sizes − specifically in supercollectors. This dynamic blocking phenomenon explains the unusual pressure gradient increase in Experiment 2, which manifests after injecting 4 PV of fluid. Consequently, oil displacement from conventional pore spaces proceeds unimpeded, while flow through supercollectors becomes restricted. This represents an intelligent, permeability-selective reservoir impact technology.
In our case, both the primary surfactant and the sacrificial agent induced dynamic blocking, and the sacrificial agent's microemulsion reached dynamic blocking state much faster than the surfactant (20 s versus 60 s). The emulsion flow process exhibits strong dependence on stability degree. Regardless of stabilizer type (surfactants [56,67 -68], nanoparticles [69], or other stabilizers), the emulsion maintains its structural integrity during flow while dynamically adapting within porous media. Stable emulsions reconfigure during flow to match pore channel dimensions while retaining mobility and activity - properties exploitable for enhanced oil recovery applications.
Field trial results at the Zarechnoye field (JSC Geotech) provide indirect confirmation of this mechanism. In December 2023, Well 58 received 4.56 metric tons of the 2% Surfactant 2 solution prepared with 225 m3 of formation water. Over fifteen months monitoring (as of March 2025), the operator recorded incremental production averaging 285.74 t per ton of commercial reagent (active substance content less than 20%). Notably, production response emerged within three months - atypical for conventional oil-displacing formulations but characteristic of conformance control treatments targeting super-permeability zones. Comparable results appear in Reference [68], documenting similar surfactant treatments where maximum production response occurred six months post-injection.
Complementary data comes from the Ivinskoye field pilot (JSC Tatnefteprom), where a modified surfactant composition 2 was injected [36,52 -53] at 0.4% concentration through the waterflood manifold system. The treatment utilized 1 225 m3 of solution containing 4.5 t of commercial reagent. This pilot yielded approximately 60 incremental tons per ton of commercial reagent within three months post-treatment.
2.4. Numerical simulation of the target reservoir
The results of laboratory experiments and pilot tests allow us to proceed with technology scaling and hydrodynamic modeling of the impact on the productive reservoir of a specific field. As a candidate, we selected the Nizhneluginetskoye oilfield (Gazpromneft-Vostok LLC) in the West Siberian oil and gas province. The Callovian- Oxfordian Yu1 reservoir in the pilot area as a whole contains residual oil reserves of 265.6×10⁴ t (category AB1: proved + probable) as of January 1, 2024, corresponding to the open pore volume of 27 352 320 m3, area of 41.9 km2; porosity of 16%, and average effective thickness of 4.08 m. The entire pilot area features the open pore volume of 3 916 850 m3, area of 4.0 km2, porosity of 16%, and average effective thickness of 6.07 m. The average oil production per well is 3.3 t/d for the Yu1 reservoir, but only 2.2 t/d for the pilot area. The current water cut of the produced fluid is 91.4% for the Yu1 reservoir, and up to 95.8% for the pilot area. These parameters clearly indicate the necessity of applying EOR methods to access the remaining oil reserves. Based on geophysical studies of the target area, the volume of high-permeability flow channels already swept by injected water was estimated at approximately 190 m3.
Subsequently, we utilized updated reservoir models developed in accordance with the current field development plan (as of January 1, 2023) to simulate reservoir treatments with various surfactant volumes. Fig. 6 presents the simulation results. It can be seen that the difference between calculated and actual values does not exceed permissible deviations according to current regulations for reservoir model quality assessment: ±10% for annual production and ±5% for cumulative production. Thus, the reservoir model is verified suitable for production prediction.
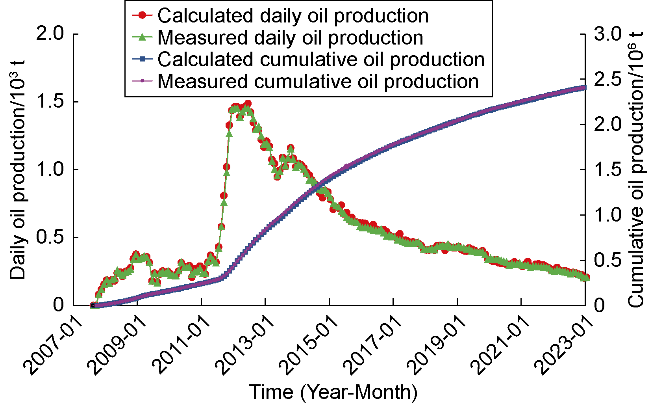
Fig. 6. Simulation results of the target reservoir. |
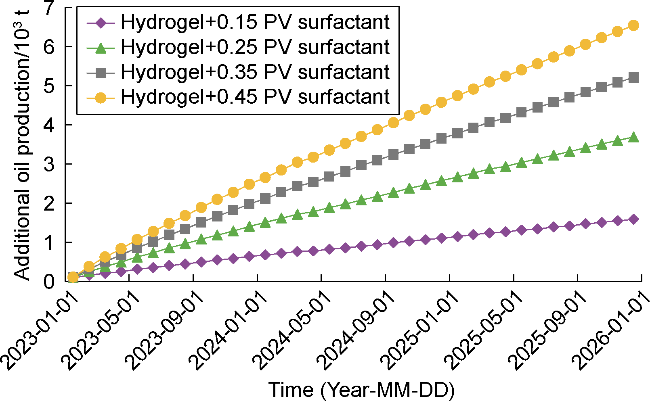
To analyze the impact of injected volume on reservoir stimulation results, forecast simulations were conducted for five injection scenarios of Surfactant 2 (0, 0.15, 0.25, 0.35, 0.45 PV): Scenario No. 1 (baseline) - water injection without chemical agents; Scenario No. 2 to No.5 - pre- injection of 190 m3 hydrogel (Table 6, hydrogel No. 20). A constant bottomhole pressure was maintained in both production and injection wells throughout the three-year forecast period (January 2023 - January 2026). The simulation results presented in Fig. 7 demonstrate a higher treatment effect as more chemical agent is injected into the reservoir. Typically, the scenario combining hydrogel injection (190 m3) with surfactant composition injection at 3 150 m3 yields the highest cumulative oil production increase of 6 851 t compared to the baseline case. These findings align with previous field tests of EOR methods [70], where similar calculations showed good agreement (±10%) between predicted and actual incremental oil production results.
Table 6. Parameters for numerical simulation |
| Scenario No. | Injected volume of surfactant/PV | Injected volume of hydrogel/m3 | Injection volume of surfactant/m3 | Duration of injection/ months |
|---|---|---|---|---|
| 1 | 0 | 0 | 0 | 0 |
| 2 | 0.15 | 190 | 1 050 | 0.23 |
| 3 | 0.25 | 190 | 1 750 | 0.39 |
| 4 | 0.35 | 190 | 2 450 | 0.54 |
| 5 | 0.45 | 190 | 3 150 | 0.70 |
Fig. 7. Additional oil production for different scenarios. |
The core flood experiments and reservoir simulation studies demonstrate the potential for using a combined technology of cross-linked hydrogel and surfactant composition for oil reservoir treatment. This technology can be successfully applied in the Jurassic and Lower Cretaceous reservoirs of Western Siberia, as well as in Devonian deposits of the Volga-Ural oil province, and other reservoirs with similar geological and physical characteristics. The primary limiting factor for direct application of alkyl and aryl sulfonate-based surfactant technology is the formation water salinity, which can significantly affect surfactant solution interfacial tension. To mitigate the negative impact of high salinity water when using surfactant slugs in the Volga-Ural oil province, the surfactant solution is injected in fresh water, or preceded by a fresh water slug. Notably, several percent increase in Kd is observed from low salinity water injection (Fig. 5, after injecting 2.1 PV). This is expected, as the slight oil recovery improvement from low-salinity flooding is well-documented [70-74].
Another characteristic of the West Siberian oil province is the presence of super-permeability zones ("super-reservoirs") with exceptionally low flow resistance, typically identified through tracer studies [75-77]. This is not a local phenomenon but rather a global occurrence. Fractured sandstones and cavernous-fractured carbonate reservoirs provide favorable conditions for substantial hydrocarbon accumulation, even under significant tectonic activity. Approximately 50% of global oil reservoirs are sandstones, often containing high-permeability zones. Examples include Chinese oil sandstones [78-79]; Middle Eastern fields like Kuwait's Minagish Burgan reservoirs; Western Siberian Jurassic reservoirs [53]; UK and Irish sandstone reservoirs [80]; Kentucky's Berea sandstone and other US formations [81]; Kazakhstan's viscous oil fields such as Buzachi Peninsula [82]. As highlighted by Seright et al. [4], the challenge of blocking major fractures/super-permeability zones with polymer hydrogels deserves particular attention. Therefore, addressing pore space heterogeneity and incorporating it into EOR design is essential for success - the central concept of our study.
3. Conclusions
This study presents an integrated enhanced oil recovery technology based on the injection of polyacrylamide-surfactant chemical compositions. Firstly, the hydrogel selected by oscillatory rheometry is injected to effectively block high-permeability zones, followed by the low-cost sacrificial agents. Next, a mixture of anionic and non-ionic surfactants is injected to mobilize residual oil. Finally, a PAM solution containing diethanolamine is injected. This process achieves enhanced oil recovery while optimizing the single-well chemical agent consumption.
The technological synergy arises from the following procedures: the PAM hydrogel is injected firstly to block high-permeability zones; after injectivity profiles are normalized, the surfactant composition is diverted to previously unswept low-permeability zones, in order to improve the sweep efficiency, and finally, the surfactants are employed to mobilize the unswept residual oil. The core flooding tests and reservoir simulation studies demonstrate the effectiveness of the integrated EOR technology. In the core flooding tests, the sequential injection of hydrogel and surfactant enables a prolonged period of rising pressure gradient and a significantly enhanced oil recovery in subsequent waterflooding stage, further improving the sweep efficiency in layered heterogeneous reservoirs, which was recorded by a 21-percentage-point increase in displacement efficiency. According to the numerical simulation on the target reservoir in the West Siberian oil province, the injection of 190 m3 hydrogel + 3 150 m3 surfactant yielded an additional oil production of 6 851 t in three years.
Nomenclature
G°—elastic modulus, Pa;
G"—viscous modulus, Pa;
G*—complex shear modulus, Pa;
R2—correlation coefficient;
γ—strain, dimensionless;
Kd—oil displacement coefficient, %;
τ—shear stress, Pa;
µ—viscosity, Pa·s;
ω—angular frequency, rad/s;
t—time, s;
δ—phase difference, rad;
i—imaginary unit.